2017 2nd International Conference on Software, Multimedia and Communication Engineering (SMCE 2017) ISBN: 978-1-60595-458-5
User Behavior and Devices Analysis of a Large-scale Wireless Local
Area Network Based on DHCP
Qin LYU
*and Hai-bo WANG
Department of Computer Science and Technology, Tsinghua University, China
Institute for Network Sciences and Cyberspace, Tsinghua University, China
Tsinghua National Laboratory for Information Science and Technology, China
*Corresponding author
Keywords: DHCP, MAC, User behavior, Device, Wireless local area network.
Abstract. The Dynamic Host Configuration Protocol (DHCP) is used to effectively allocate IP addresses on a local area network. Despite the widespread usage of DHCP, few studies related to users exist on DHCP server logs, and even less is known about the user behavior and devices of a large-scale wireless local area network (WLAN). In this paper, we propose a methodology to feasibly analyse mobility and concentration of users and generally analyse the temporal distribution and the providers’ distribution of wireless devices. The method is not involved with user privacy and safety, and fully explores available DHCP metrics and logs. Our results show that individual users are more likely to concentrate in labs and classrooms on weekdays while they prefer to concentrate in their dormitory and library on the weekends. The online time of 80% of wireless devices is less than 10 hours and the provider Apple takes nearly 50% of all wireless devices according to the data set of T University. We except similar benefits to arise for analyzing large-scale WLAN and optimize DHCP.
Introduction
As more and more people rely on the wireless devices, wireless networks have become increasingly important. Despite the fact that DHCP [1] is widely used in wireless network, few studies related to users on DHCP server logs, more studies are related to the configuration or the protocol itself. For example, Brick et al. [2] studied the influence of lease times on performance. Ioannis et al. [3] proposed a new leasing strategy to optimize the address utilization without considerably increasing the DHCP overhead. This paper focuses on studying how to analyse user behavior and devices of a large-scale WLAN based on DHCP, and our measurement is one of the largest-scale WLAN measurements.
Additionally, we propose an approach that sufficiently use available DHCP metrics and logs of the DHCP server and make the following contributions: We propose a methodology which can feasibly analyse mobility and concentration of users and generally analyse the temporal distribution and the providers’ distribution of wireless devices. We observe that the user habits can be analyzed by the temporal distribution of wireless devices, and the regularities of distribution of online time of wireless devices are uncorrelated to any day of the week. We find that the total number of wireless devices and providers is related to the specific day of a week, and the provider Apple takes nearly 50% of all wireless devices according to the campus WLAN.
Data Set and Methodology
This section describes our large-scale campus WLAN (WLAN), DHCP measurement data set, and methodology for analyzing user behavior and devices.
Measurement Environment. We study the campus WLAN in the T University, which covers an area about 4 km2, with about 42000 students and 14000 faculty members. The WLAN of T University is a large-scale WLAN with an address pool of more than 64000 IP addresses and a peak usage of over 17000 concurrent IP addresses. The campus WLAN consists of the 13 wireless controllers (ACs) and more than 2500 APs serving over 86000 wireless devices in more than 100 buildings. The APs’ types are all Cisco Aironet series, which must be controlled and configured by the 13 ACs. The ACs control the AP transmission power dynamically to avoid interference among APs [4]. The campus WLAN covers some virtual local area networks (VLANs), and all wireless devices discover and request messages from one DHCP server.
Data Set. The applications of DHCP in common industry practice are readily available [5]. We collect the DHCP server logs recorded in the campus WLAN DHCP server from April 6, 2016 to April 12, 2016 to conduct the research. We present the results in a seven-day trace because it can describe a typical week on campus, and other weeks are similar. Each entry in the DHCP server logs represents a single message, each single message covers 18 fields, and the most important five fields are the type of message, the creation date of the message, the creation time of the message, MAC address of the wireless device, and the allocated IP address. We use the MAC address of a wireless device to uniquely identify an individual user. What’s more, considering the size of the address pool and the number of the active devices, the campus WLAN is an order of magnitude larger than other public DHCP studies [2].
Methodology. User behavior analysis of a large-scale WLAN mainly presented as the analysis of user mobility and user concentration in this paper. By creating an index table using MAC address as the key and mapping these IP addresses with the fine-grained geographical location, as we will describe later, we can analyse user mobility and user concentration. User devices analysis of a large-scale WLAN indicates analysis of the temporal distribution of wireless devices and the providers’ distribution of wireless devices.
User Behavior Analysis of a Large-scale Wireless Local Area Network
In this section, based on the DHCP traces, we mainly analyze user behavior from the perspectives of user mobility and user concentration. Firstly, we describe the methods to trace user location. After that, we study the user habits by analyzing user mobility. At last, we take an initial look at the user concentration in T University.
Tracing User Location. In general, a MAC address can uniquely identify an individual user. In addition, all traces in DHCP server logs consist of the MAC address of a given device. By creating an index table using MAC address as the key, we can get all allocated IP addresses associated with a given MAC address in a specific time period. By mapping these IP addresses to geographical locations, we can further get all geographical locations where the MAC address (an individual user) have roamed during a specific time period. Note that we map IP address to geographical location by the name of associated AP which contain geographical location information, and all information about AP is recorded in SNMP data, which are easily acquired by polling ACs.
sequence, are Department A Building, Dining Hall A Building, Department B Building, Gymnasium A Building.
Table 1. Mapped Logs of DHCP Server Logs and Related Locations of the User.
ID Date Time Description IP Address MAC Address APLocation
15 04/7/16 11:50:25 NACK 101.5.a.f 549F13****** Department A
11 04/7/16 11:57:27 Renew 101.5.b.g 549F13****** Dining Hall A
11 04/7/16 12:00:18 Renew 101.5.b.g 549F13****** Dining Hall A
11 04/7/16 12:00:42 Renew 101.5.b.g 549F13****** Dining Hall A
11 04/7/16 12:03:11 Renew 101.5.b.g 549F13****** Dining Hall A
11 04/7/16 12:07:13 Renew 101.5.b.g 549F13****** Dining Hall A
11 04/7/16 20:27:32 Renew 101.5.c.g 549F13****** Department B
11 04/7/16 20:32:48 Renew 101.5.d.h 549F13****** Gymnasium A
15 04/7/16 22:09:09 NACK 101.5.e.i 549F13****** Gymnasium A
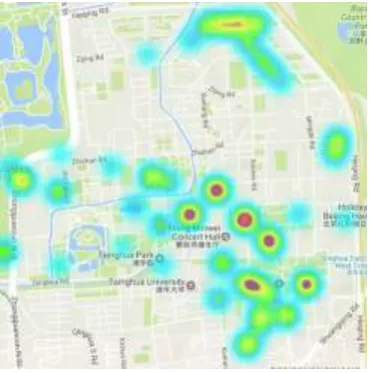
Analysis for User Concentration. Without loss of generality, we analyze the user concentration of T University on Wednesday (representing weekday) in Fig.1 and Saturday (representing weekend) in Fig. 2. We observe that individual users are more likely to concentrate in labs and classrooms on weekdays while they prefer to concentrate in dormitory and library on the weekends. The phenomena are mainly because the students usually have classes in the class or do research in library on weekdays, and they often have a rest in dormitory or study in library on the weekends.
[image:3.595.340.523.389.578.2]
Figure 1. The User Concentration in Wednesday. Figure 2. The User Concentration in Saturday.
User Devices Analysis of a Large-scale Wireless Local Area Network
The user devices analysis of a large-scale WLAN consists of two parts, one is the temporal distribution of wireless devices, and the other is the manufacturers and providers of wireless devices.
Temporal Distribution of Wireless Devices. We map MAC addresses and related timestamps of the same DHCP server logs to analyse the temporal distribution of wireless devices.
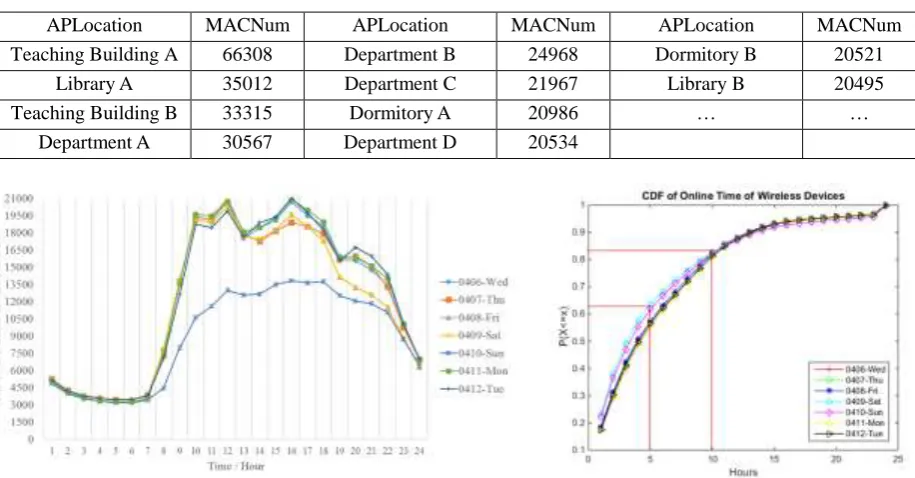
[image:3.595.73.258.391.578.2]Furthermore, there are similar trends of all the seven curves: 0:00-7:00, gradually decrease; 7:00-10:00, gradually increase; 10:00-18:00, relatively stable; 18:00-24:00, gradually decrease. This interesting observation can be explained by the fact that people use less wireless devices in the night and more wireless devices in the daytime, and the usage trend characteristic of wireless devices of the daytime presented as increasing - keeping stability - decreasing. Likewise, the total number of wireless devices in the seven curves of the figure peak around the four time periods of a day: 9:00-10:00, 11:00-12:00, 15:00-16:00 and 20:00-21:00. All of them highly coincide with the time period of finishing classes of the first and second classes in the morning, the first class both in the afternoon and evening in T University, which roughly correspond to the students’ habits of finishing classes.
[image:4.595.69.527.345.584.2]By analyzing the online time of each MAC address in the DHCP server log and the total amount of each online time, we get Fig. 4. Fig. 4 shows the CDF of online time of wireless devices using all the MAC addresses associated at the whole hours of our seven-day study period. It shows that the online time of wireless devices less than 5 hours is a little more than 60%, while the wireless devices of online time reaches 10 hours or even longer in nearly 20% case, which means the online time of most of wireless devices is less than 10 hours. What’s more, we can find that the variation tendency of all the seven curves of the figure is very similar, which means the regularities of distribution of online time of wireless devices are uncorrelated to any day of the week.
Table 2. The Table of the Building and Related MAC Addresses Amount (More Than 20000) in April 6, 2016.
APLocation MACNum APLocation MACNum APLocation MACNum
Teaching Building A 66308 Department B 24968 Dormitory B 20521
Library A 35012 Department C 21967 Library B 20495
Teaching Building B 33315 Dormitory A 20986 … …
Department A 30567 Department D 20534
Figure 3. The Usage Trend of Wireless Devices of the Week.
Figure 4. CDF of Online Time of Wireless Devices.
Providers Distribution of Wireless Devices. As we all know, the six front hexadecimal numbers of each MAC address are used to identify the providers of the wireless device according to the administration of the Organizationally Unique Identifier (OUI) of IEEE. Therefore, we analyse the manufacturers and providers of wireless devices by extracting six front hexadecimal numbers of each MAC address and mapping MAC addresses with the information of manufacturers and providers.
show the tendency of increasing - keeping stability – decreasing, and we can get the result that the total number of wireless devices and providers is related to the specific day of a week.
By analyzing the total number of MAC addresses of each provider in the whole week from April 6, 2016 to April 12, 2016, we get Fig. 6: the use ratio of wireless devices in the whole week. We can get the result that the nine most widely used providers are: Apple, Intel, HUAWEI, Hon Hai, Samsung, Xiaomi, Liteon, MEIZU and Murata, and especially the provider Apple, which takes nearly a half of the total number of all wireless devices in the whole week.
[image:5.595.319.518.172.300.2]
Figure 5. The Variation Tendency of the Total Number of Wireless Devices and Providers in the Week.
Figure 6. The Use Ratio of Wireless Devices in the Whole Week.
Conclusion
This paper presents a large-scale analysis study on the Enterprise Wireless Local Area Network using available DHCP metrics and logs. We show that the mobility and concentration of users can be analyzed using DHCP server logs. We observe that the user habits can be analyzed by the temporal distribution of wireless devices, and the online time of 80% of wireless devices is less than 10 hours. However, the regularities of distribution of online time of wireless devices are uncorrelated to any day of the week. Furthermore, we observe that the total number of wireless devices and providers is related to the specific day of a week, and the provider Apple takes nearly 50% of all wireless devices according to the data set of T University.
We believe our work is a step towards understanding in a large-scale WLAN, and the interaction between users and WLAN. Our future work includes investigating network management using DHCP, and optimize the configuration of DHCP.
Acknowledgement
We would like to thank the reviewers for their valuable comments. Moreover, we sincerely appreciate Muzi Li and Fenghua Li for their useful guidance on the architecture of the campus WLAN of T University. This research was financially supported by the National Key R&D Program of China.
References
[1] R. Droms. Dynamic host configuration protocol. RFC 2131, IETF, March 1997.
[2] V. Brik, J. Stroik, and S. Banerjee. Debugging DHCP performance. In Proceedings of the 7th ACM SIGCOMM Internet Measurement Conference, pages 257–262. ACM, 2004.
[3] Papapanagiotou I, Nahum E M, Pappas V. Configuring DHCP leases in the smartphone era[C]//Proceedings of the 2012 ACM conference on Internet measurement conference. ACM, 2012: 365-370.
[4] Cisco Wireless LAN Controller Configuration Guide, Release 7.0.98.0. http://www.cisco.com/c/en/us/td/docs/wireless/controller/7-0/configuration/guide/c70.html.
[image:5.595.59.290.174.300.2]