2017 2nd International Conference on Information Technology and Industrial Automation (ICITIA 2017) ISBN: 978-1-60595-469-1
Study on Assessing Drivers' Comprehensive
Quality Based on CAN Data
Jiabo Zhang and Chaofan Wang
ABSTRACT
Annually, there are thousands of traffic accidents casually in the world, so it is extremely important to research behavior of drivers in current days. To achieve it, we set up a platform to gather CAN data from vehicles independently. In this paper, three assessment indexes such as driving safety, riding comfort and fuel consumption of vehicles were put forward for assessing drivers’ comprehensive quality based on CAN data. This paper analyzed these indexes from the entropy of steering wheel angle, vehicle speed and other 7 factors. Firstly, this paper used FAHP to establish a single factor weight vector. Then the paper calculated the single factor fuzzy judgment matrix by membership functions. Finally, we assessed the driver's comprehensive quality by maximum membership. The practices proved that this model provides a simple and effective for assessing the comprehensive quality of drivers.
INTRODUCTION
World Health Organization's global road safety report: There are 1.24 million people die from traffic accidents and 50 million people are disabled every year, more the 85% of the traffic accidents are related to driver[1,2]. So it is important to research driver behavior, which can give highly individualized persuasion for drivers to improve road traffic safety.
_______________________
In this paper, we set up a real-time data acquisition platform to gather CAN (control area network, CAN) data of vehicle. Assessing drivers' comprehensive quality is a complex process of various information fusion. Different information reflect different assessment indexes. For example, the standard deviation of the steering wheel angle and the change of acceleration reflects the driver's ability to control the vehicle[3]. The entropy of steering wheel angle and eye movements reflect the driver's fatigue or drunk driving state[4-6]. In 1965, Professor L.A. Zadeh is proposed theory of fuzzy logic based on fuzzy set firstly[7]. The theory solves the indefinite and fuzzy problem with the strict mathematical logic. Myounggyu Won et al. integrated fuzzy logic into a traffic congestion control algorithm, which reduced traffic congestion effectively [8]. Ryan A. McGee et al. proposed a fuzzy established an adaptive fuzzy logic system to predict the preference degree of the driver using the cruise system accurately[9].
We summarize the contributions of this paper: 1. To determine the indexes and parameters of assessment. 2. To use FAHP (Fuzzy Analytic Hierarchy Process, FAHP) combined fuzzy logic to assess drivers’ comprehensive. 3. The practices prove that this model is useful.
PARAMETERS OF ASSESSMENT
Data Gathering
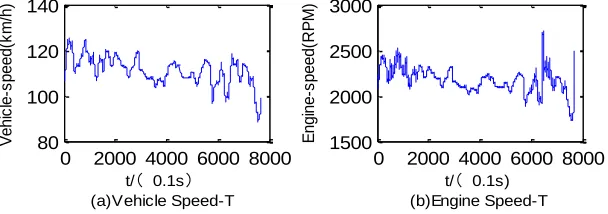
CAN (control area network CAN) is a communication protocol based on bus topology, which is used to control the communication between the internal ECU orderly. We set up a platform based on CAN bus protocol to gather data. Surface Pro 4 is used as the main controller, which links with openxc dongle by Bluetooth. The dongle links with OBD2 (on-board diagnostic II OBD2) interface of vehicle. The main controller parses the frame to gather data by serial communication information from the openxc dongle. CAN data is saved to local disk, including steering wheel angle, longitude, latitude and so on over 20 items. The platform is shown in Figure 1.
Some data of CAN are shown in Figure 2. The subgraph (a), (b) show the relationship between the vehicle speed, the engine speed and time, respectively.
Index and Factors of Assessment
We assess driving safety index and riding comfort index from the entropy of
steering wheel angle H, the rate of steering wheel angle V, the entropy of vehicle
speed Hv, the absolute value of acceleration a, the acceleration intensity (rate of
Openxc dongle
Bluetooth
serialport CAN BUS
OBD 2
Figure 1. The platform diagram for data gathering.
0 2000 4000 6000 8000 80
100 120 140
t/( 0.1s) (a)Vehicle Speed-T
V
e
h
ic
le
-s
p
e
e
d
(k
m
/h
)
0 2000 4000 6000 8000 1500
2000 2500 3000
E
n
g
in
e
-s
p
e
e
d
(RP
M
)
[image:3.612.150.454.170.277.2]t/( 0.1s) (b)Engine Speed-T
Figure 2. The relationship between some CAN data and time.
In this paper, we improved the SE (steering entropy, SE) as follows.
) ( ) ( )
(n n p n
e , (1)
where (n) and p(n) are actual value and predictive value of steering wheel
angle at n moment, respectively. p(n) is based on the values of steering wheel
angle at the moment of n-1, n-2 and n-3. The mathematical equation p(n) are given
by (2):
) 2 1 2 2 5 )] (
) [(
2 1 )
( ( 1) ( 2) ( 1) ( 2) ( 2) ( 3) ( 1) ( 2) ( 3) )
1 ( )
(n n n n n n n n n n n
p
. (2)
We calculated =0.3 that meets the equation P
0e(n)
90% . Weredivided e(n) into the following 9 intervals given by (3) to calculate H (4).
, 5 , 5 , 3 , 3 , 2 , 2 , 3 5 , 3 5 , 3 4 , 3 4 , , , 3 2 , 3 2 , 2 1 , 3 2 , 2 1 , 2 1 ,
0
. (3)
i
i i
P P
H 9
9
1
log ) (
, (4)
Where Pi is the probability distribution of e(n) in each interval. The calculations
of Hv is similar to equation (4). But because the different physical properties
difference into the following 9 intervals given by (5) to calculate Hv:
, 3 , 3 , 2 5 , 2 5 , 2 , 2 , 3 5 , 3 5 , 3 4 , 3 4 , , , 3 2 , 3 2 , 2 1 , 3 2 , 2 1 , 2 1 ,
0
. (5)
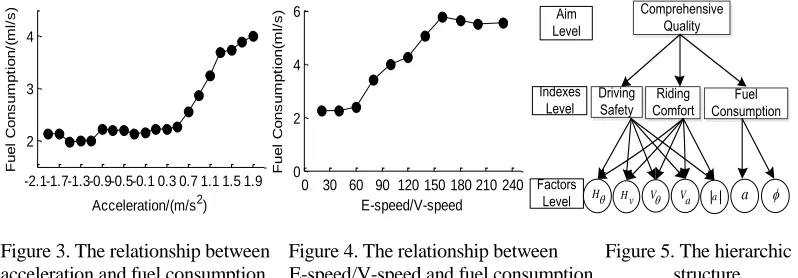
Fuel consumption index is assessed from positive acceleration a and the ratio of engine speed and vehicle speed . reflects automobile force traction in a sense, which is positive related to fuel consumption in the gross. The relationship between
a, and fuel consumption shows in Figure 3, Figure 4. When a0m/s2, the fuel
consumption is basically stable. When 0a1.3m/s2, the fuel consumption rise gradually and rising faster and faster. when a1.3m/s2. When 0160, the
fuel consumption is increased obviously. When 160, the fuel consumption is basically stable.
ASSESSMENT MODEL
Single Factor Weight Vector
The model considered driver's comprehensive quality as aim. Three indexes are considered as the index layer. Seven factors are considered as factor layer. We established the hierarchical structure as shown in Figure 5.
FAHP is used to calculate ordering vector and called single factor weight vector[10]. The main steps see as follows:
Construct fuzzy complementary judgment matrix:
The fuzzy complementary judgment matrix is used to show the relative importance of all factors in this layer to the upper level. The model uses 0.1-0.9 scaling method to construct fuzzy complementary judgment matrix:
mxm ij
a A( )
, (6)
Where a(ij) expresses the importance of factor ai compared to aj for the upper factor.
-2.1-1.7-1.3-0.9-0.5-0.1 0.3 0.7 1.1 1.5 1.9 2
3 4
Acceleration/(m/s2)
Fu
e
l
C
o
n
s
u
m
p
ti
o
n
/(
m
l/
s
)
0 30 60 90 120 150 180 210 240 0
2 4 6
E-speed/V-speed
Fu
e
l
C
o
n
s
u
m
p
ti
o
n
(m
l/
s
)
Indexes Level
Factors Level
Comprehensive Quality
Driving
Safety ComfortRiding ConsumptionFuel Aim
Level
[image:5.612.99.498.87.226.2]H H v V Va a a
Figure 3. The relationship between Figure 4. The relationship between Figure 5. The hierarchic acceleration and fuel consumption. E-speed/V-speed and fuel consumption. structure.
The sum of each row of complementary judgment matrix is given by (7), mathematical transformation as equations (8):
) ... 3 , 2 , 1 ( 1
m i
a
r m
k ik
i
, (7)
5 . 0 ) 1 (
2
m r r fij i j
. (8)
So fuzzy consistent matrix is as follows:
m m j i
f R( )
. (9)
1. Calculate ordering vector:
Fuzzy consistent matrix is transformed into reciprocal judgment matrix
mxm j i e
E( ) . (10)
Where eij fij / fji. The equation of ordering vector is as follows
,...) 2 , 1 , 0 ( ) ( 1
~
k EW
W k
k
. (11)
m
i K K
k W W
W
1 1 ~ 1 ~
1 /
. (12)
m i
k i W k i
W 1 , 1,2,3,...,
. (13)
k1
W is ordering vector that we need.
We established the single factor weight vector of factors level for aim level:
, ,
' [0.1181,0.0967,0.1785,0.1230,0.1596,0.1764,0.1478]* 1 2 3
1
Q Qa Qa Qa
Q .(14)
Where Q1 is the weight vector of index level for aim level,Qa1,Qa2,Qa3are
weight vectors of 7 factors (,a,H,Hv,V ,Va, a ) for indexes such as safety, comfort, and fuel consumption, respectively.
Single Factor Fuzzy Judgment Matrix
The model requires us to establish a set of comments for the assessment of the driver's comprehensive quality:
1, 2, 3, 4, 5
BEST,BETTER,MODEST,WORSE,WORST
Single factor fuzzy judgment refers to determine membership vector of the assessment from single factor. These vectors of 7 factors construct a matrix called single factor fuzzy judgment matrix[10]. We use the principle (3 ) to eliminate the abnormal data, and normalize the value by Max-Min principle. Then, we set up two different sets of functions as membership functions according to the discrete degree
of normalized value distribution. As for H, Hv and the membership function is
9 . 0 1 9 . 0 7 . 0 7 . 0 1 ] 1 ) 2 1 2 . 0 9 . 0 [sin( 2 1 0 ) ( 9 . 0 9 . 0 5 . 0 5 . 0 0 ] 1 ) 2 1 2 . 0 7 . 0 [sin( 2 1 0 ) ( 7 . 0 7 . 0 3 . 0 3 . 0 0 ] 1 ) 2 1 2 . 0 5 . 0 ( [sin 2 1 0 ) ( 5 . 0 5 . 0 1 . 0 1 . 0 0 ] 1 ) 2 1 2 . 0 3 . 0 [sin( 2 1 0 ) ( 3 . 0 3 . 0 1 . 0 1 . 0 0 0 ] 1 ) 2 1 2 . 0 1 . 0 [sin( 2 1 1 ) ( 5 4 3 2 1 X X X X X r X X X X X r X X X X X r X X X X X r X X X X X r .(15) 6 . 0 1 6 . 0 5 . 0 5 . 0 1 ] 1 ) 2 1 1 . 0 6 . 0 [sin( 2 1 0 ) ( 6 . 0 6 . 0 4 . 0 4 . 0 0 ] 1 ) 2 1 1 . 0 5 . 0 [sin( 2 1 0 ) ( 5 . 0 5 . 0 3 . 0 3 . 0 0 ] 1 ) 2 1 1 . 0 4 . 0 [sin( 2 1 0 ) ( 4 . 0 4 . 0 2 . 0 2 . 0 0 ] 1 ) 2 1 1 . 0 3 . 0 [sin( 2 1 0 ) ( 3 . 0 3 . 0 2 . 0 2 . 0 0 0 ] 1 ) 2 1 1 . 0 2 . 0 [sin( 2 1 1 ) ( 5 4 3 2 1 X X X X X r X X X X X r X X X X X r X X X X X r X X X X X r .(16)
Where r1
X ,r2
X ,r3
X ,r4 X ,r5 X represent these membership belong to“BEST”, “BETTER”, “MODEST”, “WORSE” and “WORST”, respectively, X represent the normalize value of sample.
The normalized sample values X of ,a,H,Hv,V,Va,a , are substituted
the membership function (15), (16), respectively, to get all assessment vector of membership to get the single factor fuzzy judgment Matrix (17)
5 4 3 2 1 5 4 3 2 1 5 4 3 2 1 5 4 3 2 1 5 4 3 2 1 5 4 3 2 1 5 4 3 2 1 a a a a a V V V V V V V V V V H H H H H H H H H H a a a a a R a a a a a v v v v v . (17)
The final assessment vector is obtained by multiplying the single factor
EXPERIMENT
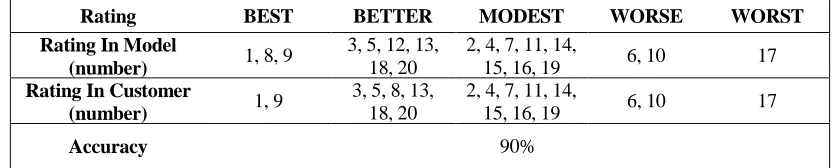
We chose 20 drivers numbered 1-20. They drive the car running the similar road to gathered CAN data. The model is used to rate their comprehensive qualities and then compare with their actual customer ratings. The results are shown in TABLE I. Experiments show that the accuracy of the model is 90%, which can distinguish the comprehensive quality of different drivers accurately, and make assessment not quantitatively but qualitatively.
Besides, we find drivers’ character or mood is related to their driving behavior.
Take the sixth line row vector Va of matrix (17) as an example. Single factor
judgment vector Va of the driver 9 is as follows:
] 0 , 0 , 0 , 1577 . 0 , 8423 . 0 [
a
V
whose membership is "BEST". Va characterizes the degree of pressing the
[image:8.612.87.507.348.432.2]accelerator in a sense, which may reflect drivers’ character. So we can assess that driver 9 may be cautious to do things, which is consistent with his actual character.
TABLE I. RATING ASSESSMENT OF 20 DRIVERS.
Rating BEST BETTER MODEST WORSE WORST
Rating In Model
(number) 1, 8, 9
3, 5, 12, 13, 18, 20
2, 4, 7, 11, 14,
15, 16, 19 6, 10 17
Rating In Customer
(number) 1, 9
3, 5, 8, 13, 18, 20
2, 4, 7, 11, 14,
15, 16, 19 6, 10 17
Accuracy 90%
CONCLUSIONS
The paper assesses the comprehensive quality of drivers based on CAN data. Firstly, we set up a platform to gather CAN data of vehicle. Then, we determine the indexes and factors of assessment. Finally, we use FAHP combined fuzzy logic to assess drivers’ comprehensive. The practices show that this model is effective for assessing the comprehensive quality of drivers. Furthermore, we find people’s character or moods is related to their driving behavior during driving, which is worth studying. This paper can guide that different quality of the driver takes different measures to avoid collision in traffic system of vehicle to vehicle(V2V), vehicle to pedestrian (V2P).
ACKNOWLEDGEMENTS
2. The National Key Scientific Instrument and Equipment Development Project of China (2012YQ20022404); 3. Education reform project of Chongqing University of Posts & Telecommunications (XJG1301).
REFERENCES
1. World Health Organization. 2016. “Global Forum for Road Safety Legislators launched in
London,” EB/OL. http://www.ourglobalforum.org/about/ 2016.
2. Ren Y, Peng H X. 2013. “Factors Affecting China Traffic Accident Casualties: An Empirical
Study,” J. Forecasting, 2013.
3. Tokuda S, Obinata q, Palmer E, Chaparro. 2011. “A. Estimation of Mental Workload Using
Saccadic Eye Movements in a Free-Viewing Task,” presented at Annual International Conference of the IEEE Engineering in Medicine and Biology Society, August 30 - September 3, t2011.
4. Okihiko Nakayama, Tohru Futami, Tomokazu Nakamura. 2013. “Development of a Steering
Entropy Method for Evaluating Driver Workload,” presented at SAE International Congress and Exposition Detroit, March 1-4, 2013.
5. Chi Zhang; Hong Wang; Rongrong Fu. 2014. “Automated Detection of Driver Fatigue Based on
Entropy and Complexity Measures,” J. IEEE Transactions on Intelligent Transportation Systems,
15(1): 168-177.
6. Yingying Jiao, Bao-Liang LU. 2016. “Detecting Slow Eye Movement for Recognizing Driver’s
sleep Onset Period with EEG Features,” presented at 38th Annual International Conference of the
IEEE Engineering in Medicine and Biology Society, August 16-20, 2016.
7. Azizzadeh L, Zadeh L, Zahed L,. 1965. “Fuzzy Sets, Information and Control,” J.
Information & Control, 8(3):338-353.
8. Myounggyu Won; Taejoon Park; Sang H.Son. 2014. “FuzzyJam: Reducing traffic jams using a
fusion of fuzzy logic and vehicular networks,” presented at 17th International IEEE Conference on
Intelligent Transportation Systems, October 8-11, 2014.
9. Shiqi Qiu, Ryan A. McGee, Yi L. Murphey. 2015. “Adaptive Fuzzy Prediction for Automotive
Applications Usage,” presented at IEEE 14th International Conference on Machine Learning and
Applications, December 9-11, 2015.
10. Yunli Yuan. 2013. “The Research on the Construction Engineering Project Risk Management based