2017 3rd International Conference on Computer Science and Mechanical Automation (CSMA 2017) ISBN: 978-1-60595-506-3
An Improved Algorithm for Highway Design Hourly Volume Calculation
Huai-Xin ZHAO
1,2and Kai-Ge WEN
31
School of Information Engineering, Chang’an University, Xi’an, China
2
Shaanxi Provincial Transport Department, Xi’an, China
3School of Electronic Control Engineering, Chang’an University, China
[email protected],[email protected].
Keywords: Highway, Traffic capacity of toll station, Design hourly traffic volume coefficient, Traffic volume forecast.
Abstract. The designed hour traffic volume is an important parameter in the construction of
highway toll station. It is usually calculated by using the ratio of the 30th traffic volume and annual average daily traffic volume. Based on toll data of Shaanxi highway, the method of calculating 30th hour traffic volume was improved in the paper. After deducting the national legal holiday period for the free passage of small passenger cars,the ratio of hourly traffic volume in smooth and annual average daily traffic was obtained as the designed hour traffic volume coefficient. This algorithm is more scientific and accurate and easy to implement. It meets the requirement of highway toll station traffic volume forecast.
Introduction
Background
Highway with advantages of safety, comfort and economy plays a prominent role in the whole road system. And traffic congestion will not only greatly reduce highway efficiency, but also cause a huge waste of social resources. In addition, the highway toll station size and lane number also have a decisive effect on the construction investment and operational staffing. For example, the toll station will be the traffic "bottleneck", leading to continuous increase of waiting vehicle, reducing service level and causing environmental pollution at the same time if the traffic demand is greater than the traffic capacity of toll station; conversely, it will result in investment waste and resources idle if the traffic demand is much less than the traffic capacity. Therefore, the toll station planning, design and operational management must be considered together with the traffic volume, especially analyze and predicate the traffic characteristics through existing toll data in order to avoid traffic "bottleneck" or resources waste. So the traffic capacity of highway toll station is a basic parameter for highway planning, construction and operation.
Definition and Function of Design Hourly Volume Coefficient
"Technical Standards of Highway Engineering"[1] takes Annual Average Daily Traffic (AADT) in long-term design period as the primary basis for determining highway technical level. This does not matter in two-lane highway with small amount of traffic, but it is necessary to consider whether the peak hourly volume would break through the design traffic capacity to cause congestion when the traffic volume increases to a certain extent. So the Design Hourly Volume (DHV) is an important parameter to determine the highway grade as well as evaluate the running status and service level, and the design hourly volume coefficient (K) is the basis to calculate DHV. K, the ratio between design hourly volume and AADT in long-term design period, is a critical parameter to estimate peak hourly volume and to determine the toll lane number.
Application Status of Design Hourly Volume Coefficient
published in the middle and late 1980s, presenting the design standard that uses the 30th hourly volume to determine the toll station volume as ranking the traffic volume during 8,760 hours through the year from high to low.
L.R. Sun [2] through calculation and analyses, processed the formula of design hourly volume coefficient, and then presented a simplified formula with sufficient precision and capacity of meeting requirements, which is not only easy for application and memory, but also able to create conditions for bringing formulas into standard specifications. N. Zuo [3] aiming at the congestion at toll stations in Hunan province, made an in-depth analysis of the reasons, and then proposed feasible program and conditions for lane reconstruction and expansion. His paper made an analysis on the congestion situation of toll stations, and proposed principles of balance between supply and demand as well as moderate advance. Y.P. Wang [4] made an analysis on dependent variable USRDHV which allows users to have 1.5% congestion time and use independent variables to reflect traffic volume and characteristics in the suggestion model, while USRDHV variation is explained through monthly, daily and Sunday traffic changes. J. Luo[5]using microscopic traffic simulation system TPSS, made an analysis on the influence of acceleration lane length on the service level at confluence area under different situations, based on which he proposed a reasonable acceleration lane length at the confluence area. X. Cheng [6] presented a detailed prediction of travel time from the perspective of the overall route planning, but did not mention the traffic capacity and delay factors of highway toll stations. Q.M. Zhang [7] starting from the longest high design period made a comprehensive analysis and prediction on planned highway volume by taking such multiple research methods as quantitative and qualitative, theoretical and practical, as well as reasoning and calculation.
Traditional Algorithm of K-value
The traffic volume formulated for planned roads (mainly urban roads and heavy-traffic roads) and design indexes of traffic facilities, is generally calculated by using the expected 30th hourly volume in the final design year. In early years of Japan, the ratio between this traffic volume and AADT was relatively stable, and the traffic volume decreased significantly from the 1th to the 30th or so hour, with large slope of curve, while the decrease slowed down after the 30th hour, displayed as flat curve. So it takes the 30th hourly volume as the highway design hourly volume, which, with lower congestion, can almost meet all the traffic requirements except for the first 29 hours.
According to "Technical Requirements for Highway Network Toll"[8] of Ministry of Transport, the traffic volume is calculated by DHV, generally using the 30th hourly volume. The AADT is calculated by formula (1):
DHV=AADT×K×D (1)
In the formula, K-value ranges from 0.085 to 0.15, with the standard value of 0.12. D-value is unbalanced distributed coefficient in the traffic direction, ranging from 0.5 to 0.6, with the standard value of 0.6. K-value and D-value can be adjusted appropriately according to the local traffic data or the predicting traffic results in the report.
In the toll-by-weight station, AADT is adjusted by formula (2):
AADT=AADT'×(1+0.8R) (2)
In the formula, AADT' is the original predicting volume in characterized years (passenger car unit); R is the share of large and medium truck (including container cars).
unbalanced direction coefficient will not change a lot either taking passenger cars or absolute terms as the traffic unit.
Improved Algorithm of K-Value
Algorithm 1 for K-Value
L.R. Sun [2] through extensive data collection and analyses, presented the K-value formula associated with correction factor of regional climate:
K=17.86(1+A)X-0.082+△ (3)
In the above formula: A is the correction factor of regional climate, whose absolute value should not be greater than 0.10. In the road section where the climate changes greatly in a year, the correction factor of regional climate should be larger; instead, the correction factor should be smaller in the section where climate changes mildly. The average correction factor of regional climate is shown in table 1; X is the order of design hour, which is more suitable for 30. It can be selected in the range of 20 to 40 when there are sufficient bases; △ is the corrected value of AADT in long-term design period (%).
The corrected value of AADT in long-term design period is calculated as:
△=0.46-0.000206×AADT (4)
Algorithm 2 for K-Value
Through investigation on Alberta provincial highway system, Shorma[3] reexamined the design hourly volume, which took user requirements into account. That paper has considered users or drivers' volatility or the user's viewpoints during the analysis of classifying various roads, the type of which is dependent on time variable and road using characteristics, such as trip purpose, trip distance and distribution. It is similar to the traditional method of selecting the 30th peak hourly volume as the design hourly volume, while the recommended approach is based on the distribution of hourly traffic volume in a year. However, the main factor is probability for the method of determining the design hourly volume (USRDHV Model), that is the probability of a certain user experiencing a peak hourly volume over n-th(when n=30,K=P(CON)30). This probability can be expressed by the formula:
P(CON)30=100/365×(AADT)×
∑
=
n
i
Vi
1 (5)
In the above formula, P is the probability percentage of a user who will experience a peak hourly volume over n-th, that is the ratio of users who may encounter congestion under the design hourly volume; V is the i-th peak hourly volume. Meanwhile, the probability calculated by using formula (1) can also be regarded as the probability of "user congestion".
Algorithm 3 for K-value (Improved)
The above two algorithms both calculated the K-value by taking the 30th hour, among which, algorithm 1 with rough calculation mainly depended on the provincial location to make division, unable to reflect the traffic structural features; algorithm 2 made calculation on the basis of traffic congestion probability, but difficult to estimate model parameters. In addition, the 30th hour was obtained on the basis of statistical analysis of Japanese highway data in earlier years, without removing the factor that there are too many passenger cars with toll free on legal holidays in our country, leading to over traffic volume on account of this calculation. And this is also greatly deviated from the actual situation in various provinces, particularly the toll stations after implementing weight charges and overload management.
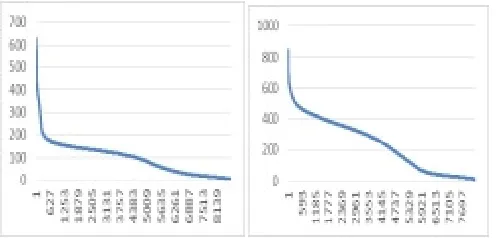
principle, integrating this design concept and combining actual traffic flow characteristics, made an analysis on the toll station volume in 8760 hours through the year(removal of national legal free days for small passenger cars), then improved the algorithm and put forward the following improved algorithm. That is, take the hour number at the significant turning point of the distribution curve about toll station hourly traffic distribution through the year as the calculated point of K-value, then take the ratio between the hourly volume corresponding to the flat point of hourly traffic curve (i.e., the first derivative of hourly traffic curve) and AADT as the design hourly volume coefficient, calculated as follows
K=DHV(F'(m)=1)/AADT (6)
[image:4.612.184.432.576.695.2]In the formula, F ( i ) is the hourly traffic curve, 1<i<8760, m is recommended to locate at 60<i<100.
Figure 1. Setting Principle of Design Hourly Volume.
Making use of this method, this paper selected 15 typical stations to make an analysis from various toll stations in Shaanxi highways (Provincial boundaries station, municipal station, county station, and city-ring station), then ranked the annual hours data and took the turning point to calculate K-value after plotting. Due to special distribution of passenger cars with toll free during holidays, it is necessary to remove the traffic data in free holidays. The analysis results showed that the number of hours at the turning points of each station is substantially in the range from the 60th-100th, and then the following results were obtained based on the above method (the horizontal axis represents the number of hourly traffic volume in descending orders, and the vertical axis represents the hourly traffic volume). So it is possible to select the 60th-100th hourly traffic volume to determine K-value, generally recommending to make calculation with the 60th hour. For the reconstructed and expanded toll stations with complete historical data, the K-value shall be determined after analyzing historical data, while the K-value can be determined by referring to the setting principle in new stations for those with incomplete data or without historical data. According to the results of table 1, the standard K-value is usually 0.09, and the K-value of toll stations around the city takes 0.07-0.09; the K-value of ordinary toll stations takes 0.10-0.12.
Huaxian Baoji
H
o
u
rl
y
t
ra
ff
ic
v
o
lu
m
e
1000
800
600 400
200
010 50 100 150 200 250 _ _ _ 8760
Fuping Xiangwang
Figure 2. Data Analysis Diagram of 4 Typical Toll Stations.
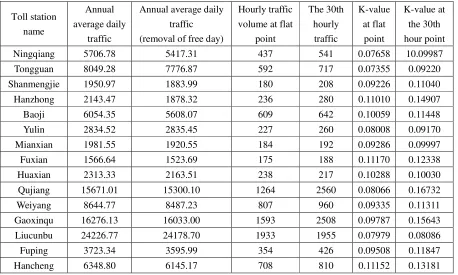
Through the above methods, this paper made data analysis on the selected toll stations and then obtained results in the following table.
Table 1. Data of Typical Toll Stations.
Toll station
name
Annual
average daily
traffic
Annual average daily
traffic
(removal of free day)
Hourly traffic
volume at flat
point
The 30th
hourly
traffic
K-value
at flat
point
K-value at
the 30th
hour point
Ningqiang 5706.78 5417.31 437 541 0.07658 10.09987
Tongguan 8049.28 7776.87 592 717 0.07355 0.09220
Shanmengjie 1950.97 1883.99 180 208 0.09226 0.11040
Hanzhong 2143.47 1878.32 236 280 0.11010 0.14907
Baoji 6054.35 5608.07 609 642 0.10059 0.11448
Yulin 2834.52 2835.45 227 260 0.08008 0.09170
Mianxian 1981.55 1920.55 184 192 0.09286 0.09997
Fuxian 1566.64 1523.69 175 188 0.11170 0.12338
Huaxian 2313.33 2163.51 238 217 0.10288 0.10030
Qujiang 15671.01 15300.10 1264 2560 0.08066 0.16732
Weiyang 8644.77 8487.23 807 960 0.09335 0.11311
Gaoxinqu 16276.13 16033.00 1593 2508 0.09787 0.15643
Liucunbu 24226.77 24178.70 1933 1955 0.07979 0.08086
Fuping 3723.34 3595.99 354 426 0.09508 0.11847
Hancheng 6348.80 6145.17 708 810 0.11152 0.13181
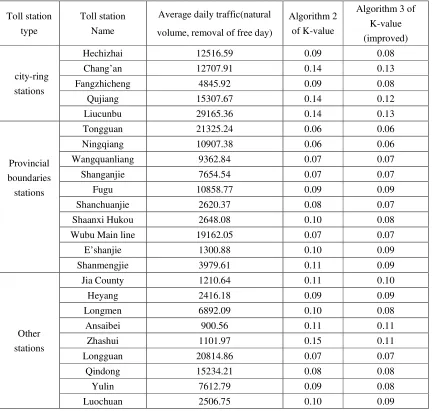
Comparative Analysis
The user congestion probability in this validation is 5%, that is, the probability of a user encountering congestion is 5%. Take the hourly traffic volume of the probability, and determine K-value. Then K-value is defined as the ratio between the hourly traffic volume at the flat point and the annual average daily traffic. Finally get the following results.
[image:5.612.79.537.295.570.2]Table 2. Comparison of K-value Calculation Results.
Toll station
type
Toll station
Name
Average daily traffic(natural
volume, removal of free day)
Algorithm 2
of K-value
Algorithm 3 of
K-value
(improved)
city-ring
stations
Hechizhai 12516.59 0.09 0.08
Chang’an 12707.91 0.14 0.13
Fangzhicheng 4845.92 0.09 0.08
Qujiang 15307.67 0.14 0.12
Liucunbu 29165.36 0.14 0.13
Provincial
boundaries
stations
Tongguan 21325.24 0.06 0.06
Ningqiang 10907.38 0.06 0.06
Wangquanliang 9362.84 0.07 0.07
Shanganjie 7654.54 0.07 0.07
Fugu 10858.77 0.09 0.09
Shanchuanjie 2620.37 0.08 0.07
Shaanxi Hukou 2648.08 0.10 0.08
Wubu Main line 19162.05 0.07 0.07
E’shanjie 1300.88 0.10 0.09
Shanmengjie 3979.61 0.11 0.09
Other
stations
Jia County 1210.64 0.11 0.10
Heyang 2416.18 0.09 0.09
Longmen 6892.09 0.10 0.08
Ansaibei 900.56 0.11 0.11
Zhashui 1101.97 0.15 0.11
Longguan 20814.86 0.07 0.07
Qindong 15234.21 0.08 0.08
Yulin 7612.79 0.09 0.08
Luochuan 2506.75 0.10 0.09
Conclusions
References
[1] M. Huo, C.F Li, R.G Zhou, etc, Technical Standards of Highway Engineering, JTG B01-2014, [S], Beijing: China Communications Press, 5, 2014.
[2]L.R. Sun, Calculation Formula Simplification of Design Hourly Volume[J]. Highway, 9, 14-15, 1991.
[3] N. Zuo, J.P. Wang, X. Zhang, etc, Simple Analysis on the Lang Reconstruction and Expansion Program of Highway Toll Station [J]. Hunan Communication Science, 38, 2, 36-39, 2012.
[4]Y.P. Wang, USRDHV Model Development of Design Hourly Volume (2)[J]. Highway 1, 12, 29-31, 1991.
[5] J. Luo, Y.L. Tanand, Y. Han, Research on the Methods of Setting Acceleration Lane Length for Expressway Confluence Area[J]. Computer Engineering and Applications, 51, 9, 248-251, 2015.
[6] X. Cheng, X.M. Zhao , etc, Prediction of the shortest travel time based on intersection delay. 2015 IEEE First International Smart Cities Conference (ISC2) ,10,1-7,2015.
[7] Q.M. Zhang, B.J. Liu , Y.L. Xie, etc, Research on Predictive Analysis of Highway Traffic Volume in Various Ways [J]. Highway Communication Technology: Applications and Technology, 6,289-292, 2016.