2017 3rd International Conference on Electronic Information Technology and Intellectualization (ICEITI 2017) ISBN: 978-1-60595-512-4
A Classification Method for Inland Navigable
and Substandard Waterways
Fan Yu, LinWei Dai, Shuai Liang and Pengjun Zheng
ABSTRACT
Classification of inland navigable and substandard waterways is essential for optimal allocation of safety administration resources. It is stipulated in “Regulations on the Administration of Water Traffic Safety in Zhejiang Province” that Maritime Safety Administration (MSA) should be responsible for the Navigable waterways using professional resources whilst Local Transportation Authorities should be responsible for the safety management of the Substandard waterway. It is therefore important to classify waterways into navigable and substandard areas in order to apply for different safety administration measures. At present, the division of inland navigable and substandard waterways is not clear, and there are no systematic methods for the classification of waterways. This paper investigated the present conditions of the inland waterways in Ningbo, and a classification method is proposed which can classify waterways into navigable and substandard areas based on C2R model of data envelopment analysis (DEA). A case study was also carried out using the proposed method and the results were compared with those obtained using fuzzy comprehensive evaluation (FCE) method. It is found that unlike the FCE, the proposed method does not need to determine the exactly weights of the indicators which influence the classification of inland waterways and does not need to determine the membership function of the indicators, thus the results are more objective and reliable.
_______________________
Fan Yu, Pengjun Zheng, Faculty of Maritime and Transportation, Ningbo University, Ningbo, China.
INTRODUCTION
According to “Regulations on the Administration of Water Traffic Safety in Zhejiang Province”, “inland navigable waterways” refer to the rivers, lakes, reservoirs, canals and other waters which have channels above quasi 7 grade and are available for navigation of ships. “Inland substandard waterways” refer to the waters except the inland navigable waterways, including the rivers, lakes, reservoirs, scenic areas, nature reserves, and the waters within the city landscape, which do not have channels. The regulations state that Maritime Safety Administration (MSA) is responsible for the supervision of the water traffic safety in the navigable waterways and Local Transportation Authorities are responsible for the supervision of the water activities in the substandard waterways. In order to clarify the duty of departments and implement the responsibility for supervision and ensure the safety of navigation, the classification of inland waterways is very necessary.
At present, studies of the inland navigable and substandard waterways’ classification are in their infancy, the systematic method has not been formed. Some developed countries only have conducted research on the classification of inland channels’ grades. For example, the United States divides their channels into 5 grades based on the depth of water [1]. Western Europe divides the inland channels into 6 levels based on the tonnage of ship [2]. All above are not involved in the classification of inland navigable waterways, but the channel grade is one of the important factors that affects the inland waterways attributes. In China, a few scholars have carried out the related studies, such as Huiying Zhao [1], who has studied for the classification method of inland waterways in Jiangsu province and proposed the model based on fuzzy comprehensive evaluation (FCE) method. Lin Xi [3] made a systematic discussion about the present situation and the problems of Nantong coastal navigable waterways classification, and put forward some suggestions about it. Hedi Li [4] proposed that the inland navigable waterways were the areas which were equipped with the navigation aids according to the national standard. And the Chinese inland waterways are divided into 7 classes according to the inland ships’ tonnage in the “inland river navigation standard” [5]. However, in the above-mentioned research, most scholars proposed the classification suggestions according to their personal experiences, which do not have the theoretical basis. So it is difficult to apply them to classify the inland waterways in most areas. The only mathematical method proposed by Huiying Zhao was based on FCE, which should calculate the weights of the indicators in advance according to the expertise and determine the membership functions of them. So the classification results would be influenced by the human subjective factors.
by data envelopment analysis (DEA). DEA does not need to anticipate any weight of the indicators or determine the production function relationship between the inputs and outputs, thus it can eliminate the influence of subjective factors on the results to a large extent [6]. Therefore, we choose this approach to classify the inland waterways in this paper.
METHODOLOGY
DEA is a non-parametric method that was originally used to evaluate the relative efficiency of a homogeneous group of decision making units (DMUs) [7]. In this paper, the evaluated inland waterways are the DMUs. The fundamental of DEA application is to keep the output or input indicators of the waterways unchanged and use the mathematical programming method to determine the relative effective production frontier which is formed by the best practices waterways, then project each waterway to the efficient frontier and measures the efficiency scores of them according to their distances to the frontier [8]. When the waterway falls on the efficient frontier, it is called DEA-efficient, and its relative efficiency score is 1, which means there is no way, through the change of its indicators, to achieve at greater navigation status. When the waterway falls inside the efficient frontier, it is called DEA-inefficient, and its relative efficiency score is between 0 and 1, which means its navigation status can be improved by changing the indicators.
In DEA, it has many significant models. Compared with these models, the classic C2R model is easier to apply, because it has a simple structure, fewer constrains and a linear solving process [9-10]. It utilizes the ratios of the weighted sum of outputs to the weighted sum of inputs to evaluate the comprehensive efficiency of DMUs[11], which means it can comprehensively reflect the navigable conditions of the inland waterways. Therefore, the C2R model is sufficient to meet the evaluation requirements of inland waterways in this study.
THE CLASSIFICATION METHOD
Classification Indicators
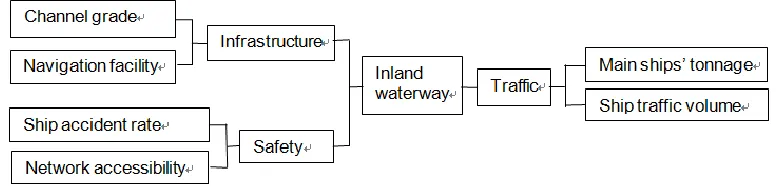
the important indicators for the inland waterways classification. Whilst the navigation facilities which include the navigational aids and the traffic service to ensure the safety of navigation also have a significant influence. Secondly, the ship accident rate directly reflects the safety of the inland waterway, while the Network accessibility which embodies the convenience of river water traffic indirectly reflects it, so they are selected to describe this factor. Totally, these four indicators are specified reflecting the waterways’ construction and maintenance cost, so they are set as the input indicators, which are shown as the left part of Figure 1. On the other hand, as the outcome of the waterways traffic transportation, the main ships’ tonnage and the ship traffic volume are considered as the output indicators, which are shown as the right part of Figure 1.
Figure 1. The hierarchical framework of classification indicators.
In the above structure, the four input indicators are the qualitative ones. Before using the C2R model to calculate the efficiency of the inland waterways, they are required to be quantified. Since DEA has little requirement for the input and output data and is not affected by the data dimension. Therefore, in the quantization process, it is only necessary to consider the rationality of the data and the sensitivity of their impact on the results.
In this paper, we divide all the channels into 8 levels. Because the higher the channel grade, the more the cost of waterways’ construction and maintenance, we set 10 as the minimum base and the upper grade is twice the next grade. In addition, Navigation facility, ship accident rate and network accessibility are all divided into 3 classes. We also set 10 as the minimum base and the upper class is four times the next class. In this way, the sensitivity of these indicators’ impact on the results is relative high, and the specific quantization values are shown in Table I and Table II.
TABLE I. CHANNEL GRADE INDICATOR.
Channel grade Ⅰ Ⅱ Ⅲ Ⅳ Ⅴ Ⅵ Ⅶ Ⅷ
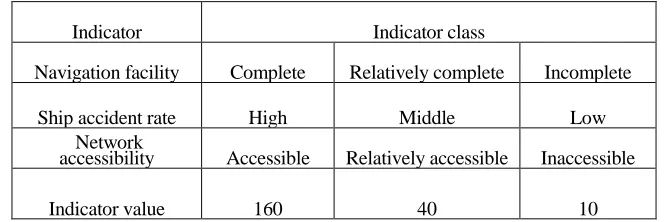
[image:4.612.136.461.621.672.2]TABLE II. NAVIGATION FACILITIES, SHIP ACCIDENT RATES AND NETWORK ACCESSIBILITY INDICATORS.
Indicator Indicator class
Navigation facility Complete Relatively complete Incomplete
Ship accident rate High Middle Low
Network
accessibility Accessible Relatively accessible Inaccessible
Indicator value 160 40 10
Classification Model
Assume that there is a set of n inland waterways in a region to be evaluated,
each inland waterway with m inputs and soutputs. The input and output indicator values of the j
j1,...,n
th inland waterway are denoted by xij
i1,...,m
and
r s
yrj 1,..., , respectively; vi and ur are the weights assigned to the inputs and
outputs.
Let
Ts T m T sj j j j T mj j j
j x x x y y y y v v v v u u u u
x 1, 2 ,..., , 1, 2 ,..., , 1, 2,..., , 1, 2,..., , then
its efficiency can be measured by the following model [12-13]:
n j h x v y u x v y u h j j T j T m i ij i s r rj r
j , 1, 1,2,...,
1
1
(1)
where hj is the relative efficiency of the jth inland waterway. This equation
indicates that it is the ratio of the outputs to the inputs, which constitutes the fractional programming problems as follows:
, , . . . , 1 , , . . . , 1 , 0 , 0 , ,..., 1 , 1 . . , max m i s r v u n j x v y u t s x v y u h i r j T j T o T o T o (2)
where
xo,yo
xjo,yjo
, DMU0 represents the waterway under evaluation. Usingprogramming model can be solved through the following linear programming model: , ,..., 1 , , . . . , 1 , , . . . , 1 , 0 , , . . , min 1 1 n j s r m i y y x x t s j n j ro j rj n j io o j ij o
(3)Where o represents the relative efficiency of the joth inland waterway. After
introducing the slack variable si, the residual variable sr and non-Archimedean into the above model, it can be transformed into the following form:
, , . . . , 2 , 1 , 0 , . . . , 2 , 1 , 0 , , . . . , 2 , 1 , 0 , , . . , ˆ min 1 0 1 0 s r s m i s n j y s y x s x t s s e s e r i j n j r r j rj n j i o i j ij r T i T o
, (4)where si represents a reduced investment compared to the optimal solution,
r s
represents an increased output compared to the optimal solution,
mT
E
eˆ 1 1 ... 1 ,
sT
E
e 1 1 ... 1 and is a number less than any positive number and greater than 0.
In the model, the value of o is the main basis for classifying the inland
navigable and substandard waterways. If o 1 and si 0,sr 0, then the joth inland waterway is called DEA-efficient, which indicates that this inland waterway is squarely on the efficient production frontier and its relatively navigable efficiency is highest in the all evaluated waters, so it will be directly divided into navigable ones; If o 1, then the joth inland waterway is DEA-inefficient, which shows that
principle to divide this kind waterways[14]. That is, arrange their values of o in order from large to small, then divide the former 20% of them into navigable waterways and the remaining 80% of them into substandard waterways.
CASE STUDY
Available Data
In this paper, 11 inland waterways, 5 lakes and 2 reservoirs were selected from Ningbo, China, as the experimental sample. The relative indicator values were obtained from Ningbo Maritime Safety Administration or the local Maritime Safety Authorities. The missing data were obtained by field observations. And the qualitative indicators were quantified as specified in above section. Then in order to verify the validity of the method proposed in this paper, we decided to compare the classification results with the results based on fuzzy comprehensive evaluation (FCE) [15].
Results
On the basis of knowing the values of each indicator, the classification model
was applied to calculate the relative efficiencies o of these inland waterways by
DEAP2.1, then classified the waterways according to their values of o. Among
them, the values of o for Yongjiang River, Dongjiang River, Yinjiang River,
Dongqian Lake and Baixi Reservoir are 1, and 0, 0
r
i s
s
, so these 5 waterways
are directly divided into navigable ones. While the values of ofor other waterways
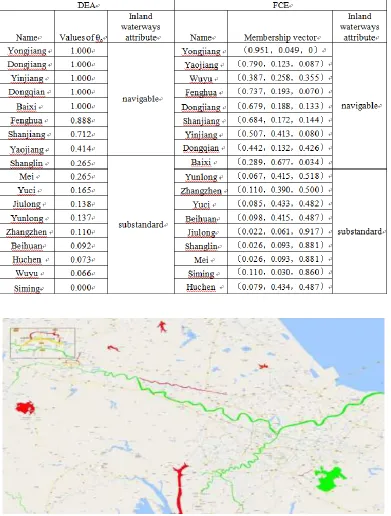
TABLE III. COMPARISON OF THE CLASSIFICATION RESULTS.
Figure 2. Distribution of the classification areas.
substandard waterway. While in FCE, it was classified into the navigable waterway.
When focus on the calculation results, in DEA, the o of Wuyu river is 0.066 which
is far away from 0.5, so it absolutely belongs to the navigable waterway in this method. While in FCE, this river’s membership degree to the navigable waterway is 0.387 and the membership degree to the substandard waterway is 0.355, which are very close. Because this method needs to use analytic hierarchy process (AHP) to determine the weight of each indicator, the result is likely to change because of the human subjective factors. In addition, after the field investigation, it is found that part of Wuyu River has experienced heavy sedimentation and some bridges’ headroom is insufficient, which means the navigation condition is limited and there is a certain risk. From the actual condition, the river is also not suitable for navigation. Therefore, the classification of Wuyu river based on the proposed method is more reliable and objective. What’s more, the inland waterways’ classification scheme in Ningbo which based on the proposed method in this paper has been adopted by Ningbo Maritime Safety Administration.
DISCUSSION AND CONCLUSION
A new classification method for inland navigable and substandard waterways has been proposed. The waterway indicators for classification have been determined and the classification model based upon the C2R model of DEA has been proposed. The advantage of the new method is that the weights of the indicators and the production function relationship between the inputs and outputs do not need to be determined in advance, thus simplifying the classification calculation steps and largely eliminating the impact of human subjective factors.
The application of the proposed method indicated that DEA-based approach did outperform the traditional FCE approach. The results based on available data collected in Ningbo revealed that the classification scheme using the proposed method was more consistent with the actual situation. It should be noted that the method requires a higher accuracy of the data, so to ensure the authenticity and rationality of the data is the key to apply.
ACKNOWLEDGEMENTS
This paper is supported in part by National Natural Science Foundation of China (Grant No. 51408321) and Zhejiang Provincial Natural Science Foundation of China (Grant No. LY15E080013).
REFERENCES
1. Huiying Zhao. 2013. A Division Method Research of Inland Navigable and Substandard Waterways in Jiangsu Province. Nanjing University of Science and Technology, P22-56 (In Chinese).
2. Wangzheng Ai. 2006. A Research of the influence of Inland River Navigation Standard on Inland Waterway Transport. Wuhan University of Technology, P1-3 (In Chinese).
3. Lin Xi, Chun Liu. 2015. Yue Jiang. The Thinking about Nantong Coastal Navigable Waters’ Demarcation. Journal of Nantong Shipping College, 14(3), P19-26 (In Chinese).
4. Hedi Li. 2005. The Personal Thought about Inland Navigable Waters’ Demarcation. Excellent Papers on Maritime Management Academic Exchange Conference Held in 2005 (In Chinese). 5. GB50139-2014, Inland River Navigation Standard (In Chinese).
6. Kritikos M N. 2017. A Full Ranking Methodology in Data Envelopment Analysis Based on A Set of Dummy Decision Making Units. Expert Systems With Applications, 77, P211-225. 7. Aldamak A, Zolfaghari S. 2017. Review of Efficiency Ranking Methods in Data Envelopment
Analysis. Measurement, 106, P161-172.
8. Wei G, Wang J. 2017. A Comparative Study of Robust Efficiency Analysis and Data Envelopment Analysis with Imprecise Data, 81, P28-38.
9. Bastos J T, Shen Y, Hermans E, et al. 2015. Traffic Fatality Indicators in Brazil: State Diagnosis Based on Data Envelopment Analysis Research. Accident Analysis & Prevention, 81, P61-73. 10. Shen Y, Hermans E, Brijs T, et al. 2013. Data Envelopment Analysis for Composite Indicators: A
Multiple Layer Model. Social Indicators Research, 114(2), P739-756.
11. Torres-Jimenez M, Garcia-Alonso C, Salvador-Carulla L, et al. 2015. Evaluation of System Efficiency Using the Monte Carlo DEA: The Case of Small Health Areas. European Journal of Operational Research, 242, P525-535.
12. Shen Y, Hermans E, Brijs T, et al. 2012. Road Safety Risk Evaluation and Target Setting Using Data Envelopment Analysis and Its Extensions. Accident Analysis & Prevention, 48, P430-441. 13. Yang L, Wang Y, Lan Y, et al. 2017. A Data Envelopment Analysis (DEA)-Based Method for
Rule Reduction in Extended Belief-Rule-Based Systems. Knowledge-Based Systems, 123, P174-187.
14. Qunpu Zhang. 2012. DEA-based ABC Classification Management Model for Ocean-going Ship Spare Parts. China Water Transport, 12 (12), P67-69 (In Chinese).