SIMULATION AND STATIC MEASUREMENT OF THE GAS VOLUME
FRACTION IN A SEPARATED FLOW MODEL USING A CONDUCTANCE
MULTIPHASE VENTURI METER (CMVM)
Abbas H. A. M. Hasan1, G. P. Lucas1
1 University of Huddersfield, Queensgate, Huddersfield HD1 3DH, UK
ABSTRACT
The assumption of equal mixture densities at the inlet and the throat of the Venturi is only valid in a homogenous flow. This assumption is no longer valid for a separated flow and therefore, the measurement of the gas volume fraction at the throat must be introduced. This paper presents an advanced Conductance Multiphase Venturi Meter (CMVM) which is capable of measuring the gas volume fraction at the throat of the CMVM. In water continuous multiphase flow, the electrical conductance technique has proven attractive for many industrial applications. In gas-water two phase flow the electric conductance technique can be used to extract the gas volume fraction. We measure conductance using two ring electrodes flush with the inner surface of the Venturi throat. Different nylon rods with different diameters were inserted at the center of the throat to simulate the gas volume fraction at the throat. Experimental static tests for a vertical and a horizontal Venturi meter were performed in which the water film thickness and the gas volume fraction (i.e. the volume occupied by a non-conducting rod) were measured. In this paper, the experimental results were also compared with those obtained from COMSOL finite element software. It was inferred from this comparison that the error was less than 1.95 %.
Keywords Electrical conductivity, Venturi meter, Separated flow, finite element technique.
1. INTRODUCTION
Two phase or even three phase flows are commonly found in industrial fields and in ordinary life. In a multiphase flow, the relationship between the mass flow rate and the pressure drop across the Venturi meter is not simple and should include the flow quality or the phase holdups. In a homogenous flow model where the slip is zero, the mixture densities at the inlet and the throat can be assumed equal and substitution of the mixture density at the inlet of the Venturi into the Bernoulli equation would be reasonably expected to lead to accurate results.
Separated flow in a Venturi meter is highly complex and the application of a homogenous flow model could not reasonably be expected to lead to highly accurate results. In other words, the gas volume fraction at the inlet is not the same as that at the throat of the Venturi. If this is the case, a gas volume fraction measurement technique at the throat must also be introduced instead of just relying on the gas volume fraction measurement at the inlet of the Venturi.
Considerable theoretical and experimental studies have been published to describe separated flow models of Venturis in multiphase flow applications including the use of a Venturi in vertical and horizontal flow. The study of multiphase flow through contraction meters is described for example by; Murdock [1], Chisholm [2], Lin[3], Smith and Leang [4], de Leeuw [5], Steven [6], Wolf [7] and Fang et al. [8]. Abbas [9] reviewed some of these models.
This paper develops a new advanced design of a conductance multiphase Venturi meter (CMVM) which is capable of measuring the gas volume fraction at the throat of the Venturi. Although measurement of the water thickness for separated flow at the inlet and the throat is similar, this paper focuses only on the measurement and simulation of the gas volume fraction at the throat of the CMVM.
2. THEORETICAL WORK
2.1 Gas volume fraction at the throat of a horizontal CMVM in a stratified flow
In the stratified flow model the assumption of equal phase velocities is no longer valid. In other words, the slip ratio between the phases which represents the ratio of gas velocity to water velocity is not unity and each phase flows separately with its own velocity as shown in figure 1.
From figure 1, it is possible to write;
R
h
1cos
−=
θ
(1)where
R
is the radius of the pipe,θ
andh
are the angle and height respectively as shown in figure 1.The area occupied by the gas,
A
g in figure 1 can be written as;h
B
R
A
g=
θ
×
π
2−
×
360
2
(2)
The parameter
B
in equation (2) is given by;2 2
h
R
B
=
−
(3)The gas volume fraction,
α
gcan then be calculated from;2 2
2
.
1
360
2
R
h
R
h
R
A
A
gg
⎥⎦
π
⎤
⎢⎣
⎡
θ
×
π
−
−
=
=
α
(4)2.2 Gas volume fraction at the throat of a vertical CMVM in annular flow
To simulate the film thickness in a vertical annular flow through a Venturi, different rod diameters were inserted at the throat of the CMVM. From figure 2, the water film thickness,
δ
can be written as;2
rodD
D
−
=
δ
(5)where
D
rod is the rod diameter.It is well known that, the gas volume fraction is defined as the ratio of area occupied by the gas to the total flow area. Therefore the gas volume fraction at the throat of the CMVM,
α
2 is given by;2 2
2
1
⎟
⎠
⎞
⎜
⎝
⎛
−
δ
=
α
D
(6)The electronic circuit was built and calibrated to give 0V and 4V when the throat of the Venturi was filled completely by air and water respectively.
2.3 The conductance of the mixture between the electrodes
The conductance of the mixture,
G
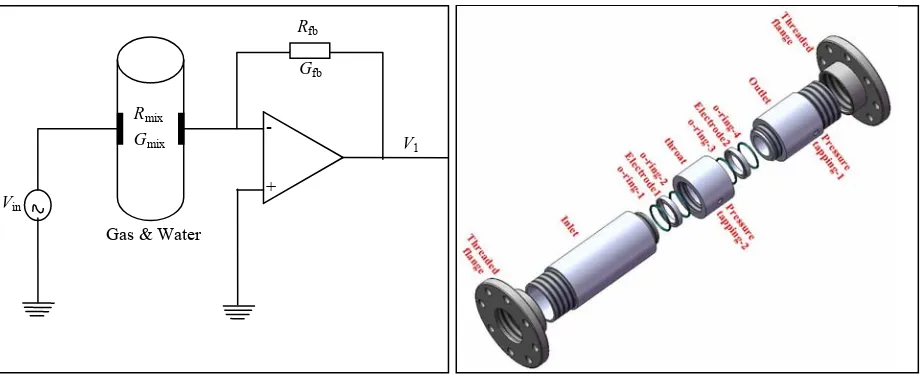
mix can be calculated using the circuit shown in figure 3. From figure 3,in mix
fb
out
V
R
R
V
=
−
(7)Since the conductance
G
is the reciprocal of the resistance, equation (7) can be re-written as;in fb mix
out
V
G
G
V
=
−
(8)Once the mixture conductance
G
mix is obtained, the resistance of the mixture,R
mix can be easily calculated.3. DESIGN OF THE CMVM AND FINITE ELEMENT MODELLING OF THE CMVM
3.1 The design of the conductance multiphase Venturi meter (CMVM)
Since for non-homogenous flow the gas volume fraction at the inlet, α1 differs from the gas volume fraction at the throat α2 (and also the mixture density at the inlet and the throat, ρm1 and ρm1 respectively), it is necessary to measure the gas volume fraction at the throat of the Venturi. To do so, a new Venturi with two ring electrodes at the throat was designed and manufactured as shown in figure 4.
The conductance multiphase Venturi meter (CMVM) shown in figure 3 consists of 11 sections as follows; two threaded flanges, four o-rings, two stainless steel electrodes, the inlet of the Venturi, the throat, and the outlet section. The ring electrodes are designed to be flush mounted to the inner surface of the test section (i.e. the throat of the Venturi) to avoid flow disturbances and to minimize the measuring error. One of the most advanced features of this design is that, all parts can be assembled/disassembled easily including the threaded flanges. The other advantage of this design is that it is very straightforward to change the throat section. It is also possible to replace the two ring electrodes with two wire electrodes in order to increase the sensitivity of the electrodes in horizontal flow. The conductance multiphase Venturi meter (CMVM) was designed by using the Solidworks package [10]. The full 2D drawing of the throat section is shown in figure 5.
3.2 The finite element modelling of the CMVM
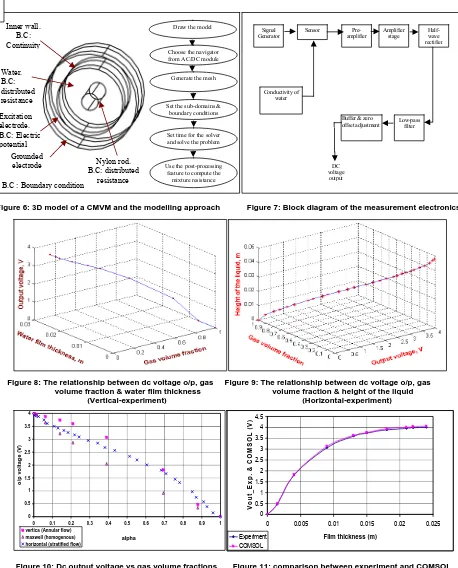
The aim of the finite element modelling of the CMVM was to define and understand the electric field around the ring electrodes when nylon rods with different diameters were inserted at the throat of the Venturi which had previously been filled with water (thus the effect of each nylon rod was to cause a ‘film’ of water to occur between the wall of the Venturi throat and the outer surface of the rod). This configuration is electrically similar to that which occurs in vertical upward annular flow. The finite element solver used in this paper was COMSOL (AC/DC module-conductive media). Two ring electrodes were modelled separated by a PVC pipe with the dimensions exactly the same as those for the conductive multiphase Venturi meter shown in figure 5. One of the electrodes was excited by 10 kHz while other electrode was set as ground. The modelling approach used can be summarized as shown in figure 6.
4. STATIC EXPERIMENTAL SETUP FOR THE CMVM
The complete block diagram of the measurement electronics system is shown in figure 7. It consists of five main stages; a pre-amplifier which is similar to figure 3, an amplifier stage, a half-wave rectifier, a low-pass filter and a buffer& zero offset adjustment. At the beginning of each experiment the zero offset stage was adjusted to give a zero output voltage when no water was present at the throat of the Venturi. The amplifier stage was then adjusted to give 4V when the throat (i.e. the area between the electrodes) was completely filled with water. The conductivity of water was about 0.0128 Sm-1 (128 μScm-1). For the vertical experiments (simulating annular flow), eight different diameters of nylon rods were inserted at the throat of the CMVM and the gap between the outer surface of the rod and the inner surface of the throat was filled with water which represented the water film in a real annular flow situation as shown in figure 2. The dc voltage output and the output voltage after the preamplifier stage for each rod diameter were recorded. The reason for recording the output voltage after the pre-amplifier stage (figure 3) is to compute the experimental mixture resistance and compare it with the COMSOL mixture resistance. Once the mixture resistance from COMSOL is obtained, it is possible to work backward to estimate the dc voltage output associated to the value of the COMSOL mixture resistance and then compare it to the dc output voltage obtained from experiment.
CMVM was Delrin, a clear Perspex blank flange with a ruler was used to measure the liquid height at the throat of the Venturi taking into consideration the difference between the inlet and the throat diameters.
5. RESULTS AND DISCUSSION
5.1 Results from static experimental test
Figure 8 shows the relationship between the voltage output (i.e. 0V-4V), the water film thickness and the gas volume fraction in a vertical annular flow test. Although this relationship was non-linear, it is still possible to represent this relationship using a polynomial fit curve. The variation of the dc voltage output, the height of the water and the gas volume fraction at the Venturi throat in a horizontal stratified flow is shown in figure 9. The relationships between the output voltages and the gas volume fractions at the throat of the CMVM for vertical annular and horizontal stratified tests can be represented graphically using equations (1) to (9) as shown in figure 10.
The Maxwell curve in figure 10 was plotted based on the fact that, when the throat of the CMVM is filled completely with water (i.e. =0) the mixture conductivity
σ
m must be equal to water conductivityσ
w. The Maxwell equation is given by; 2α
2
)
1
(
2
2 2
+
α
α
−
σ
=
σ
wm (9)
where
σ
mandσ
ware the conductivities of the mixture and water respectively andα
2is the gas volume fraction at the throat of the CMVM.5.2 Comparison between the results obtained from static test and COMSOL
The data obtained from the finite element solver (COMSOL) can not be directly compared with a dc voltage output obtained from the experimental results. The best way to compare the data obtained from COMSOL with experimental data is to find the mixture resistance from both COMSOL and the experiment. Once the COMSOL mixture resistance is obtained, it is possible to calculate a dc voltage output if the gain of the blocks between the pre-amplifier stage and the last stage in figure 7 is known. Since the gain k is not constant, the value of k was calculated experimentally for each condition.
Figure 11 shows the difference between the experimental results and the results obtained from COMSOL for annular vertical test. The error in a dc voltage output for experimental and COMSOL data is shown in figure 12. It is clear that the error was less than 1.95 %.
6. CONCLUSIONS
The advance Conductance Multiphase Venturi Meter (CMVM) was designed and tested vertically and
horizontally for different simulating conditions. One of the main features of the CMVM is that each part of it can be assembled/disassembled easily. A conductance measurement circuit was built to measure the gas volume fraction at the throat of the Venturi. The same geometry of the Venturi throat was modeled and simulated using the COMSOL solver to compute the mixture resistance by integrating the current flow over the area of the virtual earth electrode. The results obtained from COMSOL were compared with the experimental results. It was inferred from this comparison that the error was less than 1.95%.
REFERENCES
[1] Murdock, J.W. (1962) “Two-phase flow measurements with orifices”. J. of Basic Eng. Vol. 84, page 419-433.
[2] Chisholm, D. (1977) “Research note: Two-phase flow through sharp-edged orifices”. J. of Mech. Eng. Sci. Vol. 19, No.3.
[3] Lin, Z. (2003) “Two-phase Flow and Boiling Heat Transfer”. Xi’an Jiaotong University Press, China. [4] Smith, R.V. and Leang, J.T. (1975) “Evaluations of correction for two-phase flowmeter three
current-one new”. ASME ser. A. 97, page 589-593.
[6] Steven, R.N. (2002) “Wet gas metering with a horizontally mounted venturi meter”. J. of Flow Measurement and Inst. Vol. 12, page 361-372.
[7] Wolf, A. (1995) “Film structure of vertical annular flow”. PhD thesis. Imperial college, London. [8] Frang Lide, Zhang Tao and Jin Ningde (2006) “A comparison of correlations used for venturi wet
gas metering in oil and gas industry”. J. of Petroleum science & engineering, Petrol-01496.
[9] Abbas H. A. M. Hasan (2005) “An investigation of homogenous and non-homogenous two phase
flow model by means of Venturi meter”. MSc thesis, University of Huddersfield. [10] http://www.solidworks.com
Figure 1: Stratified flow Figure 2: Annular flow
[image:5.595.69.529.364.554.2]
Figure 3: Fluid conductance circuit Figure 4: The design of the CMVM
Figure 5: 2D drawing of the CMVM
Gas & Water
-+
Rfb
Gfb
Rmix Gmix
Vin
V1
Ag
Aw
Hw
GAS
WATER h
R B
D Drod
Aw
Water film
Ag δ
Nylon rod
[image:5.595.98.526.590.730.2]School of Computing and Engineering Researchers’ Conference, University of Huddersfield, Nov. 2008
Figure 6: 3D model of a CMVM and the modelling approach Figure 7: Block diagram of the measurement electronics
Figure 8: The relationship between dc voltage o/p, gas Figure 9: The relationship between dc voltage o/p, gas volume fraction & water film thickness volume fraction & height of the liquid (Vertical-experiment) (Horizontal-experiment)
Figure 10: Dc output voltage vs gas volume fractions Figure 11: comparison between experiment and COMSOL (vertical annular flow)
Figure 12: The error between COMSOL and experimental data Inner wall. B.C: Continuity Nylon rod. B.C: distributed resistance Excitation electrode. B.C: Electric potential Grounded electrode Water. B.C: distributed resistance
Generate the mesh
Set the sub-domains & boundary conditions
Set time for the solver and solve the problem
Use the post-processing feature to compute the
mixture resistance Choose the navigator from AC/DC module
Draw the model Signal
Generator Pre-amplifier Amplifier stage Half-wave rectifie Sensor
B.C : Boundary condition
r
Conductivity of water
Buffer & zero
offset adjustment Low-pass filter
DC voltage output 0 0.5 1 1.5 2 2.5 3 3.5 4 4.5
0 0.005 0.01 0.015 0.02
Film thickness (m)
V out _E xp. & C O M S O L ( V ) 0.025 Experiment COMSOL 0 0.5 1 1.5 2 2.5 3 3.5 4
0 0.1 0.2 0.3 0.4 0.5 0.6 0.7 0.8 0.9 1
alpha o /p vo lt ag e ( V )
vertica (Annular flow) maxwell (homogenous) horizontal (stratified flow)
-2.5 -2 -1.5 -1 -0.5 0 0.5 1 1.5 2 2.5
0 0.2 0.4 0.6 0.8 1 1.2
Gas volume fraction at the throat
[image:6.595.68.526.50.618.2]