University of Huddersfield Repository
Van Gulijk, Coen, Hughes, Peter, FigueresEsteban, Miguel, Dacre, Marcus and Harrison, Chris
Big Data Risk Analysis for Rail Safety?
Original Citation
Van Gulijk, Coen, Hughes, Peter, FigueresEsteban, Miguel, Dacre, Marcus and Harrison, Chris (2015) Big Data Risk Analysis for Rail Safety? In: Safety and Reliability of Complex Engineered Systems: ESREL 2015. CRC/Balkema. ISBN 9781138028791
This version is available at http://eprints.hud.ac.uk/id/eprint/25024/
The University Repository is a digital collection of the research output of the University, available on Open Access. Copyright and Moral Rights for the items on this site are retained by the individual author and/or other copyright owners. Users may access full items free of charge; copies of full text items generally can be reproduced, displayed or performed and given to third parties in any format or medium for personal research or study, educational or notforprofit purposes without prior permission or charge, provided:
• The authors, title and full bibliographic details is credited in any copy; • A hyperlink and/or URL is included for the original metadata page; and • The content is not changed in any way.
For more information, including our policy and submission procedure, please contact the Repository Team at: [email protected].
1 DATA-REVOLUTION IN GB RAIL
1.1 Big data and safety management in railways
Computer scientists are quite clear in their belief that the data-revolution is coming of age. They have a firm belief that the enormous amounts of data float-ing around in the internet will unchain a manage-ment revolution of uncanny proportions (Chen et al. 2012, McAfee & Brynjolffson, 2012; Watson & Marjanovic, 2013). Yet, to date, the potential benefit of this revolution is scantily investigated for safety and risk management.
Big data is the label for methods and techniques that take advantage of the large amounts of data on the internet however, authors disagree on the exact definition (Davenport 2014, Mayer-Schönberger & Cukier, 2013). The broad interpretation is that big data deals with huge volumes of a variety of data-sources very quickly (volume, variety & velocity). In a narrower interpretation it is the next step in the de-velopment of decision support tools. In practice big data describes cloud-computing software tools that combine structured and unstructured data sources to support (commercial) management decisions.
In railway engineering some work was published about cloud computing and machine learning (Tan & Ai 2011; Li 2014; Thomas 2014). A particular area of interest is the acquisition of data with RFID sys-tems (Yan & Yu 2009; Zhang & Tentzeris 2011; Makalar & Roy 2014; Kour et al. 2014). Although these works contain some references to safe
opera-tion, the do not deal with safety- or risk manage-ment.
This work investigates whether and how rail safe-ty and risk management could benefit from a new generation of software tools that computer scientists develop today. This paper contributes to that aim by considering the initial experience gained in the BDRA research programme at the University of Huddersfield.
1.2 Data strategy for the GB railways
The choice for investigating whether the data-revolution could benefit safety and risk for the rail-ways in the UK is not a coincidence. The increased dependency on data is addressed in The Rail Tech-nical Strategy Report 2012 (TSLG, 2012). The re-port presents a vision for the GB railways for the next decade. The vision is based on the fact that the number of passengers on trains will continue to grow in the UK. With this growing demand, the railways have to ensure customer satisfaction and value for money by being safe, reliable, resilient, meeting ca-pacity and being service oriented. Six innovation themes were defined to support these objectives: control, command and communication; energy; in-frastructure; rolling stock; information and customer experience. These themes heavily depend on data. In support of these efforts Network Rail and ATOC have made relevant data-feeds available through the internet.
Big Data Risk Analysis for Rail Safety?
C. van Gulijk, Peter Hughes & M. Figueres-Esteban
Institute of Railway Research, University of Huddersfield, Huddersfield, United Kingdom.
M. Dacre & C. Harrison
RSSB, London, United Kingdom.
ABSTRACT: Computer scientists believe that the enormous amounts of data in the internet will unchain a management revolution of uncanny proportions. Yet, to date, the potential benefit of this revolution is scantily investigated for safety and risk management. This paper gives a brief overview of a research programme that investigates how the new internet-driven data-revolution could benefit safety and risk management for railway safety in the UK. The paper gives a brief overview the current activities in this programme and infers whether big-data techniques provide a sensible addition to the safety and risk sciences. The overview shows that there is added value for introducing these techniques in the safety and risk domain but serious challenges need to be addressed.
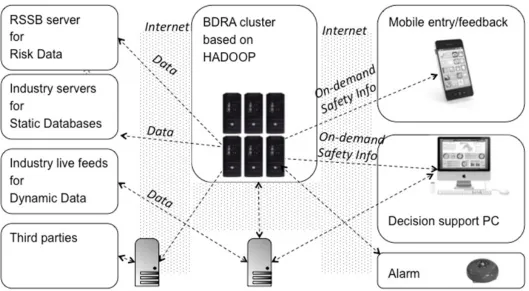
Figure 1. Technical system for BDRA.
1.3 RSSB
RSSB is GB’s foremost rail risk analyst. It maintains the Safety Risk Model (SRM) and ensures that the data quality is maintained in the national incident da-tabase SMIS. About two years ago, an additional in-cident database was introduced that enables railway personnel to report so called ‘Close Calls’. RSSB has identified that maintenance and analysis of these databases and risk models is a meticulous task that could benefit from the modern big-data data-analytics techniques (Bearfield et al. 2013). This work is connected to these efforts in the sense that it supports RSSB in their efforts to introduce data-analytics into the SRM model and provides horizon scanning for future opportunities of data-analytics for rail safety and risk in the UK.
1.4 Current projects
This paper is written at a time that the Big Data Risk Analysis project is starting up at the University of Huddersfield. The research project is a joint effort by RSSB and the Institute of Railway Research at the University of Huddersfield. The objective is to in-vestigate to what extent big data techniques can sup-port the current risk model of RSSB and to investi-gate whether the modern data-analytics methods will change traditional risk analysis methods, and if so, how. Therefore, this paper presents an overview of the activities rather than detailed scientific analysis; these are reported in other papers in this confer
ence and elsewhere (Hughes & Figueres 2015, Hughes et al. in prep., Figueres et al. in prep.). This overview helps understand whether the big data ap-proach is sensible for safety and risk sciences and how safety and risk management could benefit from it. This paper treats the design of a technical system for BDRA applications, a description of two projects with some of their results, a brief consideration about software design for integrated BDRA applica-tions and a conclusion.
2 TECHNICAL SYSTEM FOR BDRA
There are three major components in the technical system for BDRA. They are a Hadoop computer cluster, industry servers containing databases, inter-face devices and the Internet. Figure 1 depicts the system.
2.1 Data in the GB railways
this information is stored on servers that contain da-tabases, information about technical systems, safety management systems, documents and laws. These servers are owned by individual organizations but sharing some of that data could benefit BDRA appli-cations. Network Rail and ATOC are currently providing access to live data-streams that feed live data about trains and tracks: BPLAN, Corpus, Movement, RTPPM, Schedule, SMART, TD, TSR, VSTP, Fares Data, Timetable Data and Routing Data (NR 2015, ATOC 2015). All these feeds carry safe-ty-relevant data.
RSSB plays an important role in the sharing of safety-relevant information. Especially the SRM and the information gathered through the SMIS da-tabase and the Close Call dada-tabase provide key building blocks for BDRA. The current interpreta-tion and analysis of these databases is based on well-known analysis techniques where incident databases feed fault-tree models (Dacre 2014).
Not all safety-relevant information is found on railway servers. The weather forecast or football matches would not typically be stored on railway servers but could be relevant for BDRA for GB rail. Since industry partners displayed a particular interest in these data-sources, they will be investigated in the near future.
2.2 Central processing cluster
Hadoop is the name of free software that combines the computing power of several commodity comput-ers into a single processing cluster (White, 2012). Hadoop distributes data and algorithms over a num-ber of commodity computers and collects the results after they have been processed. The software is ro-bust in the sense that built-in redundancies protect against the loss of data by the failure of individual computers in the cluster. The use of commodity computers makes computer power cheap in the sense that the hardware can be bought from any computer supplier and even second-hand computers could be used. Though the maintenance of such a computer system requires the support from the ICT depart-ment, significant computer power is in reach for all but the smallest organizations in the GB railway in-dustry. In addition to that, Hadoop is extensively used by Big Data researchers around the world. Since safety-relevant data is distributed over many different servers in the railway system it is unlikely that a single computer cluster will collect all the safety-relevant information. It is envisaged that the central Hadoop cluster will be supported by auxiliary Hadoop clusters owned by train operating compa-nies.
2.3 User interfaces
To date we have experience with one user interface (for RAATS, see paragraph 3.1) and work on an ex-tensive literature review which is published else-where in this conference (Figueres et al. in prep.). We theorize that there will be three types of interfac-es that safety experts recognize: safety-dashboards, mobile applications and warning systems.
Safety dashboards are based on safety indicators that are calculated from the data-sources. A dash-board assists (safety) decision makers, enforcers, and analysts to assess the current safety-situation in the GB railways. Each indicator would be supplied by an individual BDRA application that works with dy-namic data from live-feeds or static data from data-bases. It is too early to report progress in this area but it is envisaged that the dashboard would be uni-form throughout the GB industry. That is to say, there will only be one dashboard application that can be accessed by all GB railway industry partners. RSSB’s SRM and the safety indicators associated with it are the starting point for BDRA safety indica-tors.
Mobile applications could present a safety dash-board but more likely they are tools for entering da-ta. At present, workers in the GB railways can use mobile applications to make a close call report. It is envisaged that mobile applications support a single group of workers, such as track workers. In contrast to the safety dashboard, many different mobile ap-plications will be used to support different groups of workers in the GB railway industry.
The third application would be a relatively straight-forward warning system. A warning system could give a heads-up for particular track sections when a storm is approaching or an automatic alerting system for the British Transport Police of rising crime rates at particular train stations. Again, it is envisaged that alarm systems would derive their information from the dashboard but would only target relevant groups of workers. Though these systems seem conceptually straightforward, the development of a reliable soft-ware application is challenging.
3 INITIAL BDRA APPLICATIONS
As this paper sticks to an overview of activities it is beyond the scope of this paper to give a complete description of the BDRA tools; this is reported else-where (Stow et al. 2015, Hughes & Figueres 2015, Hughes et al. in prep., Figureres et al. in prep.). A brief description of the applications provides insight in two fundamentally different developments.
3.1 RAATS
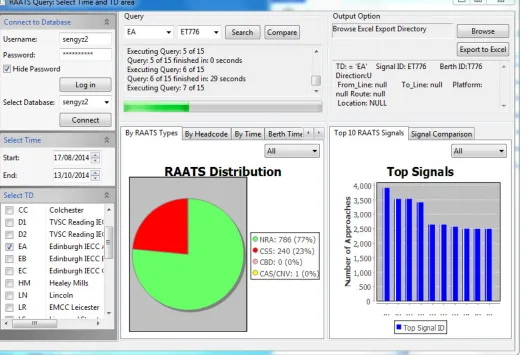
Figure 2. RAATS GUI showing signal ET776.
from minor incidents where a signal is passed by on-ly a few meters to a collision between fulon-ly loaded passenger trains. Following a fatal accident at Lad-broke Grove in 1999 in which there were 31 fatali-ties (HSE, 2000), the GB rail industry made signifi-cant efforts to reduce the rate of SPADs.
SPAD risks are analyzed using a process which examines the potential consequences of passing a particular signal at danger. A weakness in the analy-sis was that it is unknown how many times trains approach a signal when it is displaying a red aspect. This project addresses that shortcoming by analyzing live data from signaling systems.
The source of the information used in the RAATS software is Train Describer (TD) data (NR, 2015). A Train Describer is an electronic device connected to each signaling panel which provides a description of each train (its ‘headcode’) and which section of track (or ‘track section’) it currently occupies. RAATS software reads the TD live-feed, stores it in a data-base, calculates which trains actually approach a red aspect and presents the data in a graphical interface or creates an excel file for further analysis. The red approaches to a single signal can be analyzed over a period from a single day to a period of a year. Alter-natively the user can choose to analyze all signals in an area or indeed all the signals in the database.
Figure 2 illustrates the RAATS user interface. The pie chart shows the results for a single signal: ET776 which is located on the up Cowdenbeath line at Red-ford. The figure shows that at 23%, of trains ap-proach the signal at red in the period of the 17th of August 2014 to the 13th of October 2014 which is a high percentage compared with the average. The bar chart shows the signals with the highest train ap-proach frequencies (top ten) in the EA signaling area in Edinburgh (bottom left: Select TD). The names of the signals are not visible in this figure.
In this way, RAATS software provides intricate details about the number of trains approaching a sig-nal at danger. This information can be used in sub-sequent risk analyses for signals. RAATS adds value to safety on the GB railways by analyzing a (large) live data feed which makes it a BDRA application.
3.2 Automated analysis of Close Calls
their view, could have led to an accident. This leaves the reporter with more freedom to report what they think are dangerous situations and could, in theory, lead to a richer data-source for railway safety issues. The Close Call Database contains approximately 150,000 entries that were collected over a period of two years. Due to the large number of records, it is impractical to manually review the records and therefore computer-based techniques have been de-veloped to extract safety relevant information from them.
Since the key information relevant to safety man-agement is found in the free text computer assisted analysis of freeform text is used: Natural Language Processing or NLP. NLP techniques have been an emerging area of study over the past two decades road safety and medicine (Allen 1994, Wu and Hey-decker 1998, Dale et al. 2000, Xu et al. 2009). One of the key problems is the inherent ambiguity in written language. These include jargon, abbrevia-tions, misspelling and lack of punctuation. Pro-cessing of close call data by extracting information from free text involves five processes (Hughes & Figueres, 2015):
• Text cleansing, tokenizing, and tagging;
• Ontology parsing and coding (creation of a taxon-omy of related words);
• Clustering (creation of groups of records that are semantically similar);
• Text analysis;
• And information extraction.
As this process description suggests, a sensible au-tomated text analysis is complicated. The exact pro-cedure is described elsewhere and reported in a pa-per in this conference (Hughes et al. 2015). This paper highlights two results of the information ex-traction process.
The first information extraction process was the identification of incidents with track workers. The SMIS database (reportable incident database) shows
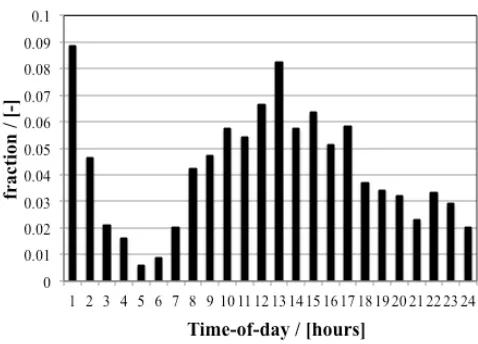
Figure 3. Frequencies of Workforce incidents in SMIS and Close Call.
that incidents with track workers take place more frequently in the hours between 11:00 and 15:00. This analysis was performed to investigate whether the same pattern is present in the close call database. An automated search query was programmed to re-trieve the protection/possession arrangements events in the close call database as function of time-of-day. The results are compare with track worker near miss events in the SMIS database as function of time-of-day (voluntary reporting of dangerous situations) and with all events in the close call database as a func-tion of time-of-day.
The relative distributions of these events by time of day are shown in figure 3. The figure illustrates that the SMIS incident database and close call re-ports follow similar trends during the day. Unfortu-nately, the times at which reports are made trend for all close calls are similar to the times reports are made for protection arrangements, which suggests that reporting bias may interfere.
The high fraction of close call events between 00:00 and 01:00 is due to a default of the reporting system that sets the time-stamp to 00:00 when the time of the incident is not entered by the person making the entry. This correction is made more fre-quently with the close call database than the SMIS database since there is less quality control on close call reports.
[image:6.595.311.550.596.768.2]A similar problem was investigated in relation to trespassing: do trespasses take place at certain times of the day or do they take place with equal probabil-ity throughout a 24 hour period? Figure 4 shows the frequency of occurrence for trespass based on auto-mated identification of trespass events in the close call database. Note that trespass does not occur with equal probability. Though trespasses occur in each hour of the day, the trend seems that they occur more frequently during working hours. What causes this trend is as yet unexplained but similar to the posses-sion entries, reporting bias may play a role.
[image:6.595.43.272.599.769.2]3.3 Reflection on application development
RAATS and the close call analysis were initiated to investigate whether computer scientists’ enthusiasm for the data-revolution is transferrable to rail safety for the GB railways. Two very different applications were selected on the basis that they are very different in nature. RAATS is an application that utilized live feeds to infer real-time safety information from In-ternet-based sources. This project demonstrates that sensible safety information can be derived from the live feeds currently available in GB. Since the soft-ware mostly deals with a numeric data-feed, it is rel-atively easy to comprehend the data and to design software for it. Yet, developing sensible software is a laborious process.
The close call project has proven to be a more complicated challenge. It involves cutting edge text-analysis methods, which are still under development in the computer sciences: NLP techniques and ma-chine learning have not led to standardized software tools that can easily be implemented for safety and risk management. Despite that automated analysis of free text in the close call database showed that useful safety information can be obtained by automated text analysis. This allows freedom for reporters to ex-press their safety concerns whilst searching for par-ticular risks remains straightforward. This flexibility allows for rapid data-searches which supports hy-pothesis testing and the identification of new, or previously unknown, risk factors. Similar findings were reported by Taylor et al. (2014).
The experience that was gained by developing these initial tools and the information that was un-locked by them shows promise for the future of on-line data analytical safety and risk techniques. It also shows that an integrated risk dashboard for the GB railway as a whole is still a long way off.
4 SOFTWARE DESIGN FOR BDRA
The experience with initial BDRA tools demonstrat-ed a nedemonstrat-ed for a new approach to the BDRA software architecture that would address major challenges re-lated to component technologies and data properties. Considering relevant relevance materials (e.g. Cohen et al. 2009, Sadashiv & Kumar 2011, Davenport 2014) and known best practices in defining architec-tures for new technologies, such as NIST Cloud Computing Reference Architecture, Intercloud Ar-chitecture Framework, and recent discussions by the NIST Big Data Working group, we have emphasized four components that address BDRA system:
• Data models, structures, types
• Data management, provenance, archiving
• Data analytics tools: BDRA software applica-tions, visualisation, presentation
• BDRA infrastructure, including storage, computational power, network, operational support
It is likely that all data-feeds that are available today carry safety-relevant information and many more da-ta-feeds might have to be monitored in the future. We expect that each data-feed would have a similar live-feed reading capability as RAATS and close call have today so the software for reading the live feeds, databases and incident entries could grow. In this approach, there would probably be a software layer that is exclusively dedicated to data-input pro-cessing. The subsequent analysis of the input data takes place in a second software layer. This layer may be based on applications and services the fol-lowing data centric applications have to be consid-ered: Hadoop related services and tools, cluster ser-vices, databases, NoSQL, parallel processing databases. Some of these tools are offered by the ma-jor cloud providers, such as Elastic Map Reduce, Dynamo, IBM Big Data Analytics, Cloudera howev-er at this development stage we need to undhowev-erstand the overall architectural requirements. For this rea-son, the work is currently based on an in-house Ha-doop cluster which makes it easier to control and understand software architectures. Decisions that have to be taken are mostly aimed at database archi-tecture, communication protocols and perhaps pro-gramming language.
The software layer that deals with output and in-terfaces with the user is the least clear at this point in time. As part of the research programme 300 rele-vant research papers have been identified about this issue. The first results from that literature review process seem to indicate that the application of In-formation Visualization (InfoVis) systems to big da-ta is not clear and new challenges are emerging. (Figueres et al. in prep.). Apart from that, visualiza-tion techniques are not just used for representavisualiza-tion of results, they can also play a part in selection of data-sets, representation of ontologies and software-monitoring tools. But the problem becomes more challenging when visualization techniques have to be tuned by safety experts and decision makers be-cause it involves in-depth understanding of psychol-ogy and risk.
5 CONCLUSION
This work investigates how the new internet-driven data-revolution could benefit safety and risk man-agement for railway safety in the UK.
Though computer scientists are quite clear in their belief that the data-revolution will unchain a man-agement revolution of uncanny proportions there does not seem to be a straightforward implementa-tion for managing safety and risk. Two initial pro-jects show that the data-analytical approach to rail-way risk analysis shows promise but the design of a smoothly operating integrated safety information system is not straightforward.
The RAATS project demonstrates that sensible safety information can be derived from live-feeds but the contribution is limited to part of the risks in the railways. Since RAATS is based on a numeric data-feed it is similar to technical risk analysis tools based on databases or RFID data. In that sense, it adds little additional knowledge to the safety and risk sciences. The close call project uses tools that are traditionally associated with computer science ra-ther than safety and risk sciences. It demonstrates that it is not straightforward to extract safety lessons from free text data. Despite that, it is possible to support safety analysts to answer hypotheses such as: “trespass is equally probable throughout the day” The authors believe that this particular line of inves-tigation could add new tools to safety and risk analy-sis in the future, for instance for the automatic classi-fication of incidents in databases, for selecting relevant incident investigation reports in relation to particular safety threats and for the automatic identi-fication of new safety risks based on text-searches alone. Yet the development of reliable tools will probably take quite some time.
In conclusion, the tools that are currently devel-oped in computer science will yield useful new tools for safety and risk management in the GB railways and in other risk domains. But the road to reliable computer systems for automated data-analytic tech-niques for safety and risk is not straightforward. It requires novel risk analysis techniques, automated linguistic tools, dedicated computer systems and sensible interface-techniques; many of which have to be researched in dedicated collaboration projects be-tween safety scientists, information technologists, software developers and railway engineers. The au-thors share the optimism that computer scientists have for big data, albeit in a much milder form.
6 REFERENCES
Allen JF 1994. Natural language processing. Encyclopedia of Computer Science, New York: John Wiley and Sons Ltd. ATOC 2015.
http://www.atoc.org/about-atoc/national-rail-enquiries/access-to-information/, accessed 10 April 2015.
Bearfield G, Holloway A & Marsh W 2013. Change and safety: decision-making from data, Proc. IMechE Part F, J. Rail and rapid transit 227(6): 704 - 714.
Chen, H., Chiang, R.H. & Storey, V.C. 2012, Business intelli-gence and analytics: from big data to big impact, MIS Quar-terly 36 no. 4: 1165 – 1188.
Cohen J, Dolan B, Dunlap M, Hellerstein JM & Welton C 2009. MAD skills: new analysis practices for big data,
Journal of the VLDB Endowment 2 iss 2: 1481-1492. Dacre M 2014. Safety risk model: risk profile bulletin, version
8.1, London: RSSB.
Dale R, Moisl H & Somers H 2000. Handbook of natural lan-guage processing, New York: CRC Press.
Figueres M, Hughes P & Van Gulijk 2015. InfoVis for BDRA, article prepared for ESREL 2015 Conference, 7-10 Sep-tember, 2015, Zurich, Switzerland.
Gnoni MG, Andriulo S, Maggio G & Nardone P 2013. Lean occupational safety: an application for a near-miss man-agement mystem design, Safety science 53: 96 104. HSE Books. 2000. Ladbroke Grove rail enquiry, Part 1,
Lon-don: Her Majesty’s Stationary Office.
Hughes P & Figueres-Esteban M 2015. Learning from close call events, Report: IRR 110/89, Huddersfield: IRR. Hughes P, Figueres M & Van Gulijk C 2015. Learning from
text-based close call data, article prepared for ESREL 2015 Conference, 7-10 September, 2015, Zurich, Switzerland. Li H, Parikh D, He Q, Qian B, Li Z, Fang D & Hamapur A
2014. Improving rail network velocity: a machine learning approach to predictive maintenance. Trans. Res. part C45: 17-26.
Kour R, Karim, R., Parida, A. & Kumar U. 2014. Applications of radio frequency identification (RFID) technology with e-maintenance cloud for railway system, Int j syst Assur eng manag 5(1): 99-106.
McAfee, A. & Brynjolffson E. 2012, Big Data: the manage-ment revolution, Harvard Business Review Oct 2012: 61 - 67.
Makalar B & Roy BK 2014. Survey of RFID applications in railway industry. First international conference on automa-tion, control and systems (ACES): 1 - 6.
Mayer-Schönberger & V Cukier K 2013. Big data: a revolution that will transform how we live, work, and think, New York: Houghton Mifflin Harcourt.
NR 2015. http://www.networkrail.co.uk/data-feeds/, accessed 10 April 2015.
Sadashiv N & Kumar SMD 2011. Cluster, grid and cloud com-puting: a detailed comparison, The 6th international confer-ence on computer sciconfer-ence & education (ICCSE 2011), Sin-gapore, August 3-5, 2011: 477- 482.
Stow J, Zhao Y & Harrison C 2015. Estimating the frequency of trains approaching red signals – a key to improved un-derstanding of SPAD risk, (accepted, Journal of Engineer-ing).
Tan X & Ai B 2011. The issues of cloud computing security in high-speed railway: International conference on electronic & mechanical engineering and information technology, Harbin, August 12-14: 4358 - 4363.
Taylor JA, Lacovara AV, Smith GS, Pandian R & Lehto M
2014. Near-miss narratives from the fire service: a Bayesian analysis, Accident analysis & prevention 62: 119-129. Thomas, P. 2014. The role of big data in railroading. Raiway
TSLG, 2012, RSSB/TSLG Report: The future railway, the in-dustry’s rail technical strategy, London: RSSB.
Watson HJ & Marjanovic O 2013. Big data: the fourth data management generation, Business intelligence journal 18 no. 3: 4 – 8.
White T. 2012. Hadoop, the definite guide 3rd ed., USA: O’Reilly media Inc.
Wu J & Heydecker BG 1998. Natural language understanding in road accident data analysis, Advances in engineering software 29: 599-610.
Xu H, Stenner SP, Doan S, Johnson KB, Waitman LR & Den-ny JC 2010. MedEx: a medication information extraction system for clinical narratives, Journal of the American med-ical informatics association 17(1): 19-24.
Yan B. Yu, W. 2009, Application of RFID technology in rail-way track inspection, First international workshop on Edu-cation technology and computer science: 526 - 529. Zhang, X & Tentzeris M. 2011. Applications of fast-moving