Munich Personal RePEc Archive
The paradox of “preferences”: regional
trade agreements and trade costs in
services
Miroudot, Sebastien and Shepherd, Ben
Groupe d’Economie Mondiale at Sciences-Po (GEM)
6 September 2012
Online at
https://mpra.ub.uni-muenchen.de/41090/
The Paradox of “Preferences”: Regional Trade
Agreements and Trade Costs in Services
Sébastien Miroudot and Ben Shepherd
∗September 6, 2012
Abstract
This paper analyzes the relationship between regional trade integration and trade costs in services industries. The empirical analysis relies, on the one hand, on a dataset of theory-consistent bilateral trade costs calculated for 55 countries over the period 1999-2009 and, on the other hand, on an analysis of services commitments in 66 regional trade agreements to which these countries are parties. Despite the proliferation of services RTAs in the past decade, we find that trade costs are only slightly lower due to the impact of these agreements. In addition, we find that the trade cost reductions that do take place tend to happen before the agreement is signed. This mechanism is consistent with countries using services RTAs as a way of “locking in” reforms. Finally, we find that the preferential margin of services RTAs is quite thin: mem-bers and non-memmem-bers both see slightly lower trade costs when an RTA is signed. We discuss the possible explanations for these findings in terms of the nature of services RTAs and their relationship with regulatory reform in signatory countries. Based on these results, we argue that regionalism in the case of services seems relatively non-discriminatory and does not lead to substantial trade preferences.
JEL Codes: F13; F15.
Keywords: Trade policy; Trade in services; Regional trade agreements; services trade liberaliza-tion.
1
Introduction
There are several motives for negotiating regional trade agreements (RTAs),1not all of them based on economic considerations (WTO, 2011). However, it should be obvious that when signing an RTA, countries aim at reducing trade barriers among themselves. Preambles of trade agreements generally emphasize the promotion of trade and the removal of trade distortions as objectives that motivate the disciplines of the agreement. We should therefore expect RTAs to decrease trade costs among their parties, and empirical work in the case of goods tends to support this idea (see for example Pomfret and Sourdin, 2009; Chauffour and Maur, 2011; and WTO, 2011for a review).
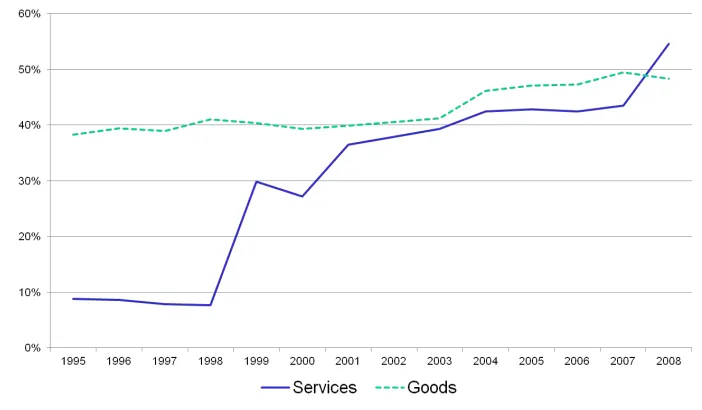
RTAs covering services have not proliferated as much as those covering goods. There were 88 agreements notified to WTO under the General Agreement on Trade in Services (GATS) at the end of August 2011, as compared to 213 notified under the General Agreement on Tariffs and Trade (GATT). While fewer RTAs deal with services, the share of world trade covered by these agreements is higher for services than for goods (Figure 1). As will be discussed below, one should not necessarily interpret the fact that two countries have an RTA in services as a sign of “preferential” trade. Figure 1 is just the share of world trade between countries that are parties to RTAs and not the share of “preferential” trade. In the case of goods, only 16 percent of world trade can be regarded as preferential,i.e. actually benefiting from a lower tariff in the context of the RTA (WTO, 2011). A similar result is to be expected for services as GATS-plus commitments are legal bindings that do not guarantee preferential treatment.
Recently signed RTAs are generally characterized as “deep integration” agreements because they go beyond traditional market access concerns and deal with a broad range of trade-related issues. They also deal more with “behind-the-border” policies and address domestic regulations that have an impact on trade. Services are somehow a “borderline” area. Part of services commitments in
1A note on terminology: we refer to “regional trade agreements” rather than “preferential trade agreements” (PTAs)
Figure 1: Share of World Trade Among Countries that are Parties to an RTA (1995-2008)
RTAs is strictly speaking about “market access”. But as barriers to trade in services are mainly “behind-the-border”, services also illustrate the “deep integration” disciplines in recent RTAs.
Moreover, there is a consensus in the literature on the fact that services RTAs are WTO-plus. Sev-eral studies have compared market access and national treatment commitments in GATS and com-mitments in RTAs and unequivocally found that the latter cover a much higher number of sub-sectors than the former (Marchetti and Roy, 2008; Fink and Molinuevo, 2008; Miroudot et al., 2010)2. But commitments are legal bindings and do not always correspond to the actual trade regime, which might be more liberal (or less liberal if implementation is lax). The extent to which services RTAs have led to trade liberalization and actually reduced trade costs is therefore an em-pirical question.
Building on Miroudot et al. (2012) where we have developed theory-consistent estimates of bilat-eral trade costs for a large number of countries over the period 1999-2009, this paper analyzes the relationship between regional integration and the evolution of trade costs in services industries. The next section explains how we measure trade costs in services and describes the database of services commitments in RTAs that we use in the analysis. Section 3 provides stylized facts on trade costs
2Some studies have also uncovered the phenomenon of GATS-minus commitments. See Adlung and Miroudot
within and outside regional trade agreements and Section 4 discusses why services RTAs seem to have a limited impact on trade costs in services. Section 5 provides econometric evidence on the trade cost impacts of services RTAs, and Section 6 concludes.
2
Empirical Data on Trade Costs and Services Trade
Liberal-ization at the Regional Level
2.1
Bilateral Trade Costs in Services: A Database Covering 55 Countries
over the Period 1999-2009
Starting from the standard, theory-consistent gravity model of Anderson and van Wincoop (2003), Novy (2011) develops a comprehensive measure of bilateral trade costs.3 Equation 1 presents that measure in ad valorem equivalent terms as τi jkt, whereiand j index countries,k indexes sectors,
andt indexes time. It is the geometric average of bilateral trade costs for exports from countryito countryjand from countryjto countryi, expressed relative to domestic trade costs in each country (ti j
tii and
tji
tj j respectively). To calculate it, all that is required is data on domestic production relative
to nominal exports in both countries (xii
xi j and
xj j
xji respectively). The parameterσ is the elasticity of
substitution among varieties in a sector, assuming the Anderson and Van Wincoop-based derivation of Novy’s measure of trade costs.
τi jkt =
t
i jkt.tjikt
tiikt.tj jkt 12
−1= x
iikt.xj jkt
xi jkt.xjikt 2(σ1
−1)
−1 (1)
Intuitively, Novy’s measure captures the fact that if a country’s trade costs vis-à-vis its trading partners fall, then a part of its production that was previously consumed domestically will instead
3In fact, Novy (2011) shows that basically the same measure can be derived from a wide variety of theoretical
be shipped overseas. Trade costs are thus closely related to the extent to which a country trades with itself rather than other countries, and data on this kind of relative openness can be used to track the level of trade costs and their variation over time. Importantly, this measure of trade costs is “top down” rather than “bottom up”. By this we mean that it infers the ratio of inter- to intra-national trade costs based on observed patterns of production and trade around the world, rather than building up an estimate of trade costs based on data covering particular types of impediments to trade. It thus takes account of all factors that influence trade costs, and is not subject to the kind of omitted variables bias that calls into question the results of previous attempts to measure trade costs in services by analyzing the results of gravity model estimates (e.g., Walsh, 2006).
We use this approach to calculate new trade costs measures for 55 countries and 7 broadly defined industries (including 4 for services) over the period 1999-2009. Our measure of trade costs captures the costs associated with “pure” cross-border services trade under Modes 1 and 2 of the General Agreement on Trade in Services (GATS). We do not extend the main database to sales by foreign affiliates (GATS Mode 3) or movement of service providers (GATS Mode 4) due to lack of data.4 For production (gross sectoral output), our primary data sources are EU KLEMS, the OECD’s STAN database, and the UN’s National Accounts Official Country Data. In addition, we use Input-Output (IO) tables for major Asian economies like China, India, Indonesia, and Taiwan, which are not represented in other sources.5 Data come from the OECD’s set of harmonized IO tables, and are interpolated because the tables are only updated every five years. To ensure cross-country comparability, gross output data are converted into USD before being combined with trade data to get a measure of trade costs. This is done using bilateral nominal exchange rates from the OECD and the IMF’s International Financial Statistics database (market rates, period average).
For data on trade in goods, we rely on the OECD’s ITCS database which provides data on bilateral trade flows directly in the ISIC Rev.3 format. Things are more complicated for services, where we
4In Section 4, we report results for sales of foreign affiliates based on a small sample of countries for which data are
available. We also indicate how bilateral “Mode 3 trade costs” could be calculated with an approach similar to Novy (2011).
5We have both gross output and exports at the industry level in the IO tables (the two variables needed to calculate
combine three data sources. First is the OECD’s TISP database (International Trade in Services by Partner Country). Second is Eurostat’s balance of payments statistics. And third is the UN’s Service Trade database. All data are converted from the EBOPS classification to ISIC Rev. 3 using a concordance. In line with Novy (2011), we assumeσ =8 throughout, but our results are robust to alternative assumptions. In particular, our choice of σ influences calculations of the level of trade costs, but relative values across countries and through time are only marginally sensitive to this parameter value.
2.2
Services Commitments in 66 RTAs
To assess the impact of RTAs on trade costs, we use a database developed at the OECD that covers all services agreements where an OECD economy, China or India is a party (Miroudot et al., 2010). This accounts for 66 of the 88 agreements notified to WTO under GATS Art. V (as of August 2011).6 The database reports market access and national treatment commitments in the 155 sub-sectors of the GATS Services Sectoral Classification List. Horizontal restrictions – those that apply to all subsectors – are also taken into account and reported on all subsectors. The information is provided for each signatory of the RTA by mode of supply.
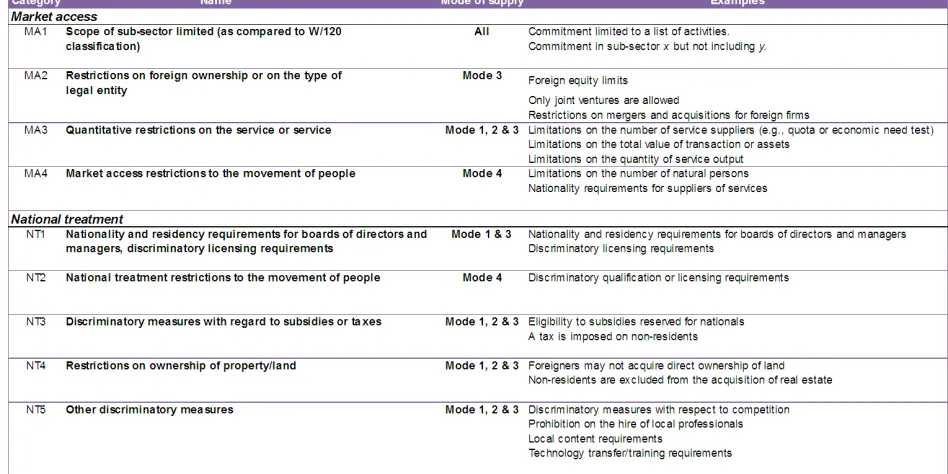
Commitments are either “full” (no limitation), “partial” (some limitations listed), or “unbound” (no commitment). In addition, “partial” commitments are broken down into nine different types of trade restrictive measures, four for market access and five for national treatment. This classification of non-conforming measures is detailed in Table 1. The database includes similar analysis for commitments in GATS and can be used to assess to what extent RTAs are WTO-plus and provide for additional commitments.
As this database is of a qualitative nature, we compute indices that capture the extent to which services RTAs are preferential as compared to the GATS. The methodology is the following. An initial score of 100 is assigned to each agreement, country, subsector and mode of supply regardless
Table 1: Typology of limitations in partial market access and national treatment commitments
of its degree of commitment (including the GATS). Then, depending on whether the subsector is “full”, “unbound” or subject to some restrictions (“partial”), some points are deducted from this amount. The precise number of points granted to each restriction relies on a few assumptions:
• Market access matters relatively more than national treatment;
• Unbound is worse than partial, which is in turn worse than full; and
• Quantitative restrictions such as quotas or licensing requirements are more trade-restrictive
than discriminations on subsidies or prohibitions on partnerships, for instance.
market access and national treatment but this should not be understood as trade being banned. It could be the case that no restrictive measure is actually in place in the country.
Table 2: Scores used to calculate the RTA indexes
Mode Market access National treatment
Unbound MA1 MA2 MA3 MA4 Full Unbound NT1 NT2 NT3 NT4 NT5 Full Mode 1 50 15 0 20 0 0 30 15 0 2.5 2.5 2.5 0
Mode 2 50 20 0 0 0 0 30 0 0 5 5 5 0
Mode 3 50 15 20 5 0 0 30 15 0 2.5 2.5 2.5 0 Mode 4 50 15 0 0 20 0 30 0 15 0 0 0 0
Since we work with data on cross-border trade in services, we assign Mode 1 a much larger weight (70%) than is the case for the other modes (10% for each). Yet, we choose not to give a zero-weight to Modes 3 and 4 to account for the potential complementarities that may exist between modes of supply. Mode 2 is also part of cross-border trade but is economically less important and rather difficult to restrict. We are now left with a score ranging between 0 and 100 for each agree-ment/country/subsector. The next step is then to compute for each RTA the difference between the agreement’s score and the GATS score. This difference therefore takes on values from -100 to 100. Because an agreement that is worse than GATS (i.e. a GATS minus agreement) is de facto ineffec-tive, we replace all negative values by zeros, which means no preferential treatment at all. Hence, the higher the value of the index, the more preferential the RTA for a given country/subsector.
3
Trade Costs and RTAs: Stylized Facts
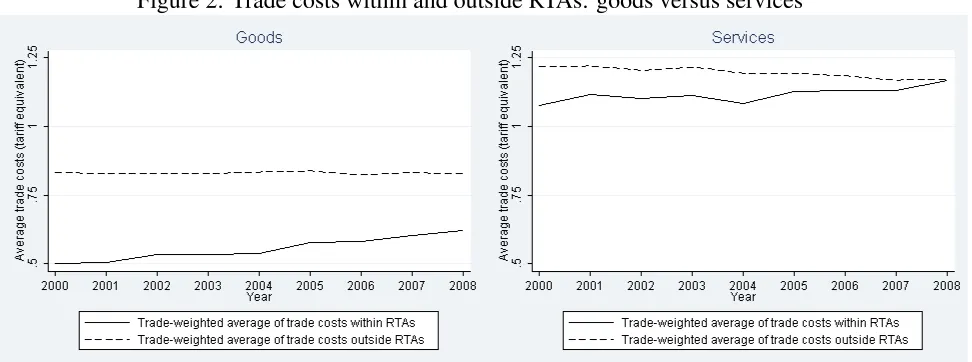
Our dataset provides bilateral trade costs at the industry level, as well as for total trade in goods and services respectively. To compare average trade costs within and outside RTAs, we use trade-weighted averages across countries. Trade costs for goods within RTAs are the average bilateral trade costs in manufacturing industries of countries that are party to an RTA covering goods. Trade costs for services are measured within RTAs that have provisions on services (a smaller subset of the RTAs covering goods). In addition, we keep only pairs of countries for which we have consistent data over time (between 2000 and 2008), to avoid entry and exit effects in the data. Figure 2 highlights the important difference between goods trade and services trade when it comes to the role of RTAs. On the left, we see that in the case of goods, trade costs are significantly lower within RTAs. The difference tends to narrow over time but trade costs in 2008 are still 10 percentage points lower within RTAs. For services, trade costs are on average higher than for goods. Tariff equivalents, whether within or outside RTAs, are always between 100 and 125 percent. In addition, the difference between trade costs measured within RTAs and those between countries that are not part of a services trade agreement is smaller than for goods, and diminishing over time: at the beginning of the period we cover (2000), trade costs for services are on average 8 percentage points lower within RTAs, but they are indistinguishable from trade costs outside RTAs by the end of the sample period (2008). It is important to note, however, that this analysis is purely descriptive, and does not control for other potential influences on trade costs. We therefore use an econometric model below to examine the issue in more detail.
Figure 2: Trade costs within and outside RTAs: goods versus services
agreements are of a different nature as compared to goods agreements.
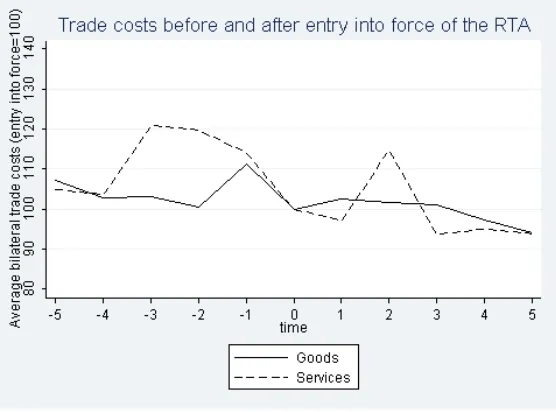
To further assess to what extent Figure 2 reflects the composition of the group of countries having signed an RTA or the evolution of trade costs within these RTAs, Figure 3 presents average bilateral trade costs before and after entry into force of the RTA. We set to t = 0 the year of entry into force of each agreement and we report the average trade costs (over all the RTAs) up to five years before and after this date. As trade costs are to some extent cyclical and vary over time, pulling different years together introduces some volatility but the results suggest that both in the case of goods and services, RTAs contribute to a decrease in trade costs. Of course, these descriptive data do not say anything about causality but they reinforce the view that Figure 2 captures partly a composition effect. Again, the analysis presented here does not control for any intervening influences, so we return to this question in the context of the econometric analysis in Section 4.
4
Econometric Analysis
Figure 3: Trade costs before and after the entry into force of the RTA
approach in which we rely on fixed effects to control for other factors that are typically thought to influence trade costs. By including fixed effects in the country-pair and time dimensions, we control for factors that are common to a country pair but do not change over time, such as geographical distance and cultural and historical factors, as well as variables that affect all countries in the same way each year, such as changes in the world price of oil that influence transport costs. We include a dummy variable equal to unity for those country-pair-year combinations in which an RTA is in force, and zero otherwise. Identification is therefore based on observed entry into RTAs over time, which is an aspect we exploit in further detail below by considering lags and leads of the RTA dummy.
Concretely, we initially estimate the following empirical model by OLS:
logτi jt = β1RTA_dummyi jt+αi j+γt+εi jt (2)
whereτi jt is bilateral trade costs calculated as in Equation 1.7 We estimate the model separately for 7Hornok (2011) has recently used a similar method to estimate the impact of EU membership on trade. She
total trade in goods and total trade in services, to show the different impacts of RTA commitments in the two cases.
Results are in Table 3.8 Columns 1 and 2 compare the impacts of RTAs in services and goods, using total (not sectoral) trade costs in both cases. The RTA dummy has a negative sign, as expected, and its coefficient is statistically significant at the 1% level in both regressions. Interestingly, the magnitude of the two coefficients is quite different: RTAs in services appear to reduce trade costs by relatively more than RTAs in goods, as the coefficient in column one is more than three times as large in absolute value as the coefficient in column 2. This finding represents a significant point of distinction with the descriptive analysis above, and highlights the importance of controlling for other variables in the analysis. The difference between the two coefficients (goods and services) is statistically significant at the 5% level. In terms of quantifying these effects, exponentiating our regression results suggest that signing an RTA in services tends to decrease trade costs by about 6.5%, compared with only about 2.2% in goods. Both of these effects are surprisingly small given the important role played by RTAs in the world trading environment, and we discuss further in the next section the possible reasons for finding such a small RTA effect. One important possibility, which we explore in more detail below, is that the trade cost impacts of RTAs, especially in services, flow on to non-members as well as members, a possibility that our baseline model does not allow for.
To provide greater detail on the impacts of RTAs on trade costs, we also present regression results for five services sub-sectors separately (Table 3 columns 3-7). The RTA dummy has the expected negative coefficient in all but one case, and it is 1% statistically significant in three of the five re-gressions. It is immediately clear, however, that services RTAs have very different implications for trade costs depending on the sector under consideration. In the cases of mining and utilities and
8We have also estimated the model using the RTA index described above, and results are consistent with those
other activities, for example, the impact on trade costs is statistically insignificant. One reason for this result could be that we only consider Mode 1 trade in these data, and those activities tend to rely to a heavier extent on Mode 3 as a means of market entry. By contrast, trade costs are very sig-nificantly reduced in the wholesale and retail trade sector, which also includes hotel and restaurant activities: trade costs after signing an RTA are on average 20.6% lower than in country-pair-year combinations without an RTA. This effect is much stronger than the average effect in column 1, which takes all sectors together. Results in the remaining sectors are also stronger than the average, but weaker than in wholesale and retail trade (12.implemention8% to 14.7%). These results sug-gest that either at the level of commitments undertaken or their subsequent implementation on the ground, there are substantial differences in the way in which different sectors are treated in services RTAs.
As noted above, the baseline model analyzes the effect of RTAs on trade costs by focusing on the immediate impact, i.e. the difference in trade costs between country pairs with an RTA in force versus those with no RTA in force. In fact, we can push our data further by limiting consideration only to those country-pairs that have joined an RTA during our sample period. By doing so, we can identify the dynamic impact of entering an RTA, which provides a richer set of information than its average effect over time. To do that, we replace the RTA dummy variable with a set of dummy variables taking the value of unity in, respectively, the year of entry into force of an RTA, and up to five years before and after that date. Goods and services are again considered separately, using total trade in both cases.
Table 3: Trade costs and RTAs: baseline regression results.
(1) (2) (3) (4) (5) (6) (7)
Services Goods Mining & Utilities Construction Wholesale & Retail Trade Transp. & Comms. Other
RTA_dummy -0.067*** -0.022*** 0.006 -0.159*** -0.231*** -0.137*** -0.046
(0.000) (0.000) (0.522) (0.000) (0.000) (0.000) (0.199)
Observations 19450 31140 25530 10898 18056 17380 14660
No. of Groups 2452 2964 2710 1736 2342 2266 2250
Overall R2 0.029 0.030 0.001 0.025 0.072 0.028 0.035
Note: OLS estimation with robust standard errors clustered by country-pair. All models contain fixed effects by country-pair and by year. Prob. values are indicated in parentheses beneath the parameter estimates. Statistical significance is indicated by: *** 1%, ** 5%, and * 10%.
discussion of Figure 2 and Figure 3: although there is surely a compositional effect at work, it is not the sole explanation for what is observed in the data. One mechanism that could explain this result is that preferential liberalization in services is associated with regulatory reforms that can only be undertaken over time, and so there is an important extent to which countries prepare for signing an agreement by already putting in place some of the reforms required for conformity with its terms. Another possibility is that countries use RTAs to lock in reforms that have already been decided and, to some extent, implemented beforehand. RTAs are thus a mechanism for expressing and securing the gains from domestic regulatory reform programs. Although the same dynamic is true for goods markets as well (column 2), the estimated coefficients are not always statistically significant, and they are much smaller in absolute value than for services. An F-test of the hypothesis that all the RTA dummy coefficients are jointly equal to zero is rejected at the 1% level for both services and goods, which suggests that the dynamics of policy adjustment indeed play an important role in both types of RTA.
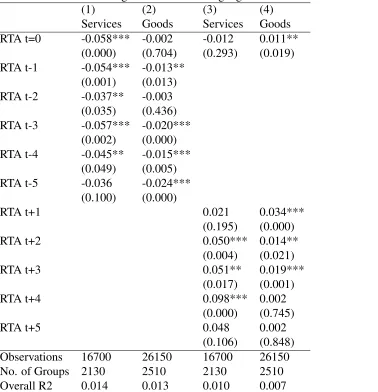
Columns 3 and 4 present similar results using leads instead of lags; these results therefore track post-signature implementation of RTAs. In both cases, we find an unexpected result: trade costs appear to increase to a statistically significant degree following the signing of an RTA. Up to three (in the case of services) or four leads (in the case of goods) are statistically significant and positively signed. Again, an F-test of the hypothesis that all the RTA dummy coefficients are jointly equal to zero is rejected at the 1% level in both cases. Taking all of these results together suggests the surprising finding that most RTA-associated liberalization takes place in the period prior to entry into force of the agreement, not afterwards. Given that most agreements allow for implementation periods before commitments take full force, this is an unexpected result. In terms of the political economy of liberalization, particularly in services, it strongly suggests that the primary motivation for an RTA is not actually to reduce trade costs going forward, but to commit to trade cost reductions that have already been made.
Table 4: Regression results using lags and leads of the RTA dummy. (1) (2) (3) (4)
Services Goods Services Goods RTA t=0 -0.058*** -0.002 -0.012 0.011**
(0.000) (0.704) (0.293) (0.019) RTA t-1 -0.054*** -0.013**
(0.001) (0.013) RTA t-2 -0.037** -0.003
(0.035) (0.436) RTA t-3 -0.057*** -0.020***
(0.002) (0.000) RTA t-4 -0.045** -0.015***
(0.049) (0.005) RTA t-5 -0.036 -0.024***
(0.100) (0.000)
RTA t+1 0.021 0.034*** (0.195) (0.000) RTA t+2 0.050*** 0.014**
(0.004) (0.021) RTA t+3 0.051** 0.019***
(0.017) (0.001) RTA t+4 0.098*** 0.002
(0.000) (0.745) RTA t+5 0.048 0.002
(0.106) (0.848) Observations 16700 26150 16700 26150 No. of Groups 2130 2510 2130 2510 Overall R2 0.014 0.013 0.010 0.007
other is not. Including this variable in the model makes it possible to examine the effects of RTAs on trade costs both within the agreement (RTA_dummy) and vis-a-vis outsiders to the agreement (RTA_out_dummy). We present results in Table 5 using first total services and goods trade, and then services trade broken down by sub-sector.
Column 1 confirms results from the baseline model, with a negative and statistically significant co-efficient on the RTA dummy which is, however, much larger in absolute value than the comparable figure in Table 3. The coefficient on RTA_out_dummy is also negative and 1% statistically signif-icant, which is consistent with a smaller, but still negative, impact on trade costs for non-members of an RTA. This finding is repeated in column 2, where the same pattern of signs and significance is apparent in the case of goods, although both effects are much weaker. Together, the regressions in columns 1 and 2 suggest that RTAs tend to act more as building blocks than as stumbling blocks with respect to the multilateral system, in the sense that they lower trade costs for members as well as non-members. The building block effect is particularly pronounced in the case of services, which is consistent with the observation that “preferential” liberalization is difficult in that sector, since regulatory reform often occurs on a de facto MFN basis. It is also consistent with the descriptive evidence presented above, which highlighted a relatively narrow “margin of preference” in the case of services trade. Our finding for goods markets is at odds with existing evidence on tariffs for the US and EU (Limao, 2006), but it can perhaps be explained by the use of a broader range of countries (as in Freund, 2010) and the inclusion of non-tariff as well as tariff-related trade costs. Our finding on the building block effect of services RTAs is the first time such evidence has been discussed in the literature.
sectors. Comparing the magnitude of the two coefficients in each column suggests that although some margin of preference for non-members exists, and is significant in some sectors, the overall impact on trade costs facing both members and non-members is negative. As a preliminary view, therefore, we can expect that RTAs in services are likely to display dominance of trade creation over trade diversion effects, although this would of course need to be confirmed by detailed modeling in the case of individual agreements.
5
Why are Services Trade Costs not Lower within RTAs?
5.1
Can We Trust the Data?
Anybody working in the area of services trade knows that cross-border trade statistics at a disaggre-gated level (by partner country and/or by industry) are problematic. To begin with, the coverage of balance of payments trade data is not comprehensive. Although total trade in services is generally available for most economies, trade by partner country or by industry is missing for a significant number of reporters. In addition, for countries that do provide the disaggregated data, there is still a large share of unallocated trade (Miroudot and Lanz, 2008). For example, in our dataset based on the OECD TISP database, adding all the bilateral by industry data gives us a figure that represents on average 69% of the total trade reported by countries. Almost one third of trade in services is not allocated to specific partners or industries.
Table 5: Regression results using the RTA out dummy.
(1) (2) (3) (4) (5) (6) (7)
Services Goods Mining & Utilities Construction Wholesale & Retail Trade Transp. & Comms. Other
RTA_dummy -0.264*** -0.069*** -0.062*** -0.321*** -0.464*** -0.449*** -0.397***
(0.000) (0.000) (0.000) (0.000) (0.000) (0.000) (0.000)
RTA_out_dummy -0.197*** -0.047*** -0.066*** -0.155*** -0.237*** -0.319*** -0.346***
(0.000) (0.001) (0.000) (0.000) (0.000) (0.000) (0.000)
Observations 19450 31140 25530 10898 18056 17380 14660
No. of Groups 2452 2964 2710 1736 2342 2266 2250
Overall R2 0.060 0.032 0.001 0.033 0.088 0.063 0.082
Note: OLS estimation with robust standard errors clustered by country-pair. All models contain fixed effects by country-pair and by year. Prob. values are indicated in parentheses beneath the parameter estimates. Statistical significance is indicated by: *** 1%, ** 5%, and * 10%.
belonging to any RTA). Issues related to statistics affect all economies within or outside RTAs. The only case where we should seriously investigate the role of statistical issues is the EU. Because of the European integration process, there is less information available on intra-EU trade, as opposed to extra-EU trade.
More important, it seems to us, is the question of whether covering only cross-border trade in services has an impact on our assessment of regionalism. Cross-border trade in services includes Mode 1 and to some extent Mode 2 and Mode 4 trade in services. But with some rare exceptions,9 Mode 3 trade in services is not part of the cross-border trade statistics. To the extent that RTAs encourage Mode 3 over cross-border trade (in particular when they include an investment chapter that also liberalizes FDI), a substitution between cross-border trade and sales through commercial presence could explain why we do not see a larger impact of RTAs on cross-border trade costs.
Unfortunately, data on sales of foreign affiliates (Foreign Affiliates Trade Statistics) are even less available than cross-border trade in services data. We can, however, apply a methodology similar to the one we apply to cross-border trade to measure the bilateral “investment costs” or more exactly the cost of selling through a foreign affiliate, the foreign affiliate sales (FAS) cost. Building on Head and Ries (2008), Gormsen (2011) has developed a measure of the cost of barriers to FDI. We can apply a similar methodology to sales of foreign affiliates, as the formula is in the end a derivation of the gravity equation and the gravity equation applies to FAS as well (see Bergstrand and Egger, 2007 and Kleinert and Toubal, 2010).
We calculate the bilateral FAS cost as10:τi j =
q
Salesi j.Salesji
SalesiiSalesj j
where sales fromiinjandjiniare bilateral FAS, while the sales ofiini(andjinj) are the domestic
9For example, in the case of construction services, balance of payments data cover to some extent short-term
contracts where there is commercial presence in the sense of GATS but no establishment (the foreign company operates in the territory of the partner country on the basis of a local office and remains a non-resident entity whose revenues are regarded as an international transaction recorded in the balance of payments). Construction services data sometimes include the cost of construction materials which are goods, another issue for accurately measuring the services trade involved.
10We do not discuss extensively the methodology as it is not the purpose of this paper to measure FAS costs. Deriving
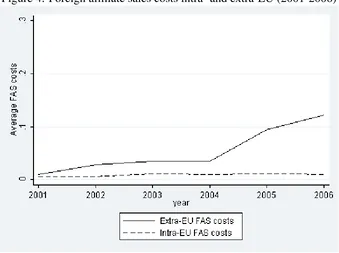
Figure 4: Foreign affiliate sales costs intra- and extra-EU (2001-2006)
sales (calculated as national turnover minus the sales of foreign affiliates). Due to constraints on the availability of such data, we calculate these bilateral FAS costs for 54 countries over the period 2001-2006. Figure 4 below presents the average FAS cost intra- and extra-EU. Since there are very few non EU countries in the dataset, one should not over-interpret the results, and generally speaking FAS statistics are quite fragmentary. But the point is that for EU countries for which we have relatively better FAS data, there is no indication that FAS costs have diminished within the EU in the first half of the 2000s. However, FAS costs are found to be lower within the EU and the discrepancy between intra- and extra-EU FAS costs increases over time. This increase probably reflects the availability of more data over time as because of the gaps in the data there are more and more non-EU pairs after 2004.
possibility that one reason why RTAs do not reduce cross-border trade costs more strongly is the relationship between Modes 1 and 3.
5.2
Services Reforms: Do They Benefit Domestic and Foreign Producers in
a Similar Way?
In our analysis, we define trade costs as the additional costs faced by foreign suppliers as opposed to domestic producers. Equation 1 relates “domestic trade costs” to international trade costs. Because the measure is relative, a reform that would have the same (or a proportional) impact on domestic and foreign suppliers would not affect trade costs estimates. Another way of interpreting Figure 2 would then be that any services trade liberalization (resulting or not from the signature of a RTA) lowers trade costs for all suppliers so that the ratio between foreign and domestic costs is not altered.
This would be the case first if RTAs had no impact on the actual trade regime. Schedules of commitments in services are legal bindings. Countries take market access and national treatment commitments, but often these commitments just reflect the current state of regulations. Already at the multilateral level, the literature points out that countries have locked-in their current regime and have not used GATS to liberalize trade (Hoekman, 1996; Adlung and Roy, 2005). It is even less likely that they would use RTAs to open up new services sectors. Reforming the telecoms sector or changing regulations for maritime transport will generally not be the outcome of a bilateral trade agreement. The political economy of services trade negotiations, involving a trade ministry which is generally not in a position to commit to reform key product markets, could explain why RTAs are about legal bindings and not actual trade reforms (VanGrasstek, 2010). Such bindings could nonetheless have a positive impact on trade by reducing the uncertainty around the trade regime and by bounding the level of restrictiveness the partner country could introduce in the future.
tackle in the context of services trade (Sauvᅵ and Mattoo, 2011; Sauvᅵ and Shingal, 2011). Some measures are not really prone to discrimination between domestic and foreign suppliers. For example, market regulations introducing rules on prices, access to networks or increasing the powers of a competition authority will equally benefit domestic and foreign services suppliers. It is not possible to create a market more competitive for domestic suppliers only or foreign suppliers would have to be totally excluded from this market. Then, there are measures such as licenses or taxes where it would be technically feasible to introduce discrimination between domestic and foreign producers, but where in practice this is not the case. In the end, discriminatory measures are limited to foreign equity restrictions, labor market tests for the entry of natural persons, and the recognition of qualifications. But even in these areas, not all countries introduce discriminatory measures.
The trend in services reforms is also to increase competition, including by allowing foreign pro-ducers to enter the domestic market and compete. Countries that have reformed their telecoms or energy sectors, for example, have generally encouraged the entry of foreign firms to increase productivity and lower prices for consumers. In the presence of an incumbent firm previously benefiting from a domestic monopoly, foreign competition is important for the market to become competitive. Services reforms are generally not of a discriminatory nature and this gives less op-portunities for negotiators of RTAs to offer genuine preferences to partner countries.
5.3
Is Services Trade Liberalization de facto MFN?
temporary services providers of a given nationality. But in practice, there are very few instances where countries do discriminate.
Once again, one should keep in mind that services are generally regulated in domestic laws that are designed for domestic purposes by the ministries in charge of specific services sectors. Such laws are not used for commercial diplomacy and do not include legal instruments giving opportunities to trade negotiators to grant actual preferences to specific countries. This is why services RTAs are most of the time about “preferential bindings” rather than actual preferences.
Another reason is that rules of origin for services are quite liberal in the case of legal persons (Fink and Nikomborirak, 2007; Miroudot et al., 2010). GATS Article V:6 requires that foreign services suppliers established in a country and engaged in “substantive business operations” benefit from the treatment granted in RTAs signed by that country. For example, EU companies established in the US can benefit from NAFTA provisions and have the same treatment as US companies export-ing services to Mexico or Canada. The “substantive business operations” criterion is generally not subject to specific tests or requirements.11 This could explain why countries are not willing to intro-duce discriminatory barriers to cross-border trade in services. Such barriers could be circumvented by the establishment of companies in countries that would have the most preferential treatment.
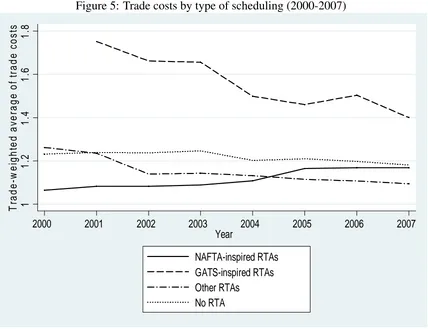
This being said, we observe in our dataset differences in trade costs according to the partner coun-try. Figure 5 highlights differences based on the architecture of RTAs and the way of scheduling commitments. Trade costs tend to be lower between countries having signed a NAFTA-inspired RTA12 where there is a negative list of commitments and where services and investment (including investment in services) are dealt with in two separate chapters. GATS-inspired RTAs that follow the GATS approach for scheduling commitments (a positive list of sub-sectors where market access and national treatment commitments are made by mode of supply, followed by a list of limitations) have on average higher trade costs, even higher than for pairs of countries with no RTA.
However, Figure 5 should not be interpreted as a causal relationship between the way of scheduling
11An exception is found in the agreements signed by China with Hong Kong and Macao (see Emch, 2006)
12See Houde et al. (2007) for a more detailed discussion of NAFTA-inspired versus GATS-inspired regional trade
commitments and the level of trade costs. The results are essentially based on the composition of each group of countries whose trade costs are being measured. Trade costs are the lowest (at the end of the 2000-2007 period) in the group of “other RTAs” that includes economic integration agreements such as the EC Treaty, the European Economic Area (EEA) agreement, the agreement of the European Free Trade Association (EFTA), and the Australia New Zealand Closer Economic Partnership Trade Agreement (ANZCEPTA). By definition, countries party to these agreements are geographically and culturally closer, hence their lower bilateral trade costs. NAFTA-inspired agree-ments were originally signed between close countries (initially Canada, Mexico and the United States) and over the period trade costs are found to be higher when the NAFTA template is used by other countries. GATS-inspired agreements include many North-South and South-South RTAs signed between countries geographically and/or culturally more distant and where services trade is less developed.
Figure 5: Trade costs by type of scheduling (2000-2007)
1 1 .2 1 .4 1 .6 1 .8 T ra d e -w e ig h te d a v e ra g e o f tr a d e c o s ts
2000 2001 2002 2003 2004 2005 2006 2007 Year
NAFTA-inspired RTAs GATS-inspired RTAs Other RTAs
6
Conclusion
This paper has addressed the question of whether services RTAs have an impact on bilateral trade costs. In the case of services, we find that RTAs do indeed reduce trade costs, but that the impact is quite modest: perhaps 6.5% on average. In addition, we find strong evidence that the “preferential margin” of services RTAs is surprisingly thin, since these agreements tend to reduce trade costs for both members and non-members alike. Although these results might appear to be surprising at first glance, they are in fact to be expected when one looks more closely at how services trade liberalization takes place and what the role of services chapters in RTAs is. Services agreements are about preferential bindings and generally do not introduce actual discrimination that would favor services suppliers from the parties to the agreement. They also have relatively liberal rules of origin that allow third parties to easily gain access to preferential regimes through commercial establishment in a preferred partner. As such, services RTAs are to some extent paradoxical. They signal a preference for specific partner countries but they do not provide them with substantial preferential treatment, unlike what can be observed with goods. From an economic perspective, this is all the better as preferences lead to trade distortions.
References
Adlung, R., Miroudot, S., 2012. Poison in the wine? Tracing GATS-minus commitments in re-gional trade agreements. Journal of World Trade 46 (5), forthcoming.
Adlung, R., Roy, M., 2005. Turning hills into mountains? Current commitments under the General Agreement on Trade in Services and prospects for change. Journal of World Trade 39 (6), 1161– 1194.
Bergstrand, J., Egger, P., 2007. A knowledge-and-physical-capital model of international trade flows, foreign direct investment, and multinational enterprises. Journal of International Eco-nomics 73 (2), 278–308.
Chaney, T., 2008. Distorted gravity: The intensive and extensive margins of international trade. American Economic Review 98 (4), 1707–21.
Chauffour, J.-P., Maur, J.-C. (Eds.), 2011. Preferential trade agreement policies for development. A handbook. The World Bank.
Eaton, J., Kortum, S., 2002. Technology, geography, and trade. Econometrica 70 (5), 1741–1779.
Emch, A., 2006. Services regionalism in the WTO: China’s trade agreements with hong kong and macao in light of Article V(6) of GATS. Legal Issues of Economic Integration 33, 351–378.
Fink, C., Molinuevo, M., 2008. East asian preferential trade agreements in services: liberalisation content and wto rules. World Trade Review 7 (4), 641–673.
Fink, C., Nikomborirak, D., 2007. Rules of origin in services: a case study of five asean countries. Policy Research Working Paper 4130, The World Bank.
Freund, C., 2010. Third country effects of regional trade agreements. The World Economy 33 (11), 1589–1605.
Gormsen, C., January 2011. The declining barriers to foreign direct investment and how to see them, mimeo.
Head, K., Ries, J., 2001. Increasing returns versus national product differentiation as an explanation for the pattern of u.s.-canada trade. American Economic Review 91 (4), 858–876.
Hoekman, B., 1996. Assessing the general agreement on trade in services. In: Martin, W., Winters, L. A. (Eds.), The Uruguay Round and the developing countries. Cambridge University Press, pp. 88–124.
Hornok, C., 2011. Gravity or dummies? the limits of identification in gravity estimations. CeFiG Working Papers 15, Center for Firms in the Global Economy.
Houde, M.-F., Kolse-Patil, A., Miroudot, S., 2007. The interaction between investment and services chapters in selected regional trade agreements. OECD Trade Policy Working Paper 55, OECD Publishing.
Kleinert, J., Toubal, F., 2010. Gravity for fdi. Review of International Economics 18 (1), 1–13.
Limao, N., 2006. Preferential trade agreements as stumbling blocks for multilateral trade liberal-ization: Evidence for the united states. American Economic Review 96 (3), 896–914.
Marchetti, J. A., Roy, M., 2008. Services liberalization in the WTO and in PTAs. In: Marchetti, J. A., Roy, M. (Eds.), Opening Markets for Trade in Services. Countries and Sectors in Bilateral and WTO Negotiations. Cambridge University Press, pp. 61–112.
Miroudot, S., Lanz, R., 2008. Measuring bilateral trade in services: A note on the data collected and estimated for the services trade restrictiveness index. Tech. Rep. TAD/TC/SXM(2008)2, OECD.
Miroudot, S., Sauvage, J., Shepherd, B., 2012. Trade costs and productivity in services sectors. Economics Letters 114 (1), 36–38.
Miroudot, S., Sauvage, J., Sudreau, M., 2010. Multilateralising regionalism: how preferential are services commitments in regional trade agreements? OECD Trade Policy Working Paper 106, OECD Publishing.
Pomfret, R., Sourdin, P., 2009. Have asian trade agreements reduced trade costs? Journal of Asian Economics 20 (3), 255–268.
Sauvï¿œ, P., Mattoo, A., 2011. Services. In: Chauffour, J.-P., Maur, J.-C. (Eds.), Preferential trade agreement policies for development. A handbook. The World Bank, pp. 235–274.
Sauvï¿œ, P., Shingal, A., 2011. Reflections on the preferential liberalization of services trade. Jour-nal of World Trade 45 (5), 953–963.
VanGrasstek, C., 2010. The political economy of services in regional trade agreements. OECD Trade Policy Working Paper 112, OECD Publishing.
Walsh, K., 2006. Trade in services: Does gravity hold? a gravity model approach to estimating barriers to services trade. Discussion Paper Series 183, Institute for International Integration Studies.