Munich Personal RePEc Archive
Dynamic linkages and interdependence
between Mediterranean region EMU
markets during 2007 financial crisis
Dimitriou, Dimitrios and Mpitsios, Petros and Simos,
Theodore
Department of Economics, University of Ioannina
August 2011
Online at
https://mpra.ub.uni-muenchen.de/37476/
Dynamic linkages and interdependence between Mediterranean
region EMU markets during 2007 financial crisis
Dimitrios Dimitriou
Department of Economics, University of Ioannina University Campus, 45110 Ioannina, Greece
E-mail: ddimi@cc.uoi.gr
Petros Mpitsios
Department of Finance and Auditing Technological Educational Institute of Epirus
TEI Campus, 48100 Preveza, Greece E-mail: petros_bit@hotmail.com
Theodore Simos
Department of Economics, University of Ioannina University Campus, 45110 Ioannina, Greece
E-mail: tsimos@cc.uo.gr
Abstract
This paper examines the volatility spillover effects among Mediterranean equity markets and investigates the effects of the 2007 financial crisis. German, Greek, Spanish, Italian and Portuguese markets are investigated. German market is used as a benchmark market. We employ a multivariate generalised autoregressive conditional heteroskedasticity (MGARCH) model to identify the direction and magnitude of volatility spillovers. By using a sample of daily data from 1994 to 2009, we find evidence that before the global crisis begins, the largest impact in Mediterranean markets had the Germany market. In post-crisis period, Spain had the higher spillover effects between the other markets, followed by Germany, Italy, Portugal and Greece. Our results have implications for investors, policy makers, entrepreneurs and academicians.
JEL codes: F36, C52, G15
1. Introduction
This paper empirically investigates the transmission of equity return’s volatility between four Mediterranean region European Monetary Union markets: Greece, Spain, Italy and Portugal before and during the global financial crisis. We also use the Germany as a benchmark market.
These markets have influenced to various degrees from the 2007 financial crisis that started from US. At the same time the ongoing liberation of financial markets and the increasing integration of the world economy have deepen and broaden the various financial links of equity markets, through channels as capital or FOREX markets. An economic or financial event could easily spillover to other countries and triggers sometimes an unforeseen financial crisis. Meanwhile, in the past decades, events of financial crises have frequently happened, often marking a turning point of economic cycle. For instance, 1987 Black Monday, 1991 Japanese asset price bubble collapse, 1997 Asian Financial Crisis, 2001 dot com bubble and the 2007, not yet ended, subprime financial crisis. The last 15 years dynamic linkages of equity markets from various regions of world have received attention. For 1997 Asian crisis, Wang and Lee (2009) found that after the Asian crisis, spillover effects of the stock returns and stock return volatilities in the nine Asian stock markets were larger than those before the crisis and Baig and Goldfajn (1999) found evidence of contagion for 4 Asian financial markets. For the current 2007 crisis an empirical study of Angkinand et al. ( indicates that the degree of interdependence and spillover effects were greatest after the emergence of the U.S. subprime mortgage meltdown in the summer of 2007, and even more so after the collapse of Lehman Brothers in September 2008.
In this study we empirically investigate the effects of 2007 subprime financial crisis, regarded as the most serious crisis, after the great depression, with severe consequences in international economy. This financial crisis spread from the US housing markets to domestic credit markets and mushroomed into a global financial crisis. The heavy exposure of a number of EU countries to the US subprime banking problem was clearly revealed in the summer of 2007 when BNP Paribas froze redemptions for three investment funds, citing its inability to price structured products.
In order to study the volatility spillover effects of stock markets under examination, we employ a multivariate generalised autoregressive conditional heteroskedastic (MGARCH) model, see, for instance, Shamiri et al. (2009), Saleem (2009) and Caporale et al. (2009). In contrast with these studies that encompass a BEKK-MGARCH framework, we choose to estimate a vector-diagonal model that has fewer parameters.
As far as the authors are aware, no study to date has examined the spillover effects of volatility across the broad spectrum of Mediterranean markets within the context of the MGARCH model.
The rest of the paper is structured as follows. The second section discusses the data employed while the econometric methodology used to estimate the volatility spillovers is outlined in the third section. The empirical results are discussed in the fourth section. Fifth section concludes.
The data set employed covers 15 years, spanning the period fromJune 1994 to June 2009, and contains 3914 observations of each market. The data sample covers the global financial crisis period from 9 August of 2007 through April 20091. It includes daily US-dollar denominated returns2 on stock indices for four major in terms of capitalization international financial markets. All data are extracted from Datastream. The daily stock return is computed as
r
i t,ln(
p
t/
p
t 1)
wherep
t is the markettotal return index (dividend included) expressed in US dollars at time
t
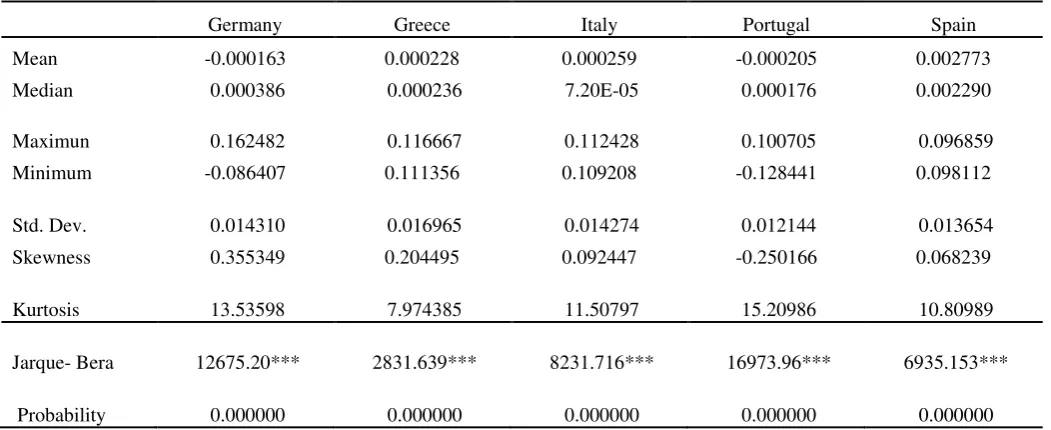
. Table 1 presents descriptive statistics for each return series for the period 1994 to 2009. Samples means, medians, maximums, minimums, standard deviations, skewness, kurtosis and the Jacque-Bera statistic and p-value are reported for the daily euro returns. The highest mean returns is in Spain while the lowest is in Portugal.As anticipated, volatility (as measured by standard deviation) is higher in Greece The rest three markets display similar levels of volatility ranging from 0.012144 (Portugal) to 0.016965 (Greece). A visual perspective on the volatility of returns can be gained from the plots of daily returns for each market in Figure 1. These findings are in accordance with the analysis of equity returns and volatility by Erb et al. (1996) and Worthington and Higgs (2004).
The distributional properties of the return series appear to be non-normal. For that reason and due to excess kurtosis and fat tails in residuals, we use the t-student distribution. Although Germany, Greece, Italy and Spain have positive skewness, while in contrast Portugal is negatively skewed. The kurtosis, or degree of excess, in all under examination markets are platukertic. The final statistic in Table 1 is the calculated Jarque-Bera statistic and corresponding p-value used to test the null hypotheses that the daily distribution of returns are normally distributed. With all p -values equal to zero at four decimal places, we reject the null hypothesis that returns for all markets are well approximated by the normal distribution
3. Econometric models for the estimation of spillover effects
First we need to filter out the autocovariance structure of the returns series and decouple it from the conditional variance. So we apply the VAR model:
1
n
t s s t s t
r
a r
, (1)where
r
t is the4 1
column vector of equity markets returns, anda
are, respectively, a4 1
vector and a4 4
matrix of parameters and t are4 1
vectors of innovations. The chosen lag length is of order six3.
1According to Cecchetti (2009) the real trigger came on Thursday August 9, the day that the
large French bank BNP Paribas temporarily halted redemptions from three of its funds that held assets backed by U.S. subprime mortgage debt. The consequences and effects of this Crisis are not yet ended around the globe.
2 As suggested by Bekaert and Harvey (1995), calculating the returns in U.S. dollars eliminates
the local inflation.
3 The VAR order length is selected by the final predicted error and the Akaike criterion. The
Next we employ the Bollerslev, Engle and Wooldridge (1988) representation of the multivariate GARCH model in order to estimate the conditional variance and spillover effects. In Vech form, the conditional covariance matrix is specified as follows:
'
1 1
(
)
(
)
(
)
q p
t j t i t i j t j
j j
vech H
c
A vech u u
B vech H
(2)Where
vech
( )
denotes the column stacking operator of the lower portion of a symmetric matrix. So,c
is aN N
(
1) / 2 1
vector and matricesA
j andB
j are of dimensionN N
(
1) / 2
N N
(
1) / 2
.The Vech representation of MGARCH is quite general; however possess two disadvantages in applied work. Firstly, the number of parameters to be estimated increases sharply with the dimensionality of the system matrices. And secondly, the estimated conditional covariance matrices are not guaranteed to be positive definite For this reason, we adopt the MGARCH(1,1) diagonal Vech model4 (Ding and Engle, 2001):
' ' ' '
1 1 1
t t t t
H
CC
AA
u u
BB
H
, (3)where
,
|
1(0,
, )
i t t t
u
student
H v
, t 1 is the information set at timet
1
,is the Hadamard (element by element) product.
The conditional errors are
assumed to follow the
Student’s
t-distribution since it may improve efficiency, under a correctly specified Garch model (Susmel and Engle, 1994). SinceCC
','
AA
andBB
' are all positive semi-definite,H
t will be positive definite for allt
as far as the initial covariance matrixH
0 is positive definite. If sample covariance isused for
H
0 thenH
t will always be positive definite.Let ij
( ,
C C
') ,
ij ij(
AA
') ,
ij ij(
BB
')
ij, then it is readily seen that,1 1 1
, ,
1,..., .
ijt ij ij it jt ij ijt
h
u
u
h
i j
N
(4)The elements of A matrix measure the intensity of spillover effects among markets while the elements of matrix B measures the persistence of conditional variance between market
i
and marketj
.The final form of the model estimated is the simplified version of Matrix-Diagonal Model.
' ' ' '
1 1 1
t t t t
H
CC
aa
u u
bb
H
, (5)
4 It is generally agreed that a GARCH(1,1) specification with lag length one is adequate to
where
a
andb
areN
1
vectors. Here the imposed restrictions on parameter matrices A and B are to be rank one. This model is named by Ding and Engle (2001) Vector-diagonal model. By imposing extra conditions on the model we substantially reduce the parameters that need to be estimated while keeping the estimated conditional covariance matrices positive definite.4. Empirical results
Starting date of the 2007 financial crisis is regarded as the bankrupt of BNP Paribas, at 9 August 2007. The sample is divided into two sub-periods before and after the starting date of financial crisis. Notice that there are many researchers that used this date as the starting point namely: Acharya1 and Schnable (2010), Brunnermeier (2010) and Cecchetti (2009) among others.
Estimates of (5) for the period before and after the crisis are reported in Tables 2 and 3, respectively. In line with several other studies, i.e. Worthington and Higgs (2004) and Saleem (2008), parameter estimates are statistically significant for both sample periods indicating the presence of strong ARCH and GARCH effects.
4.1 Pre-Crisis period (April 1996- 9 August 2007)
For the own volatility effects parameters,
A
ii,i
1,...,5
, we observe that Germany’s conditional variance seems to be affected from its own lagged shocks, relatively stronger compared to the other four markets, followed by Spain, Italy, Greece and Portugal.In terms of cross volatility spillover effects, we observe that the link between cross lagged product of innovations and corresponding cross conditional covariances are stronger on the pair Germany-
i
,i
1,..., 4
than rest. Furthermore, these results show a high level of interdependence between Germany and the other markets.On January 1, 1999, eleven European Union (EU) countries, namely Austria, Belgium, Finland, France, Germany, Ireland, Italy, Luxembourg, Netherlands, Portugal and Spain5, formed a monetary union. Since then, the exchange rates between the EMU countries have been irrevocably fixed, the euro was introduced as the common currency, the European Central Bank (ECB) began operating, and carrying out the common monetary policy, and all EMU government bills and bonds are denominated in euro. The EMU markets have embarked on a series of reforms in recent years, following an economic, stock market, interest rate and bond market convergence process. Therefore, the interdependence with the largest economy in EMU, Germany, is highest.
4.2 Post - Crisis period: 9 August 2007
–
April 2009.
The own volatility effects of all Spanish market is highest among all five markets under examination, followed by Germany, Italy, Portugal and Greece. Moreover, in
5
post-crisis period in all markets the values of own volatility coefficients are higher than in pre-crisis period, indicating increasing level of volatility during periods of crises.
For the cross volatility spillover effects, we observe that the link between cross lagged product of innovations and corresponding cross conditional covariances are higher than in pre-crisis period and the strongest pair is Spain-
i
,i
2,...,5
. Furthermore, these results show a high level of interdependence between Spain and the other four markets. These results affirm the fact that the volatility and spillover effects increasing during turmoil periods.5. Conclusions
This work investigates the transmission of volatility among four Mediterranean markets during the period 1996 to 2009 i.e. including the recent financial crisis. A multivariate generalised autoregressive conditional heteroskedasticity model is estimated to identify the source and magnitude of spillovers.
The results generally indicate the presence of statistically significant own and cross volatility spillovers between all under examination markets. Before the global crisis begins, the largest impact in Mediterranean markets had the Germany market, followed by Spain, Italy, Greece and Portugal. After 9 August 2007, the interdependence among all markets increased indicating the increasing level of integration during periods of crisis. However, during the period of crisis, Spain had the higher spillover effects between the other markets, followed by Germany, Italy, Portugal and Greece. It is worth to mention the positive sign found in the spillover coefficients in all markets suggesting that the volatility of their own and cross stock returns has a positive cluster effect on own or other markets (Caporale, Pittis and Spagnolo; 2000).
As a result, both private and institutional investors and should adjust their trading strategies and asset allocation decisions according to the spillover effects mention above, since they probably have chance to hedge their investments and get profits by investing into multinational equity markets, even during the turmoil periods.
References
…
Adrangi, B.- Chatrath A, Raffiee K. (1999), ‘Volatility characteristics and persistence in Latin American emerging markets’, International Journal of Business,
4: 19–37.
Aggarwal, R. - Inclan C, Leal R. (1999), ‘Volatility in emerging stock markets’, Journal of Financial and Quantitative Analysis, 34: 33–55.
Baig, T. - Goldfajn, I. (1998), ‘Financial Market Contagion in the Asian Crisis’, International Monetary Fund Working Paper, WP/98/155.
Bekaert, G. - Harvey, C.R. (1995), ‘Time-varying world market integration’, Journal of Finance, 50, 403–444.
Bekaert, G. –Harvey, CR. (1997), ‘Emerging equity market volatility’ Journal of Financial Economics, 43: 29–77.
Bera, AK. - Higgins, ML. (1993), ‘ARCH models: properties, estimation and testing’,Journal of Economic Surveys 7: 305–366.
Bollerslev, T. – Chou, RY. – Kroner, KF. (1992), ‘ARCH modeling in finance: a review of the theory and empirical evidence’,Journal of Econometrics 52: 5–59.
Bollerslev, T. – Engle, R.F. –Wooldridge, Jeffry. (1988), ‘A capital asset pricing model with time-varying covariances’, Journal of Political Economy, University of Chicago Press,96: 116-131.
Bollerslev, T. (1990), ‘Modelling the coherence in short-run nominal exchange rates: a multivariate generalized ARCH model’, Review of Economics and Statistics
73: 498–505.
Dunne, PG. (1999), ‘Size and book-to market factors in a multivariate GARCH-in-mean asset pricing application’,International Review of Financial Analysis 8: 35–52.
Engle, RF. – Kroner, KF. (1995), ‘Multivariate simultaneous generalized ARCH’, Econometric Theory 11: 122–150.
Erb, C.B. - Harvey, C.R. and Viskanta, T.E. (1996), ‘Expected returns and volatility in 135 countries’,Journal of Portfolio Management 22: 46–58.
Gallagher LA, - Twomey CE. (1998), ‘Identifying the source of mean and volatility spillovers in Irish equities: a multivariate GARCH analysis’,Economic and Social Review 29: 341–356.
Guglielmo, M., Caporale, - Nikitas, Pittis, - Nicola, Spagnolo. (2006), ‘Volatility transmission and financial crises’, Journal of Economics and Finance, 30: 376-390.
Karolyi GA. (1995), ‘A multivariate GARCH model of international transmissions of stock returns and volatility: the case of the United States and Canada’,Journal of Business and Economic Statistics 13: 11–25.
Kearney, C. - Patton, AJ. (2000), ‘Multivariate GARCH modeling of exchange rate volatility transmission in the European monetary system’Financial Review 41: 29–48.
Markus, K., Brunnermeir. (2009), ‘Deciphering the liquidity and credit crunch 2007-2008’, American Economic Association23: 77-100.
Meric, I. – Meric, G. (1997), ‘Co-movements of European equity markets before and after the 1987 Crash’, Multinational Finance Journal 1: 137–152.
Pagan, A. (1996), ‘The econometrics of financial markets’Journal of Finance 3: 15–102.
Ramchand, L. - Susmel, R. (1998), ‘Volatility and cross correlation across major stock markets’,Journal of Empirical Finance 5: 397–416.
Roca, ED. (1999), ‘Short-term and long-term price linkages between the equity markets of Australia and its major trading partners’, Applied Financial Economics 9: 501–511.
Scheicher, M. (2001), ‘The comovements of stock markets in Hungary, Poland and the Czech Republic’,International Journal of Finance and Economics 6: 27–39.
Stephen, G. Cecchetti, (2009), ‘Crisis and responses: The federal reserve in early stages of financial crisis’, Journal of American Perspectives, American Economic Association,23: 51-75.
Tse, YK. (2000), ‘A test for constant correlations in a multivariate GARCH model’, Journal of Econometrics 98:107–127.
Viral, V. Acharya – Phillip, Schnabl. (2010), ‘Do global banks spread global imbalances? The case of asset-backed commercial paper during financial crisis of 2007-2009’, National Bureau of Economic research, inc, NBER Working Papers: 16079
Table 1. Summary statistics of daily returns for five European markets
Germany Greece Italy Portugal Spain
Mean -0.000163 0.000228 0.000259 -0.000205 0.002773
Median 0.000386 0.000236 7.20E-05 0.000176 0.002290
Maximun 0.162482 0.116667 0.112428 0.100705 0.096859 Minimum -0.086407 0.111356 0.109208 -0.128441 0.098112
Std. Dev. 0.014310 0.016965 0.014274 0.012144 0.013654 Skewness 0.355349 0.204495 0.092447 -0.250166 0.068239
Kurtosis 13.53598 7.974385 11.50797 15.20986 10.80989
Jarque- Bera 12675.20*** 2831.639*** 8231.716*** 16973.96*** 6935.153***
Probability 0.000000 0.000000 0.000000 0.000000 0.000000
Table 2. Estimated coefficients for variance covariance equations before the Financial Crisis
Spain (i=1)
Portugal (i=2)
Italy (i=3)
Greece (i=4)
Germany (i=5) Coefficient Prob. Coefficient Prob. Coefficient Prob. Coefficient Prob. Coefficient Prob.
M(i,1) 1.69E-07 0.0040 - - - -
M(i,2) 1.33E-07 0.0014 1.05E-07 0.0039 - - - -
M(i,3) 2.80E-07 0.0005 2.21E-07 0.0002 4.66E-07 0.0000 - - - -
M(i,4) 1.44E-07 0.0036 1.14E-07 0.0032 2.40E-07 0.0008 1.23E-07 0.0246 - -
M(i,5) 2.20E-07 0.0013 1.74E-07 0.0003 3.66E-07 0.0001 1.88E-07 0.0017 2.88E-07 0.0012
A1(i,1) 0.025672 0.0000 - - - -
A1(i,2) 0.019848 0.0000 0.015346 0.0000 - - - - A1(i,3) 0.025582 0.0000 0.019779 0.0000 0.025493 0.0000 - - - - A1(i,4) 0.023232 0.0000 0.017962 0.0000 0.023151 0.0000 0.021025 0.0000 - - A1(i,5) 0.029130 0.0000 0.022522 0.0000 0.029028 0.0000 0.026362 0.0000 0.033053 0.0000
B1(i,1) 0.974943 0.0000 - - - -
B1(i,2) 0.979281 0.0000 0.983638 0.0000 - - - - B1(i,3) 0.973052 0.0000 0.977382 0.0000 0.971165 0.0000 - - - - B1(i,4) 0.977012 0.0000 0.981359 0.0000 0.975117 0.0000 0.979085 0.0000 - - B1(i,5) 0.971142 0.0000 0.975463 0.0000 0.969259 0.0000 0.973203 0.0000 0.967357 0.0000
Table 3. Estimated coefficients for variance covariance equations after and during the Financial Crisis
Spain (i=1)
Portugal (i=2)
Italy (i=3)
Greece (i=4)
Germany (i=5) Coefficient Prob. Coefficient Prob. Coefficient Prob. Coefficient Prob. Coefficient Prob.
M(i,1) 9.54E-07 0.0156 - - - -
M(i,2) 1.39E-06 0.0014 2.04E-06 0.0001 - - - - M(i,3) 7.22E-07 0.0232 1.06E-06 0.0041 5.47E-07 0.0412 - - - - M(i,4) 4.21E-07 0.0482 6.16E-07 0.0235 3.19E-07 0.0660 1.86E-07 0.1575 - - M(i,5) 7.52E-07 0.0226 1.10E-06 0.0039 5.69E-07 0.0358 3.32E-07 0.0601 5.93E-07 0.0417
A1(i,1) 0.056527*** 0.0000 - - - -
A1(i,2) 0.043409*** 0.0000 0.033336 0.0000 - - - - A1(i,3) 0.052762*** 0.0000 0.040519 0.0000 0.049249 0.0000 - - - - A1(i,4) 0.037783*** 0.0000 0.029015 0.0000 0.035267 0.0000 0.025254 0.0000 - - A1(i,5) 0.055576*** 0.0000 0.042680 0.0000 0.051875 0.0000 0.037148 0.0000 0.054642 0.0000
B1(i,1) 0.953197*** 0.0000 - - - -
B1(i,2) 0.957771*** 0.0000 0.962367 0.0000 - - - - B1(i,3) 0.956476*** 0.0000 0.961066 0.0000 0.959768 0.0000 - - - - B1(i,4) 0.965673*** 0.0000 0.970307 0.0000 0.968996 0.0000 0.978313 0.0000 - - B1(i,5) 0.954084*** 0.0000 0.958662 0.0000 0.957367 0.0000 0.966572 0.0000 0.954972 -
Figure 1. European markets daily returns, June 1994 to June 2009
-.10 -.05 .00 .05 .10
1500 2000 2500 3000 3500 Spain
-.15 -.10 -.05 .00 .05 .10 .15
1500 2000 2500 3000 3500 Portugal
-.12 -.08 -.04 .00 .04 .08 .12
1500 2000 2500 3000 3500 Italy
-.12 -.08 -.04 .00 .04 .08 .12
1500 2000 2500 3000 3500 Greec e
-.10 -.05 .00 .05 .10 .15 .20