Munich Personal RePEc Archive
The Defense-growth nexus: An
application for the Israeli-Arab conflict
Abu-Qarn, Aamer
Ben Gurion University of the Negev
2010
Online at
https://mpra.ub.uni-muenchen.de/22275/
1
THE DEFENCE-GROWTH NEXUS REVISITED:
EVIDENCE FROM THE ISRAELI-ARAB CONFLICT
Aamer S. Abu-Qarn
Economics Department, Ben-Gurion University of the Negev P.O. Box 653, Beer-Sheva 84105, Israel
Email: aamer@bgu.ac.il
Abstract
This paper revisits the defence-growth nexus for the rivals of the Israeli-Arab conflict over the last four decades. To this end, we utilize the Toda and Yamamoto (1995) causality test and the generalized variance decomposition. Contrary to the conventional wisdom and many earlier studies, we fail to detect any persistent adverse impact of military expenditures on economic growth. Our conclusions are kept intact even when we account for the possibility of endogenous structural breaks and during the post-1979 peace treaty period. Our findings imply insignificant peace dividends once the conflict is resolved and the military spending is cut to internationally acceptable standards.
Keywords: Growth, Middle East, Israeli-Arab conflict, Causality, Generalized Forecast Error Variance Decomposition
2
INTRODUCTION
Economists have long debated how military spending affects economic growth and
whether causality runs from defence to growth or vice versa. On one hand, causality,
whether negatively or positively, can run from defence to economic growth; military
spending, as other government expenditures, may impede economic growth by
crowding-out private investment. Moreover, higher military spending results in distorted resource
allocations, and the diversion of resources from productive activities to accumulation of
armaments and maintenance of military forces. However, in his seminal work, Benoit
(1978) asserted that for Least Developed Countries (LDCs), only a small portion of the
decrease in military spending, if any at all, is channelled to productive investment.
Therefore, reducing military spending will not necessarily enhance economic growth. He
further asserted that in LDCs, military spending would have a positive impact on growth
via contributing to the civilian economy indirectly by enhancing accumulation of human
capital. Additionally, military forces also engage in certain R&D and production activities
that spill over to benefit the civilian sectors. Military spending can also affect economic
growth positively through the expansion of aggregate demand (the Keynesian effect). The
resulting increased demand leads to increased utilization of otherwise idle capital, higher
employment and profits, and therefore higher investment.
One the other hand, causality can, as well, run on the opposite direction from
economic growth to defence. In contrast to Benoit, Joerding (1986) claimed that a growing
country may want to strengthen itself against foreign or domestic threats by increasing its
military spending. Alternatively, a growing economy may choose to divert resources from
the military sector to more productive sectors to further enhance growth.
Only a few studies have addressed the relationship between defence and economic
Israeli-3
Arab conflict, in particular. Most of these studies implicitly assumed a causality running
from defence spending to economic growth despite the fact that the opposite direction is
theoretically plausible as well. The most common approaches to assess the defence growth
relationship are the growth regressions and Granger causality tests.1 The findings of the
previous studies are inconclusive and vary depending on the countries examined, samples,
and econometric methods.
Traditional Granger causality tests that gained popularity in the last two decades
have been shown to have non-standard asymptotic properties if the variables are integrated
or cointegrated. Moreover, the need for pre-tests for unit roots and cointegration and the
inapplicability when the variables have different orders of integration further add to the
distortions associated with Granger causality from within VAR or vector error correction
(VEC) settings.
Unlike other studies that have used the traditional Granger causality test or
causality from within a VEC, we utilize a causality procedure suggested by Toda and
Yamamoto (1995) to examine the causal relationship between defence and economic
growth. Their procedure requires the estimation of an augmented VAR that guarantees the
asymptotic distribution of the Wald statistic. Also, the procedure does not require
pre-testing for integration or cointegration properties of the VAR system, and thus avoids the
potential biases of pre-testing. Our study takes into account the likely structural breaks in
the series by testing for multiple breaks utilizing the Bai and Perron (2003) test. Moreover,
we analyze the causal relationship between defence and growth after signing the peace
treaty between Egypt and Israel in 1979 to assess whether a significant change in this
relationship has occurred.
In addition to using the Toda and Yamamoto (1995), we examine the out-of-sample
4
and Shin (1998). Unlike the traditional orthogonalized Cholesky method, this method does
not require ordering of the variables in the VAR system, something that is often
determined arbitrary given the absence of sound theoretical base.
The outline of this paper is as follows. The next section provides an overview of the
literature dealing with the defence-growth nexus for Middle Eastern countries and it is
followed by an exposition of the theoretical econometric foundations. The fourth section
presents the data resources and definitions. Our results of the causality tests are presented
in the fifth section and the last section concludes.
PREVIOUS STUDIES
As we mentioned earlier, only few studies have addressed the relationship between
military expenditures and economic growth for the Middle Eastern countries, in general,
and for the four rivals of the Israeli-Arab conflict, in particular. These studies provide
mixed evidence, although the hypothesis of defence spending slowing economic
performance is the dominant one.
In an early paper, Lebovic and Ishaq (1987) use a three-equation model employing
panel data techniques for 20 Middle Eastern economies over the period 1973-1982. They
find that military spending impedes economic growth for various groups of countries and
for different alternative measures of military burden. These conclusions are shared by
Linden (1992) who used an augmented two-sector growth model to study the effect of
military burden on growth for a panel of 13 Middle East countries from 1973 to 1985
applying generalized least squares. Opposite findings are reported by Cohen and Ward
(1996) who estimate a single equation model that relates growth to investments, military
and non-military government spending, and population growth. They find that the benefits
5
period. Thus, they confirm the existence of a Keynesian effect that is roughly equivalent
for both military and non-military government expenditures.
Mixed results were reported by DeRouen (1995) who examine the military
expenditures of Israel, Egypt, Jordan, and Syria for the period 1953-88. He suggests that
Egypt and Syria would realize the dividends from slashing their military spending only if
they increase allocations to non-defence government spending. As to Israel, he asserts that
defence cuts alone may actually deter growth in the short run. Furthermore, he finds that
military spending had a negative effect on growth after 1967 coupled with positive military
externalities on civilian output. Surprisingly, DeRouen (1995) finds that the defence sector
in Jordan is very productive and therefore defence cuts would not lead to higher growth.
Diverting from the traditional practices, Abu-Bader and Abu-Qarn (2003) apply
causality tests from within a VEC setting and Cholesky variance decomposition to uncover
the direction of causality between defence and growth for Egypt, Israel, and Syria. They
find that in a trivariate setting (government civilian expenditure, military spending, and
growth) there is evidence for bidirectional causality and that military burden negatively
affects economic growth for all countries whereas civilian government expenditures
positively affect growth in Egypt and Israel.
A recent study by Yildirim et al. (2005) covering 13 Middle Eastern countries and
applying dynamic panel data provides support for Benoit (1978). The authors find that
military expenditures enhance economic growth in the Middle East.
Several studies have focused on the defence-growth nexus in Israel. Cohen et al.
(1996) tackled the relationship by emphasizing the indirect linkages via investment and
labour. They estimate a dynamic three-equation (investment, labour, and growth) model
for the period 1960-1992 and conclude that the benefits for Israel from cutting military
6
through investments. The indirect positive impact through investments was portrayed as
well by Looney and Winterford (1995) for the period 1955-1987. They assert that they
found no support for negative effect of high military burden on the Israeli economy mainly
due to the American assistance. Evidence of non-linearity in the defence-growth
relationship is reported by Bichler and Nitzan (1996). They claim that throughout the
1950s and most of the 1960s defence spending had a positive effect on growth through
accumulation of human capital and smoother assimilation of new immigrants. However,
since the late 1960, the large defence budgets led to higher debt and slower growth.
DeRouen (2000) further analyzed the effects of military and no-military government
spending on economic growth of Israel in a three-sector production function model for the
years 1953-1992. His nonlinear least squares estimates suggest that when controlling for
technological growth, short-term increases in defence spending hinder economic growth
whereas non-defence spending have the opposite effect. Based on his findings, he
recommends using saved resources from cutting military spending in the peace era for
infrastructure and private investments.
ECONOMETRIC METHODOLOGIES
Economists often utilize vector autoregressions (VARs) to make inferences on
causal relationships among endogenous variables. However Sims et al. (1990) and others
have argued that, in general, the traditional Wald test for exact linear restrictions on the
parameters in levels VAR does not have the usual asymptotic distributions if the variables
are integrated or cointegrated. Proper inferences on VAR levels can be made only if all
variables are known to be stationary. Otherwise, one can use VAR in differences if all
variables are known to be integrated of order one but not cointegrated, and through the
specification of a VEC model if all variables are I(1) and cointegrated. However, in most
7
roots and cointegration is necessary before conducting causality tests. Consequently, the
validity of causality tests is conditional on avoiding biases in testing for unit roots and
cointegration among the variables. Econometric studies report that the pre-testing biases
might be severe because the power of the unit root test is generally very low and tests for
Johansen cointegration are not very reliable in finite samples.2
A recent procedure proposed by Toda and Yamamoto (1995) bypasses the need for
potentially biased pre-tests for unit roots and cointegration, common to other formulations.
The procedure utilizes the Wald test statistic for testing linear restrictions on the
coefficients in an augmented VAR. The Modified WALD (MWALD) causality test has an
asymptotic chi-squared distribution with p degrees of freedom in the limit when a VAR
(p+dmax) is estimated, where p is the optimal lag order in the unrestricted levels VAR and
dmax is the maximal order of integration of the variables in the VAR system. The causality
procedure is implemented in two steps. In the first step, the correct order of the unrestricted
level VAR (p) is to be determined using one of the information criteria methods, and dmax
is to be determined using one of the unit root tests. The selected VAR(p)is then augmented
by the maximal order of integration and a VAR of order (p+dmax) is estimated. Testing
for causality in a bivariate system entails estimating the following augmented VAR of
order (p+dmax):
t d p k k t k d p k k t k t t d p k k t k d p k k t k t Y Y Y Y Y Y 1 1 2 , 22 1 1 , 21 2 2 1 1 2 , 12 1 1 , 11 1 1 max max max max ε β β ε β β + + + = + + + =
∑
∑
∑
∑
+ = − + = − + = − + = − (1)In the above setting, long-run Granger causality from variable Y2 to variable Y1 is evaluated
by testing the null hypothesis thatβ12,1 =...=β12,p =0, and causality from variable Y1 to Y2
8
(1995) proved that the Wald statistic for testing the above null hypothesis converges in
distribution to a χ2p random variable. The application of this procedure ensures that the
usual test statistic for Granger causality has the standard asymptotic distribution and valid
inference can be carried out.3
FEVD has been used repetitively by economists to examine the out-of-sample
properties of the relationship between the variables in a VAR system. The method enables
researchers to shed light not only on the direction but also on the intensity of the causal
relationships between variables. Generally speaking, FEVD analysis decomposes the
forecast error variance of a variable into proportions attributed to shocks in other variables,
as well as its own. Most researchers have used the Cholesky decomposition that requires
ordering of the variables. Without a sound theoretical base, ordering is arbitrary and the
results may vary greatly depending on the ordering. As an alternative, Pesaran and Shin
(1998) proposed a generalized FEVD that circumvent the need for ordering the variables
and produce unique results by utilizing the contemporaneous correlations of the variables
under investigation. Unlike the Cholesky decomposition, the generalized FEVD does not
impose the restriction that the underlying shocks to the VAR are orthogonalized prior to
decomposing the forecast error variances.
DATA DESCRIPTION AND SOURCES
Raw data were obtained from the following two main sources. (1) Real military
expenditures in 2003 constant prices in US dollars as well as the share of military
expenditures in GDP for the years 1988-2004 which were obtained from the SIPRI online
database available at http://www.sipri.org. (2) Real military expenditures in 1993 constant
prices in US dollars and the share of military expenditures in GNP for the period
1963-1987 which were obtained from a database compiled by Beenstock (1998). For the years
9
Development Indicators (WDI) online database (http://devdata.worldbank.org/dataonline),
with the exception of Jordan for which the growth rates were taken from the PWT database
available at http://pwt.econ.upenn.edu. Military expenditures were converted to real 2000
prices US dollars using the GDP deflator and the GNP/GDP ratio series from the WDI
online database. The final product consists of military expenditures in US dollars at 2000
constant prices and the military burden proxied by the share of military expenditures in
GDP.
In addition to the three Arab countries that constitute the major front line rivals of
Israel, we constructed an aggregated Arab measure for the military expenditures, military
burden and GDP. This measure is intended to assess the defence-growth nexus for the
Arab bloc as whole.
RESULTS
In order to apply the Toda and Yamamoto (1995) we tested for the maximal order
of integration of the variables in the VAR system using the Augmented Dickey-Fuller
(ADF) unit root test. The results that are presented in Table 1 show that most of the series
are integrated of order 1 with the exception of the GDP series of Egypt and the aggregated
Arab GDP series. Thus, the maximal of integration (dmax) is one for Israel, Jordan, and
Syria and Two for Egypt and Arab and the VAR systems would be augmented
accordingly.
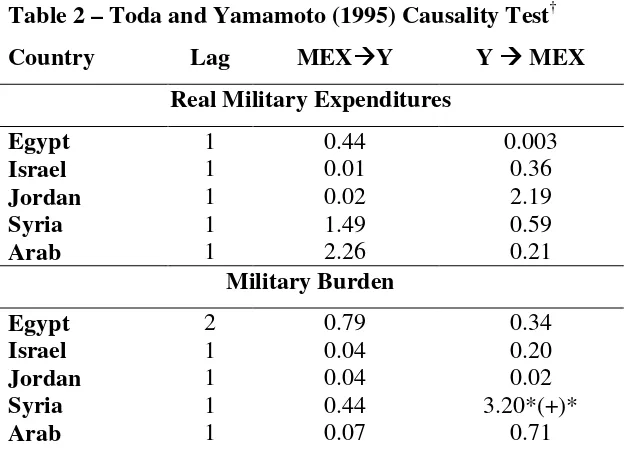
Our results of the Toda and Yamamoto (1998) causality tests are presented in Table
2. We conduct the test for two military measures; real military expenditures and military
burden which is defined as the share of military expenditures in GDP. A quick look reveals
the absence of any causal relationships between both military measures and growth. The
only exception is a barely significant positive causality running from growth to military
10
GDP to military expenditures. Thus, in contrast to the widely documented negative impact
of military expenditures on growth, we fail to detect any causality.
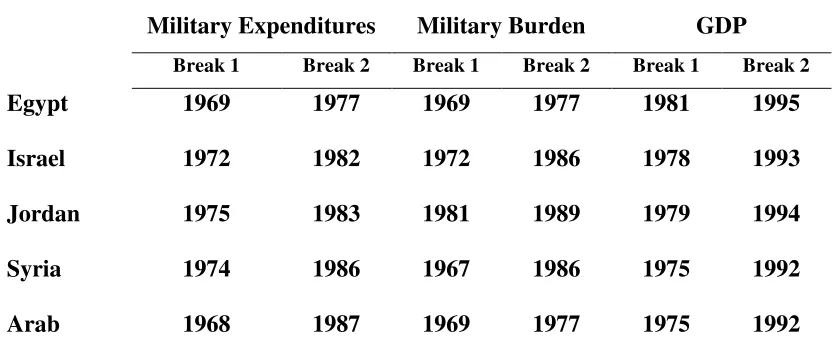
To further examine whether our results are driven by structural breaks in the series
we conduct the Bai and Perron (2003) multiple structural breaks test for all series. The
results, presented in Table 3, show the presence of varied significant structural breaks for
the military and GDP series. Generally speaking, the breaks in the military series
correspond to higher military expenditures in the late 1960s and the early 1970s, the period
between the major wars of 1967 and 1973, and a drastic decline following the initiation of
the peace talks between Egypt and Israel in the late 1970s. Incorporating structural breaks
into out tests yields few changes to the results that omitted such breaks. The results that are
presented in Table 4 show that when we take the real military expenditures as our defence
measure we find a positive unidirectional causality running from military expenditures to
economic growth for Syria (significant only at the 10% level) and for the Arab aggregate
(significant at 5%). No causal relationships were detected for Egypt, Israel, and Jordan. In
contrast to the widely documented adverse impact of military expenditures on economic
growth, we find either weak positive impact or no causality.
The peace treaty between Egypt and Israel in 1979 marked a drastic change in the
dynamics of the Israel-Arab conflict. Egypt, the largest and most dominant member of the
Arab front against Israel ceased to play a major role in the conflict and even in the Arab
and Muslim world. Additionally, the volume of military expenditures, not only of Egypt
and Israel, but also Jordan and Syria dropped sharply. In order to assess whether this event
has led to a change in the relationship under investigation, we conducted the same
causality test for the four countries after 1979. Doing so, the number of observations per
country dropped from 45 to 25 and the power of our tests is affected. Thus, we should
11
presents the results of the causality tests after 1979 and reveals a totally different picture of
the nature of the defence-growth relationship with mixed evidence. We find several cases
in which military spending impedes growth (Jordan, and Arab when taking real military
spending and Jordan, Syria, and Arab for military burden), however, the negative impact is
usually insignificant. We also detect that military spending of Egypt fosters growth
although it is barely significant. The reversed direction of causality is present in our results
as well. Increased output leads to a lower military spending for Syria but higher overall
spending of the Arab countries. As we have stated, these results have to be interpreted
cautiously due to the low power of the test and marginal significance of the sign of
causality.
Another tool that can help us gauge the direction and strength, but not the sign, of
the out-of-sample causality is the forecast error variance decomposition. The results of the
Generalized FEVD are portrayed in Tables 6 and 7. These results clearly show that own
shocks explain most of the forecast error variance of the variables while shocks to other
variables only marginally help explain the forecast error variance. The results indicate the
possibility of a weak bidirectional causality for Jordan and Syria when using the real
military spending as the measure for defence since each variable explains about 11% of the
forecast error variance of the other variable. Overall, the Generalized FEVD results verify
the results of our Toda and Yamamoto (1995) causality tests; we find very weak or
nonexistent causal relationship between the defence spending and economic growth.
SUMMARY AND CONCLUSIONS
This paper investigates the causal relationship between military spending and
economic growth for the four rivals of the Israeli-Arab conflict over the 1960-2004 period
12
FEVD suggested by Pesaran and Shin (1998). We conduct our analysis for two measures
of military; real military spending and military burden.
Overall, we find weak or nonexistent causal relationship between defence and
economic growth and fail to provide support for the conventional wisdom of adverse
impact of military spending on economic growth. The causality analysis was conducted
also with incorporating the likely structural breaks of the variables that were endogenously
determined using the Bai and Perron (2003) multiple breaks test. However, our conclusions
were not altered. Mixed results, mostly insignificant, were found when we addressed the
post-1979 period, but due to the short time period one should expect the power of our
causality tests to be relatively low. When examining the out-of-sample causality using the
Generalized FEVD we found very weak causal relationship between defence and growth.
The lack of causal relationships between military spending and growth, in general,
and the absence of adverse impact of military spending on the economic performance of
the countries, in particular, cast serious doubts on the size of benefits that the involved
countries would gain once they cut their military spending to internationally prevalent
levels. Our results imply that these countries are not expected to harvest substantial
dividends once a sustained peace has been achieved, however, one has to consider not only
the pure economic costs/benefits of the conflict, but all the other aspects of life that would
13
Notes
1
See Dunne et al., 2005 for a critical review of the models used to examine the defence-growth relationship.
2
See Toda and Yamamoto (1995) and Pesaran et al. (2001).
3
14
References
Abu-Bader, S. and Abu-Qarn A. (2003) Government Expenditures, Military Spending and
Economic Growth: Causality Evidence from Egypt, Israel, and Syria. Journal of
Policy Modeling 25 567-583.
Bai, J. and Perron P. (2003) Computation and Analysis of Multiple Structural Change
Models. Journal of Applied Econometrics 18(1) 1-22.
Beenstock, M. (1998) Country Survey XI: Defence and the Israeli Economy. Defence and
Peace Economics 9 171-222.
Benoit, E. (1978) Growth and Defence in Developing Countries. Economic Development
and Cultural Change26 271-80.
Bichler, S. and Nitzan J. (1996) Military Spending and Differential Accumulation: A New
Approach to the Political Economy of Armament--the Case of Israel. Review of
Radical Political Economics28 51-95.
Cohen, J.S. and Ward M.D. (1996) Towards a Peace Dividend in the Middle East: The
New Dynamics of Military Spending," in The Peace Dividend, edited by N.P.
Gleditsch et al. Amsterdam, New York and Oxford: Elsevier, North-Holland,
425-37.
Cohen, J.S., Stevenson R.T., Mintz A. and Ward M.D. (1996) Defense Expenditures and
Economic Growth in Israel: The Indirect Link. Journal of Peace Research33
341-352.
DeRouen, K., Jr (1995) Arab-Israeli Defense Spending and Economic Growth. Conflict
Management and Peace Science14 25-47.
DeRouen, K., Jr (2000) The Guns-Growth Relationship in Israel. Journal of Peace
15
Dunne, J.P., Smith R. and Willenbockel D. (2005) Models of Military Expenditure and
Growth: A Critical Review. Defence and Peace Economics16 449-461.
Joerding, W. (1986) Economic Growth and Defense Spending: Granger Causality. Journal
of Development Economics21 35-40.
Lebovic, J.H. and Ishaq A. (1987) Military Burden, Security Needs, and Economic Growth
in the Middle East. Journal of Conflict Resolution31 106-138.
Linden, M. (1992) Military Expenditures, Government Size and Economic Growth in the
Middle East in the Period 1973-85. Journal of Peace Research29 265-270.
Looney, R. and Winterford D. (1995) Economic Causes and Consequences of Defense
Expenditures in the Middle East and South Asia. Boulder, CO: Westview Press.
Pesaran, M.H. and Shin Y. (1998) Generalized Impulse Response Analysis in Linear
Multivariate Models. Economics Letters 58 17-29.
Pesaran, M.H., Y. Shin and R.J. Smith (2001) Bounds Testing Approaches to the Analysis
of Level Relationships. Journal of Applied Econometrics16 289-326.
Sims, C. A., Stock J.H. and Watson M.W. (1990) Inference in Linear Time Series Models
with Some Unit Roots. Econometrica58 113-44.
Toda, H. and Yamamoto T. (1995) Statistical Inference in Vector Autoregressions with
Possibly Integrated Processes. Journal of Econometrics66 225-250.
Yildirim, J., Sezgin S. and Ocal N. (2005) Military Expenditure and Economic Growth in
Middle Eastern Countries: A Dynamic Panel Data Analysis. Defence and Peace
Economics16 283-295.
Zapata, H. and Rambaldi A. (1997) Monte Carlo Evidence on Cointegration and
Table 1 - ADF Unit Root Test
Real Military Expenditures
Levels First differences
ADF Lag ADF lag
Egypt -2.83 3 -5.09*** 0
Israel -1.96 0 -7.85*** 0
Jordan -2.38 0 -7.65*** 0
Syria -1.32 0 -5.04*** 0
Arab -2.41 2 -3.04** 1
Military Burden
Egypt -2.66 2 -3.03** 1
Israel -1.83 0 -8.30*** 0
Jordan -2.33 0 -6.07*** 1
Syria -1.70 0 -7.96*** 0
Arab -2.71 2 -4.40*** 0
GDP
Egypt -0.47 1 -2.40† 0
Israel -1.03 0 -4.30*** 0
Jordan -1.85 2 -3.31** 2
Syria -1.86 0 -6.77*** 0
Arab -0.14 0 -1.34† 1
Notes:
Optimal lag length based on SIC with 8 maximum lags allowed. † The series is I(2).
Table 2 – Toda and Yamamoto (1995) Causality Test†
Country Lag MEX Y Y MEX
Real Military Expenditures
Egypt 1 0.44 0.003
Israel 1 0.01 0.36
Jordan 1 0.02 2.19
Syria 1 1.49 0.59
Arab 1 2.26 0.21
Military Burden
Egypt 2 0.79 0.34
Israel 1 0.04 0.20
Jordan 1 0.04 0.02
Syria 1 0.44 3.20*(+)*
Arab 1 0.07 0.71
Notes: † F test.
indicates the direction of causality.
Table 3 - Bai and Perron (2003) Test of Multiple Break Points
Military Expenditures Military Burden GDP
Break 1 Break 2 Break 1 Break 2 Break 1 Break 2
Egypt 1969 1977 1969 1977 1981 1995
Israel 1972 1982 1972 1986 1978 1993
Jordan 1975 1983 1981 1989 1979 1994
Syria 1974 1986 1967 1986 1975 1992
Arab 1968 1987 1969 1977 1975 1992
Notes:
Table 4 – Toda and Yamamoto (1995) Causality Test: With Structural Breaks†
Country Lag MEX Y Y MEX
Real Military Expenditures
Egypt 1 1.82 0.48
Israel 1 0.04 0.01
Jordan 1 0.59 0.38
Syria 2 4.57**(+)* 0.49
Arab 1 5.03**(+)** 0.35
Military Burden
Egypt 2 1.23 1.93
Israel 1 2.14 1.88
Jordan 1 0.001 0.09
Syria 1 1.46 3.69*(+)*
Arab 1 2.41 0.88
Notes: † F test.
indicates the direction of causality.
Table 5 – Toda and Yamamoto (1995) Causality Test: After 1979†
Country Lag MEX Y Y MEX
Real Military Expenditures
Egypt 1 3.95*(+)* 1.19
Israel 1 0.06 0.37
Jordan 3 5.36***(-) 1.11
Syria 4 0.54 7.35***(-)*
Arab 2 5.80**(-)** 8.88***(+)**
Military Burden
Egypt 2 0.41 2.85*(+)*
Israel 1 1.98 1.52
Jordan 2 6.53***(-) 0.87
Syria 2 3.48*(-) 0.27
Arab 3 4.60(-) 1.47
Notes: † F test.
indicates the direction of causality.
Optimal lags of the VAR are based on SIC with maximum 4 lags allowed.
Table 6 – Generalized FEVD for Military Measure (%)
Explained by own shock after … years
Explained by a shock to Y after … years
0 1 5 10 0 1 5 10
Real Military Expenditures
Egypt 100 98.95 97.17 96.98 0.83 2.22 4.14 4.33
Israel 100 99.61 99.60 99.60 1.47 2.16 2.16 2.16
Jordan 100 98.85 98.82 98.82 11.15 10.86 10.92 10.92
Syria 100 99.47 99.47 99.47 10.11 11.52 11.55 11.55
Arab 100 99.59 96.41 94.32 0.53 1.11 4.73 6.90
Military Burden
Egypt 100 9.45 98.01 97.83 1.15 2.22 3.95 4.14
Israel 100 99.92 99.92 99.92 5.41 5.80 5.79 5.79
Jordan 100 99.80 99.80 99.79 0.25 0.26 0.26 0.26
Syria 100 95.05 94.71 94.71 0.09 4.87 5.21 5.22
Table 7 – Generalized FEVD for Y (%)
Explained by own shock after … years
Explained by a shock to military measure after … years
0 1 5 10 0 1 5 10
Real Military Expenditures
Egypt 100 98.43 96.93 96.81 0.83 3.71 6.12 6.30
Israel 100 99.95 99.95 99.95 1.48 1.70 1.71 1.71
Jordan 100 99.95 99.95 99.95 11.15 10.75 10.73 10.73
Syria 100 97.58 97.56 97.56 10.11 11.47 11.52 11.52
Arab 100 96.24 94.18 94.06 0.53 3.54 7.39 7.92
Military Burden
Egypt 100 99.08 97.56 97.41 1.15 3.25 5.87 6.11
Israel 100 99.95 99.95 99.95 5.41 5.12 5.11 5.11
Jordan 100 99.63 99.63 99.63 0.25 0.33 0.33 0.33
Syria 100 99.32 99.26 99.26 0.09 0.68 0.74 0.74