ISSN Online: 2327-5960 ISSN Print: 2327-5952
Data Analysis Instance for NBA Star Shooting
Zhengyang Xie
1, Junhui Gao
2*1Jiangsu Tianyi High School, Wuxi, China
2American and European International Study Center, Wuxi, China
Abstract
In this paper, we analyze the field data of NBA star players. We choose 25 of them and download the data from the NBA official website. The data is statistically ana-lyzed from all aspects: the position of the player, the location on the court, the time order of two points and three points and the combination of these elements. We get some results according to the analysis. For example, players of all five positions pre-fer to make shots right ahead the basketry; attempts of three points reach the climax during the third quarter; over the last five minutes of the game, the rate of the num-ber of two-point attempts is the lowest and that of three-point attempts is the highest at the 46th minute.
Keywords
NBA, Ball-Game Star, Shoot, Data Analysis
1. Introduction
Data analysis has permeated into almost all fields, including sports games. It has been for a long time to use data to analyze basketball games.
Wen Wang (2014) mentioned that NBA was also the beneficiary of Age of Big Data and made plenty of money. Recently, CNN reports a person behind the scene of NBA—Kirk Goldsberry, a visiting scholar of Harvard University who is crazy about data. His heat map recording 700 thousand shots caught the attention of Sports VU, the data corporation company of NBA once it was noticed in Sloan Sports Analysis Confe-rence at MIT. Now he is an employee in this company and has finished many refresh-ing data analysis cases of NBA players [1].
Yuanyuan Gai (2014) concludes even more cases in his article [2]. One of them is the term called PER (Player Efficiency Rating) which was created by John Hollinger. PER can evaluate the performance of each player per minute. It can be used to compare the How to cite this paper: Xie, Z.Y. and Gao,
J.H. (2016) Data Analysis Instance for NBA Star Shooting. Open Journal of Social Sciences, 4, 1-8.
http://dx.doi.org/10.4236/jss.2016.49001
performances of two players, no matter how much time they play. The influence of Hollinger’s data analysis has continuously increased and the PER is also used in other sports. The second case is about Dean Oliver who was once the data analysis consultant of Seattle Supersonics and Denver Nuggets. He proposed a standard to evaluate the player which was the famous “four elements of a player”, including effective field goal percentage, turnover ratio, rebound and free throw. The third case is about Jeff Sagarin and Wayne Winston, who both graduated from MIT. They worked together and de-veloped an evaluating system called WINVAL in order to assess the influence of the players’ behavior on the court. They can choose the best starting line-ups according to all the data.
The general manager of Houston Rocket, Morley, graduated from Northwest Uni-versity and majored in computer science. He had done data analysis of the uniUni-versity players before he joined Celtics. He made a series of decisions about draft, transaction and salary cap using the data measuring system which is created by himself.
In this paper, we analyze the field data of NBA star players. We choose 25 of them and download the data from the NBA official website. The data is statistically analyzed from all aspects: the position of the player, the location on the court, the time order of two points and three points and the combination of these elements.
2. Data Collection
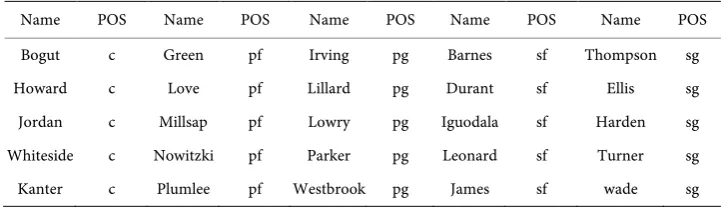
Our data comes from NBAstat [3], we choose 25 players in total, consisted of five first-tier players in each position. Their names are shown in Table 1. All the data come from season 2014-2015.
POS in Table 1 refers to position; the full names of the abbreviations are shown in Table 2. We get 24,877 records in total.
3. Data Statistics and Analysis
We do data analysis by a free-data base software called MySQL [4]. The results of data analysis are shown below.
3.1. Data Statistics and Analysis for Five Positions
[image:2.595.192.554.604.709.2]Table 3 shows the number of the shots made by these 25 players according to their po-sitions.
Table 1. 25 stars and their positions.
Table 2. Each position and code of basketball match.
POS Abbreviation Full name
1 PG Point guard
2 SG Shooting guard
3 SF Small forward
4 PF Power forward
5 C Center
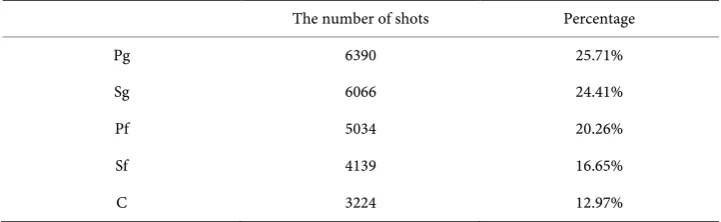
Table 3. The number of shots for five positions.
The number of shots Percentage
Pg 6390 25.71%
Sg 6066 24.41%
Pf 5034 20.26%
Sf 4139 16.65%
C 3224 12.97%
In Table 3, we can see that the percentage of the shots made by point guards is the highest which is 25.71% and that of center is the lowest which is 12.97%.
3.2. Data Statistics and Analysis of the Shooting Location
According to the basketry, we can divide the shooting locations into five different kinds: Left Side, Left Side Center, Center, Right Side and Right Side Center. Figure 1 shows the distribution shooting data of players of five positions at five kinds of loca-tions.
In Figure 1, y-axis represents the number of the shots. We can see that players of all five positions at five locations share quite similar shooting data. The number of shots made by Center is the most and there isn’t too much difference between four other po-sitions.
The distributions of shooting data of players of 3 positions at 7 locations are shown in Figure 2 with radar map. We can see that the data also shows similarities.
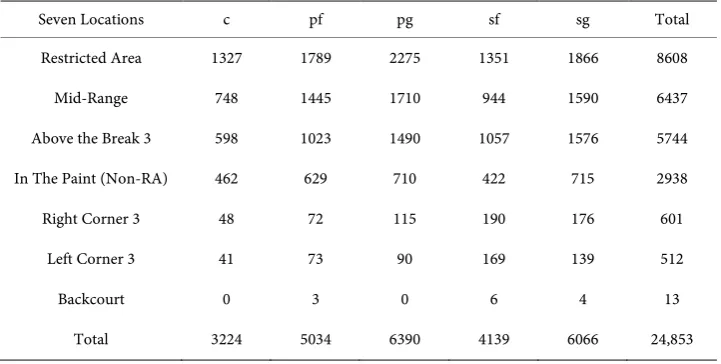
Besides that, we can also divide to locations where shots are made into 7 kinds: Re-stricted Area, Mid-Range, Above the Break 3, In The Paint (Non-RA), Right Corner 3, Left Corner 3 and Backcourt. The numbers of shots made by players of five positions at 7 locations are shown in Table 4.
3.3. Data Statistics and Analysis of the Shooting Distance
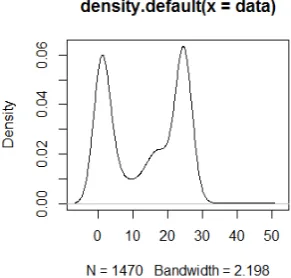
We are now studying the pattern of shooting distance. 1470 of Harden’s shooting data is made into probability density distribution, shown in Figure 3.
[image:3.595.193.554.234.345.2]Figure 1. The data distribution of five players in five positions.
Figure 2. The data distribution of three players in seven positions.
Figure 3. Probability density distribution of Harden’s shooting distance. 0
500 1000 1500 2000 2500 3000 3500 4000
Left Side(L) Left Side
Center(LC)
Center(C) Right Side
Center(RC)
Right Side(R) c
pf
pg
sf
sg
0 500 1000 1500 2000 2500
Restricted Area
Mid-Range
Above the Break 3
In The Paint (Non-RA) Right Corner 3
Left Corner 3 Backcourt
pg
sg
[image:4.595.301.447.550.689.2]Table 4. The distribution of shooting data of players of 5 positions at 7 locations.
Seven Locations c pf pg sf sg Total
Restricted Area 1327 1789 2275 1351 1866 8608
Mid-Range 748 1445 1710 944 1590 6437
Above the Break 3 598 1023 1490 1057 1576 5744
In The Paint (Non-RA) 462 629 710 422 715 2938
Right Corner 3 48 72 115 190 176 601
Left Corner 3 41 73 90 169 139 512
Backcourt 0 3 0 6 4 13
Total 3224 5034 6390 4139 6066 24,853
represents the value of density. The area between the curve and the x-axis is one. There are two climaxes in Figure 3, at 0 and 25 feet.
It’s obvious that the climax at 0 feet because players of all positions will sometimes attack the basket. Although it’s always crowded and the defense is also tough, the short- distance from the basketry can increase the hit rate by certain extent. 25 feet is where the three-point line is located. Harden is a shooting guard so he’s also a three-point shooter.
The data of other players are basically similar with that of Harden.
3.4. Data Statistics and Analysis of Scoring Method
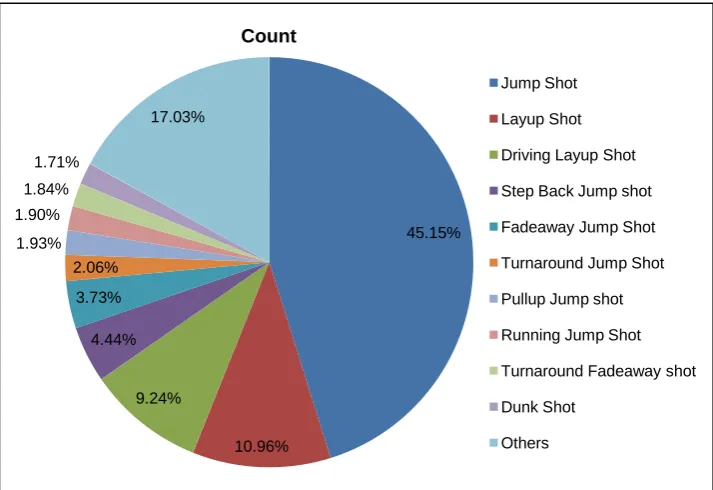
The data we collect included 47 kinds of scoring methods. According to the percentage occupied by each scoring method, the data of the number of shots is shown in Figure 4. The top 10 scoring methods are listed in Figure 4 and the rest are combined into one. The top three methods are Jump Shot, Layup Shot and Driving Layup Shot. Two-thirds of the total are consisted of them.
3.5. Analysis of the Time Order of Two-Point and Three-Point Shots
Next, let’s analyze the shooting data of two-point and three-point shots. We turn the data of three-point shots of the 25 players into a picture according to the time in the game. We show time series of three-pointer in Figure 5We show the distribution of the data of two-point and three-point shots in six quar-ters (including two quarquar-ters of overtime) in Figure 6.
We find that the attempts of two-point shots decrease as time passes and that of three-point shots reach the climax at the third quarter. After half of the game, the play-ers begin to get into the right state and to attempt three-point shots. Also, maybe the team wants to increase the advantage or decrease the disadvantage by three-point shots.
Figure 4. Percentage of shots by different means of shooting.
Figure 5. Time series of three-pointer.
Figure 6. Distribution of the data of two-point and three-point shots in six quarters. 45.15%
10.96% 9.24%
4.44% 3.73% 2.06% 1.93% 1.90% 1.84%
1.71%
17.03%
Count
Jump Shot
Layup Shot
Driving Layup Shot
Step Back Jump shot
Fadeaway Jump Shot
Turnaround Jump Shot
Pullup Jump shot
Running Jump Shot
Turnaround Fadeaway shot
Dunk Shot
Others
0 50 100 150 200 250 300 350
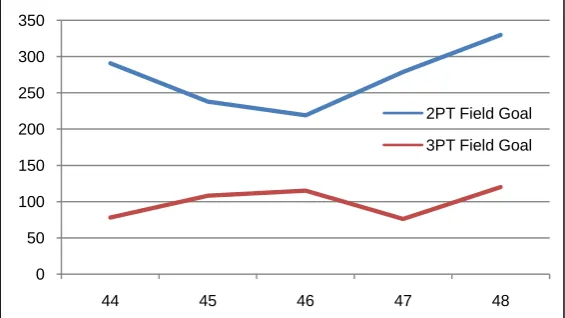
[image:6.595.230.516.534.689.2]Figure 7. Distribution of the data of two-point shots and three-point shots during the last five minutes.
We discover that the number of two-point shots is the smallest and that of three- point shots is the biggest at the 46th minute. We think that maybe it is the crucial time in a close game and there’s still possibility to cover the gap between points by successful three-point shots. As time goes by, the chance of closing the gap keeps decreasing after the 46th minute and many teams will choose to accept the result without struggling anymore.
4. Conclusion Using the Template
In this paper, we first look back at the important events of applying data to analyze the basketball matches. Then we choose 25 star players of all five positions from NBA offi-cial website and download their data (25,000 in total). Next, we analyze the data from many aspects: positions of players, time, space, etc. With respect to the positions of the players, we analyze the differences and similarities of the shooting data and find that all of them prefer to make shots right in front of the basketry. Concerning about the space, we divide the court into five and seven locations. We compare the data and use Har-den’s data to analyze the relationship between the number of shots and the distance from the basketry. It turns out that there are two climaxes at the location of the baske-try and the three-point line. In the aspect of time, we give the time order of two-point and three-point shots and their characteristics during the last five minutes of the game. It shows that the attempts of two-point shots reach the lowest and those of three-point reach the highest.
Through the study of this passage, we find some more detailed results and try to ex-plain them. We believe that with the data analysis in depth, more phenomena will be discovered and may be used in basketball training and games.
References
[1] Wang, W. (2014) Change NBA with Big Data. Xi’an Evening News.
[2] Gai, Y.Y. (2014), NBA Go into The era of Big Data. Qingdao Full Search Electronics. 0
50 100 150 200 250 300 350
44 45 46 47 48
2PT Field Goal
[3] http://www.stat-nba.com/
[4] http://www.mysql.com/
Submit or recommend next manuscript to SCIRP and we will provide best service for you:
Accepting pre-submission inquiries through Email, Facebook, LinkedIn, Twitter, etc. A wide selection of journals (inclusive of 9 subjects, more than 200 journals)
Providing 24-hour high-quality service User-friendly online submission system Fair and swift peer-review system
Efficient typesetting and proofreading procedure
Display of the result of downloads and visits, as well as the number of cited articles Maximum dissemination of your research work