ISSN Online: 1937-688X ISSN Print: 1937-6871
A More Effective Method of Extracting the
Characteristic Value of Pulse Wave Signal
Based on Wavelet Transform
Xuanwei Zhang, Yazhou Shang, Daoxin Guo, Tianxia Zhao, Qiuping Li, Xin’an Wang
The Key Laboratory of Integrated Microsystems, Peking University Shenzhen Graduate School, Shenzhen, China
Abstract
Pulse wave contains human physiological and pathological information. Different people will exhibit different characteristics, and hence determining the characteristic points of the pulse wave of human physiological health makes sense. It is common that we extract the characteristic value of pulse wave signal with the method based on wavelet transform on a small scale, and then determine the locations of the characte-ristic points by modulus maxima and modulus minima. Before determining charac-teristic value by detecting modulus maxima and modulus minima, we need to de-termine every period of the pulse wave. This paper presents a new kind of adaptive threshold determination method which is more effective. It can accurately determine every period of the pulse wave, and then extract characteristic values by modulus maxima and modulus minima in every period of the pulse wave. The method pre-sented in this paper promotes the research utilizing pulse wave on health life.
Keywords
Pulse Wave, Wavelet Transform, Adaptive Threshold, Characteristic Values
1. Introduction
The contraction-relaxation cycle in the heart makes the blood in the heart chamber en-tering the aorta in the form of waves. The waves start to propagate from the root of the aorta artery along each artery, and these waves are pulse waves [1]. The pulse wave is the external reflection of the heart and blood vessels’ important state information, and any change of our body system state will affect the pulse system. When blood flows through the body’s capillaries, the capillary blood volume begins to change because of
How to cite this paper: Zhang, X.W., Shang, Y.Z., Guo, D.X., Zhao, T.X., Li, Q.P. and Wang, X.A. (2016) A More Effective Me-thod of Extracting the Characteristic Value of Pulse Wave Signal Based on Wavelet Trans-form. J. Biomedical Science and Engineer-ing, 9, 9-19.
http://dx.doi.org/10.4236/jbise.2016.910B002
heart’s fluctuations. Because the changes of the blood volume reflect the changes of blood vessels, we use infrared photoelectric pulse sensor to record changes of blood volume, and blood volume changing over time produce pulse wave [2].
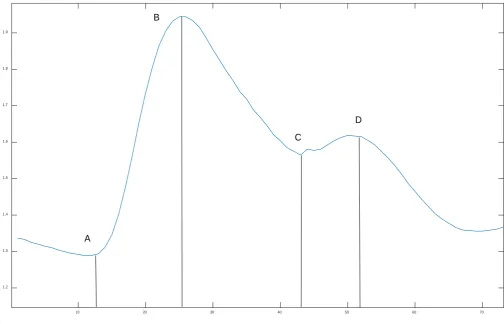
The article is about processing and analyzing the pulse waveform collected from fin-gers. The pulse waveform collected from fingers is shown in Figure 1.
In Figure 1, A and B represent main peak and main valley respectively. C and D represent the dicrotic wave peak and dicrotic valley. They are closely related to cardi-ovascular physiological information [3]. Pulse wave (main wave, tidal waves, dicrotic- wave etc.) contains a wealth of physiological information [4]. These characteristic val-ues extracted can provide much valuable diagnostic information, and then they have an important medical value [5].
There are many traditional methods to extract characteristic values. For example, Zhao Zhiqiang [6] proposed differential threshold method. He took differential opera-tions on rising and falling edges of the pulse wave signal to highlight its characteristics. Then he determined the characteristic points according to the direction of differential operators. This approach has achieved some success, but there are some limitations. It may have some false detection or missed features.
[image:2.595.45.550.371.695.2]The wavelet transform is a mathematical method developed rapidly in recent years. Its important feature of time-frequency localization analysis is that the time window
Figure 1. The pulse waveform collected from fingers.
10 20 30 40 50 60 70
1.2 1.3 1.4 1.5 1.6 1.7 1.8 1.9
A
B
C
and frequency window can be changed. Therefore, wavelet transform is adaptive. Compared to other mathematical methods, wavelet transform is very suitable for non- stationary signals such as pulse wave [7]. Although researchers have applied wavelet transform to processing and analyzing the pulse wave in recent years. Their effect is not very good. At the same time these methods do not have a universal type.
To solve these problems, this paper proposes a new approach to extract characteristic points based on wavelet transform. The method can automatically select the referenced modulus maxima and the referenced modulus maxima are accurate even if waveforms are complex. Then we can accurately extract characteristic values.
2. Pulse Wave Signal Preprocessing
Proper analysis of the pulse wave is based on the pulse wave signal containing a small amount of noise and clear waveform. However, the acquisition of the pulse wave signal is easily affected by a variety of the influence of interference, so that the pulse wave col-lected contains a lot of noise. Therefore, reducing noise is particularly necessary. Signal denoising uses the method based on wavelet transform and multi-resolution analysis. The method can characterize the local signal information in the time domain and fre-quency domain, making the effect of denoising more obvious.
2.1. Denoising Principle
After wavelet decomposition of 4 levels, noisy pulse wave signal is decomposed into high frequency detail coefficients and low frequency approximation coefficients. Signal denoising actually suppresses unwanted signal portion and retain the part of the useful signal. Based on experience, the noisy signal corresponding to the relevant part of the high-frequency detail is removed, and then the remaining part is reconstructed to ob-tain new useful signal [8].
Specific processes of signal denoising are shown in Figure 2.
2.2. Process and Results of Denoising
Pulse wave wavelet decomposition of 4 levels is showed Figure 3.
In Figure 3, d1, d2, d3, d4 are the 1st to 4th level detail coefficients of wavelet
[image:3.595.285.460.572.691.2]decom-position, a4 is the 4th level approximate coefficients. As we can see, high frequency noise
Figure 3. Pulse wave wavelet decomposition of 4 levels.
signals focus on the first layer and the second layer detail coefficients. So we suppress high frequency noise signals on the first layer and the second layer detail coefficients, and then reconstruct pulse wave signal.
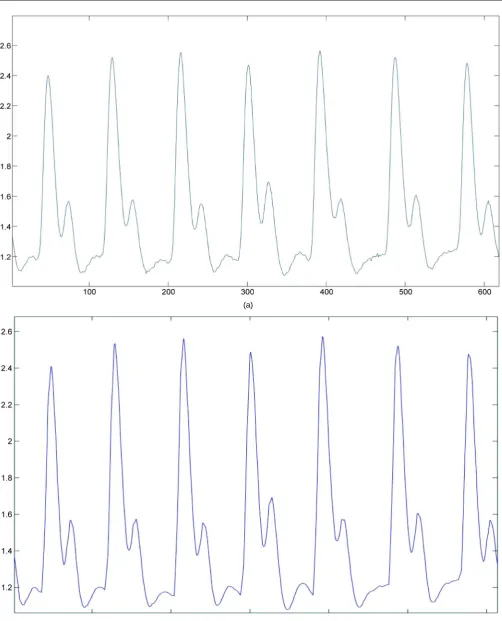
There are three denoising methods by threshold, such as Mandatory threshold de-noising, the default threshold denoising and given soft (or hard) threshold denoising. In method of Mandatory threshold denoising, the high-frequency coefficients of the wavelet decomposition structure are set to zero. This method is simple and the recon-structed signal is relatively smooth, but it is extremely easy to lose useful components of signal. In method of given soft (or hard) threshold denoising, it needs subjective expe-rience and is also very tedious and time-consuming. So in the end we choose the default threshold denoising. Its threshold generated by the system, the coefficients which is less than the threshold are set to zero, and then the remaining coefficients are taken to re-constructing signal [9]. The results of denoising results are shown in Figure 4.
3. Extracting Characteristic Values
3.1. Locating the Characteristic Points of Pulse Wave
(a)
(b)
[image:5.595.49.552.57.679.2]search for the wavelet transform modulus minima or modulus maxima within a scale or several scales. Then we connect these modulus minima or modulus maxima, the in-tersection of the straight line and the horizontal axis or locations of modulus values are locations of the characteristic points of pulse wave. Some researchers have a certain de-gree of error correction. However, these corrections cannot locate accurately characte-ristic points. The main reason is that the modulus minima or the modulus minima as reference points cannot be determined. Aiming at this problem, this paper proposes an adaptive determination threshold method. The determination of the modulus minima or the modulus minima as reference points makes further improvements through the method. Then we can accurately locate the position of characteristic points.
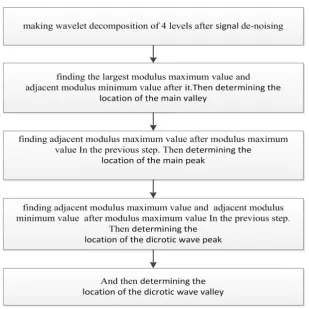
In a pulse wave period, the process of locating the characteristic points of pulse wave is as follows:
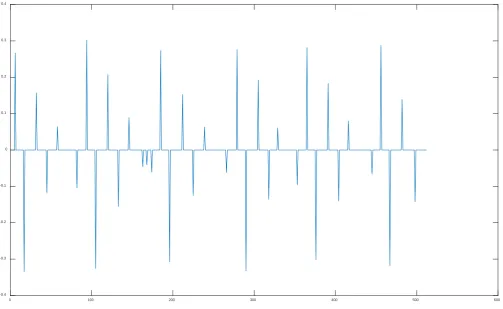
Step 1, we make wavelet decomposition of 4 levels after de-noising signal, and then the distribution of modulus values are shown Figure 5.
[image:6.595.48.552.383.692.2]Step 2, after determining the largest modulus maximum during a pulse wave period, we look for adjacent modulus minimum value. Then we connect the modulus maxi-mum and the modulus minimaxi-mum, and find the intersection of the straight line and the horizontal axis, and then in the vicinity of the waveform corresponding to the intersec-tion, we find the lowest point that is considered to be the location of valley value during the period.
Figure 5. The distribution of modulus values.
0 100 200 300 400 500 600
Step 3, by the same method, we find three intersections of three straight lines and the horizontal axis. And then in the vicinity of the waveform corresponding to each inter-section we find the location of peak value, the location of dicrotic wave peak, the loca-tion of dicrotic wave valley.
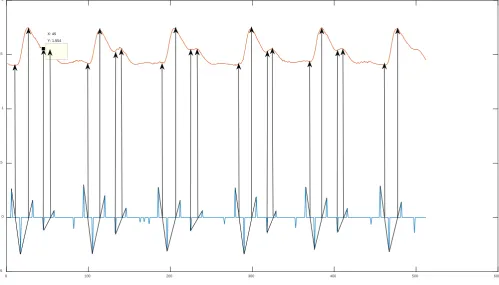
[image:7.595.50.550.403.688.2]Step 4, in the end, we get four characteristic points in a pulse wave period: the main peak, the main valley, dicrotic wave peak, dicrotic wave valley, which are shown in Figure 6.
Specific processing flow is shown in Figure 7.
3.2. The Principle of the Adaptive Threshold Determination Method
As we all know, the key point of determining the location of eigenvalues is to find the maximum modulus maxima position, and then we can find the locations of the corres-ponding feature points.
This paper has taken an effective method for accurately locating characteristic points, which is an adaptive threshold determination method. Therefore, we can precisely de-termine each pulse wave period.
Specific process is showed as follows:
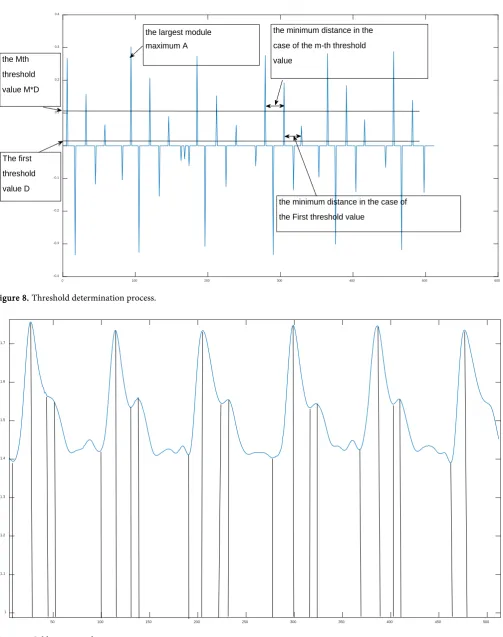
First, we find this signal module maxima and minima. A is representative of the largest module maximum. Then A is divided into N parts. Each size is D = A/N. In theory, N is the bigger, the effect is the better. But the amount of calculation cannot be too large. In this paper, we select N = 15.
Figure 6. Characteristic points of pulse wave.
0 100 200 300 400 500 600
-0.5 0 0.5 1 1.5 2
Figure 7. Location of the characteristic points of pulse wave.
Second, the largest module maximum is divided into N parts, so there are many threshold values. The first threshold value is D, the second threshold value is 2 * D…… the threshold value is M * D, M ranges from 0 ~ N − 1.
Third, we record module maxima exceeding the threshold in case of each threshold. With different threshold values, module maxima exceeding the threshold values are different. The minimum distances between the locations of the module maxima are also different.
Fourth, when the minimum distance in the case of the threshold value is more than 2 times of the minimum distance in the case of the threshold value. We think the thre-shold value is what we need. Thus, we can determine each period of the pulse wave by the threshold. Then we can determine the characteristic points in each period.
Threshold determination process is shown in Figure 8.
4. Simulation Results and Discussion
The paper is using MATLAB simulation program. The collected pulse wave calibrates characteristic points with the method. Calibration results are shown in Figure 9.
Figure 8. Threshold determination process.
Figure 9. Calibration results.
0 100 200 300 400 500 600
-0.4 -0.3 -0.2 -0.1 0 0.1 0.2 0.3
the largest module
maximum A
the minimum distance in the
case of the m-th threshold
value
the minimum distance in the case of
the First threshold value the Mth
threshold
value M*D
The first
threshold
value D
50 100 150 200 250 300 350 400 450 500
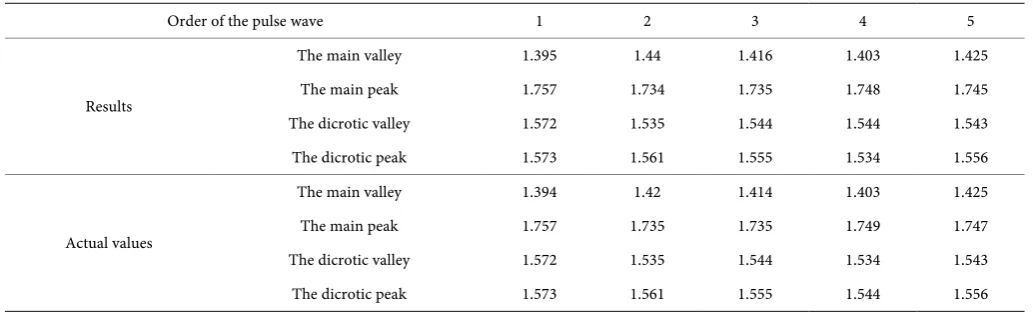
Table 1. Comparison between results and actual values.
Order of the pulse wave 1 2 3 4 5
Results
The main valley 1.395 1.44 1.416 1.403 1.425
The main peak 1.757 1.734 1.735 1.748 1.745
The dicrotic valley 1.572 1.535 1.544 1.544 1.543
The dicrotic peak 1.573 1.561 1.555 1.534 1.556
Actual values
The main valley 1.394 1.42 1.414 1.403 1.425
The main peak 1.757 1.735 1.735 1.749 1.747
The dicrotic valley 1.572 1.535 1.544 1.534 1.543
The dicrotic peak 1.573 1.561 1.555 1.544 1.556
The paper is only a preliminary study. the conclusion is also obtained in the case of few samples. The locations of the four characteristic values will be affected by others factor, such as breathing, equipment interference and so on. For example, when some-one has atrial fibrillation, shapes of pulse wave is various and then the locations of the four characteristic values is also difficult. In the aspect of clinical medicine, we need a lot of experiments and medically confirmed.
5. Conclusions
In this paper, we apply wavelet transform to the pulse signal. And on this basis, we find the location of each characteristic point.
The method proposed in the paper is concise and practical. It is easy to be unders-tood and provides a basis for accurately finding characteristic values of the pulse wave of time domain. At the same time, the paper also provides a solid foundation for the clinical research future of the pulse wave.
Acknowledgements
First and foremost I offer my sincerest gratitude to my supervisor, Professor Wang, who has supported me though out my thesis with his patience and knowledge. I am grateful to Yazhou Shang and Ran Peng for their encouragement and practical advice. This research is supported by R&D projects of Shenzhen government by NO. JCYJ20140417144423206 and JCYJ20150331102721193.
References
[1] Di, N.-Q. and Xie, M. (2007) Pulse Waveform Interpretation. ChineseJournalof Informa-tiononTraditionalChineseMedicine, 6, 3-4.
[2] Nitzan, M., khanokh, B. and Slovik, Y. (2002) The Difference in Pulse Transit Time to the toe and Finger Measured by Photo-Plethysmography. Physiol Meas, 23, 85-93.
http://dx.doi.org/10.1088/0967-3334/23/1/308
[4] Qu, N.Q. and Xie, M.Z. (2007) The Definition of Pulse Wave. ChineseJournalof Informa-tiononTraditionChineseMedicine, 14, 3-4.
[5] Doherty, P., Grabowski, M., Lukaszewicz, W., et al. (2003) Towards a Framework for Ap-proximate Ontologies. Fundamenta Informaticae, 57, 147-165.
[6] Zhao, Z.Q., Zheng, G.W., Shen, W., et al. (2013) Research on Pulse Wave Signal Noise Re-duction and Feature Point Identification. ElectronicDesignEngineering, 21, 57-60. [7] Daubechies, I. (1990) The Wavelet Transform, Time-Frequency Locatization and Signal
Analysis. IEEETransactionsonInformationTheory, 36, 961-1001.
http://dx.doi.org/10.1109/18.57199
[8] Kivanc Mihcak, M., Kozintsev, I., Ramchandran, K. and Moulin, P. (1999) Low-Complexity Image Denoising Based on Statistical Modeling of Wavelet Coefficients. IEEE Signal ProcessingLetters, 6, 300-303. http://dx.doi.org/10.1109/97.803428
[9] Zhang, X., Wang, H.Y. and Li, B.J. (2010) Powerline Interference Denoising Algorithm Analysis of ECG Signals Based on Wavelet Transform. ComputerMeasurement & Control, 18, 902-905.
Submit or recommend next manuscript to SCIRP and we will provide best service for you:
Accepting pre-submission inquiries through Email, Facebook, LinkedIn, Twitter, etc. A wide selection of journals (inclusive of 9 subjects, more than 200 journals)
Providing 24-hour high-quality service User-friendly online submission system Fair and swift peer-review system
Efficient typesetting and proofreading procedure
Display of the result of downloads and visits, as well as the number of cited articles Maximum dissemination of your research work
Submit your manuscript at: http://papersubmission.scirp.org/