Munich Personal RePEc Archive
Gender bias in risk aversion: evidence
from multiple choice exams
Marín, Carmen and Rosa-García, Alfonso
Universidad de Murcia
Gender bias in risk aversion: evidence from multiple choice exams
Carmen Marín
yzAlfonso Rosa-García
x{December 23, 2011
Abstract
We provide evidence on a gender bias in risk aversion among students of economics in Spain. In
a sample of 1947 multiple choice exams with penalization for errors, we …nd that women consistently
answer less questions, while di¤erences in marks are not signi…cant. These empirical results are consistent
with a recent theoretical prediction of the e¤ect of risk aversion in test exams. This …nding shows that
women can su¤er a disadvantage with this kind of exams widely used in education.
Keywords: gender di¤erences, risk aversion, multiple choice
JEL Classi…cation: A22, I21, J16
We are indebted to Josep-Oriol Escardibul and Hubert Janos Kiss for helpful comments. This paper has bene…tted also
from suggestions provided by participants of the XXXVI Simposio Asociación Economía Española (SAEe), the III Jornadas
de Docencia en Economía and of the II Jornada sobre la Dimensión Social de la Educación Universitaria en España. Alfonso
Rosa-García kindly acknowledge the …nancial support from the Spanish Ministry of Science and Innovation under the project
ECO2010-19830.
yCorresponding author. Email: [email protected]; Tel.: +34 868883754; Fax: +34 868883758
zAddress: Dpto. de Fundamentos del Análisis Económico. Facultad de Economía y Empresa. Universidad de Murcia,
Campus de Espinardo. 30100 Murcia.
xEmail: [email protected]; Tel.: +34 868883728
{Address: Dpto. de Fundamentos del Análisis Económico. Facultad de Economía y Empresa. Universidad de Murcia,
1
Introduction
Multiple choice tests are widely used as an easy and objective mean to grade students. However, di¤erent
studies have remarked that test performance is not independent of its design. Usual penalties, in which
wrong answers decrease scores, could induce a gender bias as men and women have shown di¤erent risk
patterns. The literature has also emphasized that test scrambling could yield di¤erent results, making the
exams more di¢cult to understand for students. In this paper we intend to contribute to this literature,
studying how the test structure a¤ected our students’ behavior and performance.
We analyze several exams completed by undergraduate students for the subject Political Economy, taught
in the Business Degree of the Universidad de Murcia. Our sample consists of 1947 individual multiple choice
tests, in which the existence of a gender di¤erence together with the possibility of a test scrambling e¤ect
are alternatively explored. Consistently across all the exams, males tend to answer a higher number of
questions than females, which is in line with the empirical and experimental evidence on the higher risk
aversion observed in women. However, with regard to a possible bias in score output, the data show only
mixed evidence. Test scrambling has an e¤ect when the whole sample is analyzed and only over decisions
on the number of answered questions. These outcomes are all consistent with previous evidence on scores,
and we add two new insights: a link between test behavior and the higher risk aversion of females as well as
partial e¤ects of test scrambling.
The possibility of a gender bias in Economy test scores has been studied for years (Siegfried, 1979; Ballard
and Johnson, 2005). This literature has usually identi…ed a higher score for males,1 which is also in line
with the gender gap in favor of men reported on math scores (Hedges and Nowell, 1995). Empirical evidence
shows that this bias is correlated with the level of gender equality in the country, and seems to decrease
across years (Guiso et al., 2008).2 In our sample, we …nd that males improve upon the scores of girls in 4 of
the 7 exams, although the di¤erence was signi…cant only in one case. This outcome agrees with the weakness
of a gender bias in scores that would favor males facing this kind of exams.
Our main contribution is to report evidence of a higher degree of risk aversion in females, measured as
the amount of answered questions: females answered around 4% less questions than males. Moreover, we
…nd it to be signi…cant in each of the sub-samples. Our exams are designed with a penalty that gives an
risk aversion. Thus, we provide new data that support the evidence on a higher risk aversion for women
(Croson and Gneezy, 2009). Our results also support the theoretical analysis by Espinosa and Gardeazábal
(2010) that predicts high di¤erences in number of answered questions but low di¤erences in scores for agents
with di¤erent risk aversion.
The literature has also explored scrambling test e¤ects. Typically, non-signi…cant (or very slight)
dif-ferences are found between those students who solve exams with questions in a randomized order against
those students who solve them according with the sequence of topics taught in class (Gohmann and Spector,
1989). We also do not …nd a signi…cant e¤ect in score, but we do provide some evidence on the e¤ect over
the number of answered questions: people doing the scrambled version of the exam answered less questions.
This suggests that when individuals confront a less uncertain type of exam, they become more conservative.
2
The Data
We analyze a set of seven end-of-term examinations of the subject Political Economy across a …ve years
period. The sample includes only those periods when we were able to recover all the marks (June and
September 2005, 2008 and 2009, and September 2007).
Our target subject was taught in the …rst of the 3-years Degree in Business of the Universidad de Murcia
and was a typical introductory course to Microeconomics. The …nal exam included a multiple choice test
with 20 questions that accounted for the 40% of the …nal mark, and that the student had to pass in order
to be evaluated. Each of the test questions was comprised of three possible options, being correct only one
of them. Each wrong answer penalized 0.5 correct answers, so that the expected score of a random answer
was zero. There was no penalty for unanswered questions. In this type of exam, if students assign to each
option a positive probability of being correct, they have in fact to decide whether to participate or not in
a lottery with positive expected value (if the true answer is usually a higher probability). In that case risk
aversion matters, since more averse students are expected to answer less questions.
Exams were distributed to students in four versions that only di¤ered in the order of questions. Type
1 exams presented questions in the same order they had been taught during the semester. Rest of types
J05 S05 S07 J08 S08 J09 S09 Average
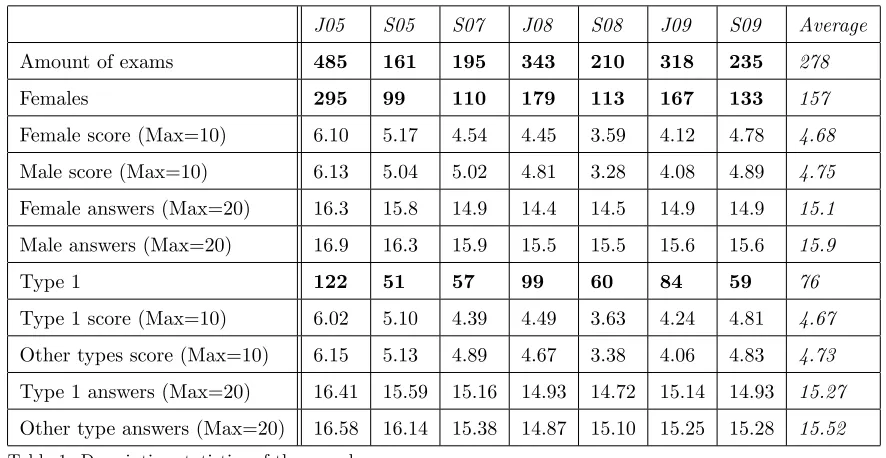
Amount of exams 485 161 195 343 210 318 235 278
Females 295 99 110 179 113 167 133 157
Female score (Max=10) 6.10 5.17 4.54 4.45 3.59 4.12 4.78 4.68
Male score (Max=10) 6.13 5.04 5.02 4.81 3.28 4.08 4.89 4.75
Female answers (Max=20) 16.3 15.8 14.9 14.4 14.5 14.9 14.9 15.1
Male answers (Max=20) 16.9 16.3 15.9 15.5 15.5 15.6 15.6 15.9
Type 1 122 51 57 99 60 84 59 76
Type 1 score (Max=10) 6.02 5.10 4.39 4.49 3.63 4.24 4.81 4.67
Other types score (Max=10) 6.15 5.13 4.89 4.67 3.38 4.06 4.83 4.73
Type 1 answers (Max=20) 16.41 15.59 15.16 14.93 14.72 15.14 14.93 15.27
[image:5.612.94.537.143.372.2]Other type answers (Max=20) 16.58 16.14 15.38 14.87 15.10 15.25 15.28 15.52
Table 1. Descriptive statistics of the sample
There is a total of 1947 individual tests, ranging from a minimum of 161 in the sub-sample of September
2005 and to a maximum of 485 in June 2005. From the total, we have 1096 done by women (56.29%) and
532 Type 1 exams (27.32%). We observe that di¤erences in score are very small, while di¤erences between
males and females in answered questions are persistent. Di¤erences in the number of answered questions
between individuals facing Type 1 exam and the rest are not so clear.
3
Empirical Evidence
In order to disentangle if students’ behavior is dependent on gender, we have regressed the number of blank
(unanswered) questions against a set of explicative variables. In particular, the variables woman (0 for men,
1 for women) and Type (0 for the exam in a randomized order, 1 for the ordered exam) were included.
The speci…c characteristics of the examinations were controlled using the variable Mean, that consisted of
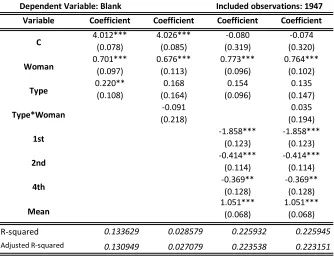
Variable Coefficient Coefficient Coefficient Coefficient C 4.012*** (0.078) 4.026*** (0.085) -0.080 (0.319) -0.074 (0.320) Woman 0.701*** (0.097) 0.676*** (0.113) 0.773*** (0.096) 0.764*** (0.102) Type 0.220** (0.108) 0.168 (0.164) 0.154 (0.096) 0.135 (0.147) Type*Woman -0.091 (0.218) 0.035 (0.194) 1st -1.858*** (0.123) -1.858*** (0.123) 2nd -0.414*** (0.114) -0.414*** (0.114) 4th -0.369** (0.128) -0.369** (0.128) Mean 1.051*** (0.068) 1.051*** (0.068)
R-squared 0.133629 0.028579 0.225932 0.225945
[image:6.612.140.474.138.395.2]Adjusted R-squared 0.130949 0.027079 0.223538 0.223151 Included observations: 1947 Dependent Variable: Blank
Table 2. Variables are significant at ***1%, **5% or *10%
Women answered signi…cantly less questions than men. The same result holds for the type of exam, since
individuals doing the scrambled version answered signi…cantly less questions. Individuals with the
non-scrambled exam answered 0.22 questions less (around 1%) while women left 0.7 (around 3.5%) unanswered
questions more than men. Interestingly, people in the fourth quartile answered more questions than those
in the third one. The e¤ect of Type is not signi…cant when we interact it with Woman.
The most consistent result is that the woman variable is strongly signi…cant across all the sample. In
fact, estimating for each of the seven examinations, we …nd that gender is always a signi…cant explanatory
variable, while Type is not signi…cant in any of the seven sub-samples. Table 3 shows these results.
JUN 05
SEP 05
SEP 07
JUN 08
SEP 08
JUN 09
SEP 09
Full sample
Women
Yes***
Yes*
Yes***
Yes***
Yes***
Yes***
Yes***
Yes***
Type
No
No
No
No
No
No
No
Yes*
Table 3. Exams in which blank answers depend significantly on each variable is sginficant at ***1%, **5% or *10%
This evidence suggests a signi…cant di¤erence in men and women’s behavior in our test exams. Given
the increasing evidence of di¤erences in risk aversion between genders, we argue that risk aversion is a
[image:6.612.71.552.570.619.2]should observe only small di¤erences in marks. Table 4 shows the results of regressing marks against gender,
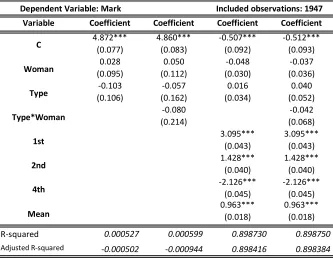
controlling for the student’s quartile and the sub-sample mean. In this case, women obtained lower scores
than men, although the di¤erence was not signi…cant, and type had no e¤ect. This is consistent with the
explanation of risk aversion as the cause of the gender gap.
Variable Coefficient Coefficient Coefficient Coefficient
C 4.872*** (0.077) 4.860*** (0.083) -0.507*** (0.092) -0.512*** (0.093) Woman 0.028 (0.095) 0.050 (0.112) -0.048 (0.030) -0.037 (0.036) Type -0.103 (0.106) -0.057 (0.162) 0.016 (0.034) 0.040 (0.052)
Type*Woman (0.214)-0.080 (0.068)-0.042
1st 3.095*** (0.043) 3.095*** (0.043) 2nd 1.428*** (0.040) 1.428*** (0.040) 4th -2.126*** (0.045) -2.126*** (0.045) Mean 0.963*** (0.018) 0.963*** (0.018)
R-squared 0.000527 0.000599 0.898730 0.898750
Adjusted R-squared -0.000502 -0.000944 0.898416 0.898384
[image:7.612.140.473.208.466.2]Dependent Variable: Mark Included observations: 1947
Table 4. Variables are significant at ***1%, **5% or *10%
Table 5 shows that, across all the sub-samples, there is a signi…cant e¤ect for gender (with men obtaining
a higher score than women) only in one of the seven cases. Type is not signi…cant in any of them.
JUN 05
SEP 05
SEP 07
JUN 08
SEP 08
JUN 09
SEP 09
Full sample
Women
No
No
No
No
No
Yes**
No
No
Type
No
No
No
No
No
No
No
No
between Woman and Type with the two lowest quartiles in scores.
observations: 1947
Variable Coefficient Coefficient Coefficient Coefficient
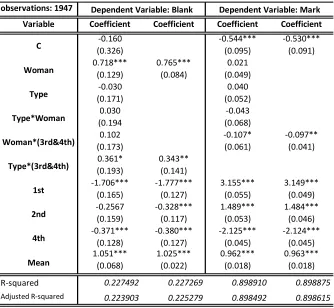
C -0.160 (0.326) -0.544*** (0.095) -0.530*** (0.091) Woman 0.718*** (0.129) 0.765*** (0.084) 0.021 (0.049) Type -0.030 (0.171) 0.040 (0.052) Type*Woman 0.030 (0.194 -0.043 (0.068) Woman*(3rd&4th) 0.102 (0.173) -0.107* (0.061) -0.097** (0.041) Type*(3rd&4th) 0.361* (0.193) 0.343** (0.141) 1st -1.706*** (0.165) -1.777*** (0.127) 3.155*** (0.055) 3.149*** (0.049) 2nd -0.2567 (0.159) -0.328*** (0.117) 1.489*** (0.053) 1.484*** (0.046) 4th -0.371*** (0.128) -0.380*** (0.127) -2.125*** (0.045) -2.124*** (0.045) Mean 1.051*** (0.068) 1.025*** (0.022) 0.962*** (0.018) 0.963*** (0.018)
R-squared 0.227492 0.227269 0.898910 0.898875
[image:8.612.140.474.147.455.2]Adjusted R-squared 0.223903 0.225279 0.898492 0.898615
Table 6. Variables are significant at ***1%, **5% or *10%
Dependent Variable: Mark Dependent Variable: Blank
Mean includes the average number of blank answers (scores) in each sub-sample, while Blank (Mark) is
the dependent variable. For the case of Blank answers, the gender e¤ect is completely robust. Nevertheless
we also identify additional e¤ects for the Type 1 exams: individuals with a lower score answered less questions
(more blank answers) when they had the ordered exam. This suggest that in the less uncertain environment
of the ordered exam, individuals were less risky. With regard to scores, the …nding is that between students
with low marks, women did worse than men. This suggests that possibly a gender gap in scores did occur
among the individuals with less knowledge.
4
Conclusion
In our multiple choice tests, males and females mainly di¤er in the level of non-answered questions, which
can generate a higher expected mark. For risk averse agents, Espinosa and Gardeazábal (2010) show that
the level of answered questions should be relevant, although the di¤erences in scores are expected to be
small. Consistently with this prediction, we …nd that women answered less questions in our exams but the
di¤erence in scores between genders was very small and mostly non-signi…cant. Another potential reason
that could a¤ect risk averse agents is the e¤ect of test scrambling. In this respect we obtain it has very small
e¤ects and only with regard to the number of answered questions when using the full sample of exams.
Therefore, we …nd consistent evidence of di¤erent men and women behavior in multiple choice tests,
being di¤erences of risk aversion a robust explanation for this fact. Although the di¤erences in scores are
small, an e¤ective discrimination against women due to their higher risk aversion can be in place. Potential
ways of modifying this result are to increase the number of questions or to avoid the penalization for the
wrong answers.
References
[1] Ballard, C. and M. Johnson (2005): "Gender, expectations, and grades in introductory microeconomics
at a US university",Feminist Economics, 11(1): 95-122.
[2] Burgos, A. (2004): "Guessing and gambling", Economics Bulletin, 4 (4), 1-10.
[3] Croson, R. and U. Gneezy, (2009): "Gender di¤erences in preferences",Journal of Economic Literature,
47 (2) (2009), pp. 1–27.
[4] Espinosa, M. P. and J. Gardeazábal (2010): "Optimal correction for guessing in multiple-choice tests",
Journal of Mathematical Psychology 54, 415 425
[5] Gohmann, Stephan F. and Lee C. Spector (1989): "Test scrambling and student performance",Journal
of Economic Education, 20, 235–238.
[6] Guiso, L., F. Monte, P. Sapienza and L. Zingales (2008): "Culture, gender, and math", Science, 320,
1164–1165.
[9] Makridou-Bousiou, Despina (2006): "Gender di¤erences in economic knowledge in Greece",
Interna-tional Business & Economics Research Journal, 5, 35-41
[10] Siegfried, John (1979): "Male-Female di¤erences in economic education: a survey",Journal of Economic