EDB Eurasian Integration Yearbook 2012
Vinokurov, Evgeny
Eurasian Development Bank
2012
Online at
https://mpra.ub.uni-muenchen.de/49179/
Eurasian
intEgration
YEarBook
Eurasian Integration Yearbook 2012. – Almaty, 2012. – p. 360 ISBN 978-601-7151-30-0
Annual publication of the Eurasian Development Bank
Edited by Evgeny Vinokurov
the Eurasian Development Bank is an international financial institution established to promote economic growth and integration processes in Eurasia. the Bank was founded by the intergovernmental agreement signed in January 2006 by the russian Federation and the republic of kazakhstan. tajikistan, Belarus, armenia and kyrgyzstan joined the Bank in 2009-2011.
Electric power, transportation infrastructure and high-tech and innovative industries are key areas for Bank’s financial activity. in line with its charter, the Bank views information and research support for integration in Eurasia as a priority of its analytical work.
ISBN 978-601-7151-30-0 УДК 338
ББК 65.9 © Eurasian Development Bank, 2012 Eurasian Development Bank
Address:
220, Dostyk ave., almaty, 050051, republic of kazakhstan, telephone: +7 (727) 244 40 44, Fax: +7 (727) 244 65 70, 291 42 63 E-mail: [email protected]
http://www.eabr.org
Coordinator:
gulnaz imamniyazova, EDB
Design, layout, and printing:
ruan Publishing Company
the EDB’s special acknowledgements go to tatyana ossennikova, Ekaterina kopylova, Hannah Dyson and Jonathan Elliot stephany Droop for translating and editing materials for the Yearbook in English.
Edited by Evgeny Vinokurov, EDB
Advisory Council: Sailau Baizakov,
Insitute for Economic Research, Astana Michael Emerson,
Centre for European Policy Studies, Brussels Valery Geets,
Institute for Economic Forecasting, Kyiv Ruslan Grinberg,
Insitute of Economy RAS, Moscow Ivan Korolev,
Institute for World Economy and International Relations RAS, Moscow Luk Van Langenhove,
United Nations University, Bruges Johannes Linn,
Brookings Institute, Washington Liu Huaqin,
Chinese Academy of International Trade and Economic Cooperation, Beijing Katlijn Malfliet,
Catholic University of Leuven Ivan Samson,
University of Grenoble II Leonid Vardomskiy,
Institute of Economy RAS, Moscow Vladimir Yasinskiy,
Contents
List of Figures and Tables 6
List of Abbreviations 10
GREEtINGS
igor Finogenov, Eurasian Development Bank 12
tatyana Valovaya, Eurasian Economic Commission 13
Introduction 14
CuStoMS uNIoN AND tHE SINGLE ECoNoMIC SpACE
1. the Economic Effects of the Creation
of the Single Economic Space and potential Accession
of ukraine 19
Viktor ivanter, Valery geets, Vladimir Yasinskiy, alexander shirov, and andrey anisimov
2. Eurasian Economic Integration: origins, patterns, and outlooks 42
tatyana Valovaya
3. Assessing the Economic Effect of Kyrgyzstan’s
Accession to the Customs union 62
alexander Pavlov
4. Commentary on the article: Assessing the Economic Effect
of Kyrgyzstan’s Accession to the Customs union 76
nazik Beishenaly
tHE ECoNoMICS of tHE poSt-SoVIEt AND EuRASIAN INtEGRAtIoN
5. Eurasia and Eurasian Integration:
Beyond the post-Soviet Borders 80
Evgeny Vinokurov and alexander Libman
6. Central Asian Regional Integration and Cooperation:
Reality or Mirage? 96
7. the Impact of Global financial and Economic Instability
on the CIS 118
Elvira kurmanalieva, konstantin Fedorov
8. Monitoring Mutual Investments in CIS Countries 129
alexey kuznetsov
9. Monitoring social moods in the post-Soviet space:
EDB Integration Barometer 150
igor V. Zadorin
ADVANCED ECoNoMIC CoopERAtIoN IN SECtoRS AND INDuStRIES
10. Developing Air transport potential of the EurAsEC Countries 164
aigul absametova
11. Integration processes in the Electric power Sectors
of the EDB Member States 186
aigul absametova
12. Water and Energy problems in the Basins of transboundary Rivers in Central Asia and prospects for the Development
of Hydropower Resources 217
Vladimir Yasinskiy, alexander Mironenkov, tulegen sarsembekov
2011: DAtA AND REVIEWS
13. Chronicle of Eurasian Regional Integration 2011 229
natalia Maqsimchook
14. CIS Countries: primary Macroeconomic Indicators 295
Elvira kurmanalieva, konstantin Fedorov
15. Multilateral and Regional Development Banks in Northern
and Central Eurasia: overview of Activities in 2011 311
Ella Baibikova
information for authors 344
List of figures and tables
fIGuRES
Figure 1.1. Effects of sEs creation on Belarus 23-24
Figure 1.2. Effects of sEs creation on kazakhstan 24-25
Figure 1.3. Effects of sEs creation on russia 25-26
Figure 1.4. integral effect of sEs creation on russia,
kazakhstan and Belarus 26
Figure 1.5. Changes in ukrainian gDP under various integration
scenarios 37
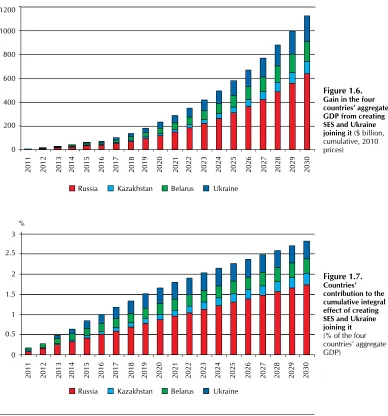
Figure 1.6. gain in the four countries’ aggregate gDP from
creating sEs and ukraine joining it 39
Figure 1.7. Countries’ contribution to the cumulative integral
effect of creating sEs and ukraine joining it 39
Figure 3.1. Dynamics of kyrgyzstan’s foreign trade
in 2005-2009 71
Figure 6.1. global trade flows 98
Figure 6.2. trade growth in Central asia 99
Figure 6.3. intraregional trade shares in asia 99
Figure 6.4. intraregional trade shares 101
Figure 6.5. CarEC investment Loans and grants, by sector
and Date 109
Figure 6.6. Financing of CarEC Programs 109
Figure 7.1. government bonds yield, 2 years to maturity 119
Figure 7.2. Land prices and real property rentals in China 121
Figure 7.3. Food and oil price indexes 122
Figure 8.1. the geographic distribution of accumulated russian
direct investment in Cis countries and georgia 139
Figure 8.2. the map of direct mutual investment in Cis countries
and georgia 141
Figure 9.1. illustrative scheme of the countries’ distribution
on geopolitical vectors 157
Figure 10.1. Europe-asia air cargo traffic in 1991-2010 168
Figure 10.2. annual growth in EurasEC’s civil aviation traffic
in 2005-2010 169
Figure 10.3. annual growth of adjusted payload distance in world
Figure 10.4. EurasEC’s international and domestic passenger
traffic in 2010 171
Figure 10.5. international passenger traffic through EurasEC
by domestic and foreign airlines in 2010 171
Figure 10.6. EurasEC’s international and domestic cargo
and mail traffic in 2010 172
Figure 10.7. international cargo and mail traffic via EurasEC
airports by domestic and foreign airlines in 2010 173
Figure 10.8. utilisation of EurasEC’s aircraft capacity in 2010 173
Figure 10.9. airspace serviced by EurasEC’s atM bodies 177
Figure 12.1. sangtuda-1 HPP 221
Figure 14.1. World trade 296
Figure 14.2. gDP growth in Cis countries 296
Figure 14.3. Current account of the balance of payments 298
Figure 14.4. gold and forex reserves: (in months of imports
of goods and services) 298
Figure 14.5. state budget: consolidated budget balance 299
Figure 14.6. Monetary sphere: CPi growth 299
Figure 14.7. azerbaijan: Economic situation 300
Figure 14.8. armenia: Economic situation 301
Figure 14.9. Belarus: Economic situation 302
Figure 14.10. kazakhstan: Economic situation 303
Figure 14.11. kyrgyzstan: Economic situation 304
Figure 14.12. Moldova: Economic situation 305
Figure 14.13. russia: Economic situation 306
Figure 14.14. tajikistan: Economic situation 307
Figure 14.15. turkmenistan: Economic situation 308
Figure 14.16. uzbekistan: Economic situation 309
Figure 14.17. ukraine: Economic situation 310
tABLES
table 1.1. integration scenarios considered 22
table 1.2. average annual growth rates of ukrainian gDP
and the main components of the end demand 27
table 1.3. Production and import of energy resources
in ukraine 28
table 1.4. sectoral composition of the ukrainian economy
in constant prices 29
table 1.5. Change in key macroeconomic indicators
table 1.6. Change in key macroeconomic indicators compared
to the baseline option 30
table 1.7. Change in key macroeconomic indicators compared
to the baseline option 31
table 1.8. Change in key macroeconomic indicators compared
to the baseline option 32
table 1.9. Change in key macroeconomic indicators compared
to the baseline option 33
table 1.10. assessment of the gap in economic efficiency
and scientific and technological development
compared to the oECD countries 34
table 1.11. assessment of integration effects at the sectoral level 35
table 1.12. sectoral breakdown of the ukrainian economy,
in constant prices 38
table 3.1. Comparative analysis of the Cu CCt and
kyrgyzstan’s Ct 66-70
table 3.2. the structure of kyrgyzstan’s state budget
revenues 73
table 5.1. three concepts of Eurasia 86
table 6.1. CarEC operations in 2001-2010 109
table 7.1. grouping indicators for the Cis countries 123
table 7.2. geographical distribution of trade in the Cis
countries 127
table 8.1. accumulated exported and imported direct
investment in Cis countries and georgia
as at late 2010 131
table 8.2. the geography of accumulated direct investment
of Cis countries as at late 2010 132
table 8.3. the geography of ukrainian direct investment
accumulated abroad (share capital) 133
table 8.4. Projects involving direct investment in Cis
countries and georgia (as at late 2011) 138
table 8.5. accumulated FDi in russia, by country 140
table 8.6. the largest FDi pairs in the post-soviet space
not involving russia 141
table 8.7. the largest investment projects in the MMi Cis
database 142-143
table 8.8. the key recipients of direct investment 144
table 10.1. Cargo transported between EurasEC member states
table 10.2. Forecasted cargo transportation in EurasEC by road
and rail for 2015-2020 165
table 10.3. scheduled and non-scheduled cargo and mail traffic
between EurasEC member states 166
table 10.4. EurasEC and iCao’s adjusted payload distance
in 2005-2010 169
table 10.5. EurasEC’s domestic and international passenger
traffic in 2000-2010 170
table 10.6. EurasEC’s domestic and international passenger
turnover in 2000-2010 170
table 10.7. EurasEC’s domestic and international cargo and
mail turnover in 2000-2010 172
table 10.8. EurasEC’s domestic and international cargo and
mail traffic in 2000-2010 173
table 10.9. scheduled passenger traffic by EurasEC’s largest
airlines in 2005-2010 174
table 10.10. scheduled cargo traffic by EurasEC’s largest
airlines in 2005-2010 175
table 10.11. EurasEC’s international airports, including iCao
category aerodromes 176
table 11.1. Electricity exports and imports by armenia
in 2008–2010 189
table 11.2. Electricity exports and imports between Belarus
and neighbouring countries 190
table 11.3. Electricity imports and exports by kazakhstan 191
table 11.4. Electricity transmission by russia through
kazakhstan’s power system 192
table 11.5. Electricity exports and imports between kyrgyzstan
and neighbouring countries 192
table 11.6. russian electricity exports and imports 193
table 11.7. Electricity exports and imports by tajikistan 195
table 11.8. russia’s foreign electric power assets and
investments 196
table 11.9. Development, production and supply
of electric power equipment and design
documents by russian companies 197-198
table 12.1. Degree of flow control in the amudarya and
List of Abbreviations
aCF – EurasEC anti-Crisis Fund aDB – asian Development Bank
asEan – association of southeast asian nations BstDB – Black sea trade and Development Bank
CarEC – Central asia regional Economic Cooperation Programme Cis – Commonwealth of independent states
CPi – consumer price index
CrrF – Collective rapid reaction Force Csto – Collective security treaty organisation Cu – Customs union
Cu CCt – Cu Common Customs tariff
EBrD – European Bank for reconstruction and Development ECB – European Central Bank
EDB – Eurasian Development Bank
EDB Cis – Centre for integration studies of the Eurasian Development Bank EEC – Eurasian Economic Commission
EiB – European investment Bank Eu – European union
EurasEC – Eurasian Economic Community
FEaCn – Foreign Economic activity Commodity nomenclature FDi – foreign direct investment
Fta – free trade area
gatt – general agreement on tariffs and trade gDP – gross domestic product
gts – gas transportation system
guaM – georgia, ukraine, azerbaijan and Moldova regional cooperation group
HPP – hydropower plant
iBrD – international Bank for reconstruction and Development iCao – international Civil aviation organisation
iEF ras – institute of Economic Forecasting at the russian academy of sciences
iEF nasu – institute of Economics and Forecasting at the national academy of sciences of ukraine
iMF – international Monetary Fund iPo – initial public offering iPs – integrated power system isDB – islamic Development Bank
iso – international organisation for standardisation kasE – kazakhstan stock Exchange
ktZh – kazakhstan temir Zholy M&a – mergers & acquisitions
MDBs – multilateral development banks
Miga – Multilateral investment guarantee agency
MMi Cis – monitoring of mutual investments in Cis countries and georgia naFta – north american Free trade agreement
niB – nordic investment Bank nPP – nuclear power plant
oECD – organisation for Economic Cooperation and Development oFiD – oPEC Fund for international Development
oPEC – organisation of Petroleum Exporting Countries PPP – public private partnership
rZD – russian railways
sCo – shanghai Cooperation organisation sEs – single Economic space
sME – small and medium enterprises tnC – transnational corporation tPP – thermal power plant uaC – united aircraft Corporation uEs – unified Energy system un – united nations
un CoMtraDE – united nations Commodity trade statistics Database unCtaD – united nations Conference on trade and Development unDP – united nations Development Programme
unPri – united nations Principles for responsible investment WB – World Bank
foREWoRD
the Eurasian Development Bank is an integration bank; an essential part of its mission is to advance economic integration between its member states. the Bank’s projects focus on fostering mutual trade and investments and its portfolio comprises over 50 projects in different economic sectors, including agriculture, metallurgy, energy and transportation.
the EDB’s activities in the region, however, are not only limited to financial investments in development and integration. the Bank developed rigorous and vibrant researches into a wide range of integration issues, thereby contributing to integration by its high-level expertise and multifaceted analysis. the EDB Centre for integration studies, opened in 2011 with the purpose of undertaking research into regional economic integration, has implemented a number of research projects to date, ranging from corporate integration and the impact of the Customs union and the single Economic space on regional economies to the likelihood of creating common labour market in the area and assessing public attitudes towards Eurasian integration. the Centre’s figures on the Cu’s macroeconomic impact have by now become a standard assessment.
the findings of these research projects along with those of other important analytical studies are presented in the 5th edition of the EDB Eurasian integration Yearbook, which the Bank has published annually since 2008. the series is a compilation of authoritative papers and in-depth studies examining the most important aspects of Eurasian integration. i am happy to confirm the EBD’s continued commitment to research on regional integration.
Igor finogenov
DEAR READERS,
2012 has been marked by the intensification of integration trends in the post-soviet space. the Belarus-kazakhstan-russia Customs union (Cu) expanded into the single Economic space (sEs), bringing into action a set of seventeen agreements ranging from the coordination of macroeconomic and fiscal policies to labour migration, energy and technical regulation. the sEs’ key goal is to promote four basic economic freedoms – the free movement of goods, capital, services and people. the Eurasian Economic Commission, a supra-national body with extensive powers, has been set up to facilitate efficient operation of sEs, with appointed commissioners in charge of each functional dimension of integration.
an efficient Eurasian bloc will facilitate efficient economic cooperation with both developed markets and emerging economies. it will increase competition and promote equal conditions for businesses and investors from different regions. the sEs will help to effectively reduce and eventually eliminate the practice of restrictive national rules at all stages of doing business. the sEs will also guarantee an upgrade of technical regulations and standards. the transition towards modern standards will ensure their full compliance with Wto standards as well as a high degree of compatibility with Eu and iso standards, which will facilitate technological integration for all manufacturers, including investors from outside of the sEs, and across the Eu/sEs areas. in the mid-term perspective, Eurasian integration will be developing in two directions – the present integration initiatives will be gaining further depth whilst also widening their geography. the manifesting success of the Cu and sEs can be explained by the clear focus on well-defined, manageable and concrete tasks of integration. Furthermore, the specifics of the post-soviet integration is its thorough and stable foundation, made up of a multitude of intertwined economic ties, which can be put to good use in the new integration projects. the interconnections of production factors, for example, like those of labour and capital, are showing an impressive dynamics today, which is proving that the intensification of integration trends is in demand.
the Eurasian Development Bank has truly become an important engine of economic integration. With the launch of the EDB Centre for integration studies last year, the Bank has significantly expanded its research and policy analysis of regional integration. the Eurasian Economic Commission welcomes this initiative as a very timely and expedient step to advance research in an area that has become extremely important for today’s political and economic agenda of the region. the EDB Eurasian integration Yearbook is there to supply the global expert audience with information and analysis on Eurasian integration.
tatyana Valovaya
the Customs union
and the Single Economic Space:
towards the Eurasian Economic
union
the Customs union of Belarus, kazakhstan and russia was established in 2010. it expanded into the single Economic space in 2012, based on a comprehensive set of agreements covering subjects from the coordination of macroeconomic and fiscal policies to labour migration, energy and technical regulation. regional integration will be taken a step further through the planned creation, by 2015, of the Eurasian Economic union. the Customs union was the first major systemic integration initiative to make it as far as the implementation stage. importantly, the Eurasian Economic Commission may also come to represent the first truly supranational institution in the region’s 20 years of post-soviet reintegration attempts.
the primary goal of the sEs is to promote the free movement of goods, capital, services and people. it will increase competition and create equal conditions for all businesses and investors, regardless of their country of origin. the sEs will reduce and ultimately eliminate the structures of national legislation at every stage of the business transaction and guarantees an overhaul of technical regulations and standards. the adoption of improved standards will ensure that Evgeny Vinokurov – Ph.D., Director of the EDB Centre for integration studies.
1 Eurasian Development Bank (2009) The System of Indicators of Eurasian Integration. EDB: Almaty. Available at www.eabr.
org/e/research/centreCIS/projectsandreportsCIS/siei/
the sEs complies fully with Wto standards and that there is a high degree of compatibility with Eu and iso standards. this will facilitate technological integration between manufacturers, including investors from outside the sEs.
the EDB system of indicators of Eurasian integration1 shows that the decline
of integration in the post-soviet space in the 2000s and the general trend of the 1990s have not been reversed. the composite index of integration in the post-soviet space suggests that integration levels have generally been falling, but that russia, kazakhstan and Belarus have in fact become more integrated. this counter-process genuinely stands out. these three economies form an ‘integration core’ in the post-soviet space, which, during the first decade of the
21st century, has developed from the bottom up, with its roots in enterprises
and households. in 2009-2010 the formation of this integration core gained momentum, largely due to the global economic crisis, and culminated in the establishment of the Cu.
the development of the Cu and the sEs is crucial for the success of regional economic cooperation. it encompasses vital processes such as the trade in goods and services, movement of labour, macroeconomic coordination, financial integration, common technical regulations, and regulatory convergence. applied economic research is, in turn, crucial for a deeper understanding and appropriate management of these complex processes. the Eurasian integration Yearbook, published for the fifth consecutive year, attempts to move in this direction.
tWo EuRASIAN INtEGRAtIoNS
Further development of regional integration may include a deep and comprehensive free trade area (DCFta) between the European union and the sEs. such a DCFta would represent a huge step forward by removing barriers to trade in goods and services, improving the management of intellectual property and the mobility of labour and capital. Furthermore, the sEs is already taking its first steps towards free trade with its asian and Pacific partners. smaller economies (Vietnam, new Zealand, etc.) as well as large economies (south korea, india, and China) immediately spring to mind. spilling over the boundaries of the former soviet union entails ‘another’ Eurasian integration, distinct from the post-soviet one.
bottom up’, with minimal support from national governments. We think that an important task for the 2010s – both for researchers and practitioners – will be to reconcile both kinds of ‘Eurasian integration’, the post-soviet and the continental one. the latter we take to be the qualitative growth of economic links between various sub-regions of the Eurasian continents – Europe, East asia, south asia, West asia, and northern and Central Eurasia (i.e., the post-soviet space).
in our view, Eurasian continental integration could become a key driver of development, motivated by the integration of energy trade, non-energy trade and transport, capital and labour flows, tourism, pharmaceuticals trade and epidemiological threats. a key question is whether or not the main continental powers will allow this integration – which represents a catch-up process in the historic worldwide drive for globalisation – to proceed smoothly and efficiently by cooperating in the establishment of transport networks, opening up access to natural and human resources and creating institutions that support collective action in the pursuit of regional benefits and the alleviation of regional disadvantages. or, conversely, will competition over resources, boundaries and allegiances, or disagreements over values and political systems drive deep wedges between countries and sub-regions across Eurasia, as they had in the past.
although potentially vital for all countries involved, Eurasian integration has particular significance for russia and Central asia. these countries have much to gain from Eurasian integration that is constrained within the boundaries of the post-soviet area. therefore, it is valid to argue in favour of open regionalism in Eurasia as an economically optimal component of post-soviet integration. the ‘two Eurasian integrations’ should supplement each other.
REVIEW of CoNtRIButIoNS
the 20 contributions in this volume are divided into four sections.
of Eurasian post-soviet integration. this paper provides comprehensive insight into the general patterns of regional integration in the post-soviet space and how the extensive experience of the European union is being carefully re-thought by its eastern neighbours.
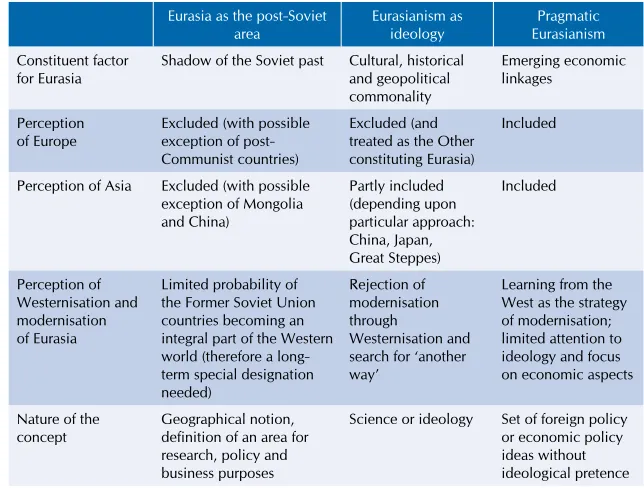
the section on The Economics of the Post-Soviet and Eurasian Integration aims to knit together what we call the ‘two Eurasian integrations’ – that is, the post-soviet and continental ones. Evgeny Vinokurov and alexander Libman summarise the findings of their two monographs, each of which focused on one of these two types of Eurasian integration. throughout the last two decades, the term ‘Eurasia’ has been used more and more by scholars and practitioners, but the definition of the term has remained unclear. this lack of clarity is amplified for the concept of Eurasian integration. the authors elaborate on the concept of Eurasia and Eurasian integration, distinguishing between three notions of ‘Eurasia’ and corresponding views of Eurasian integration, and evaluate their importance in literature and possible research developments. the next paper by Johannes Linn, a well-known and influential proponent of Eurasian integration, delves into the intricacies of Central asia. Based on the large body of research, Linn elaborates on the opportunities provided by this region, which could well serve as the laboratory of continental integration in Eurasia.
the following three contributions bring us back to the post-soviet space, covering three complex issues: public finances (Elvira kurmanalieva and konstantin Fedorov); mutual investments (alexey kuznetsov); and EDB integration Barometer (by igor Zadorin). all three papers originate from the projects undertaken by the EDB Centre for integration studies. alexey kuznetsov’s account in particular presents the database on mutual investment in the Commonwealth of independent states (Cis), which includes around 600 examples.
the section on Advanced Economic Cooperation in Sectors and Industries
features three sectors: air transportation and electric power (aigul absametova); and hydropower and water management in Central asia (Vladimir Yasinskiy, alexander Mironenkov and tulegen sarsembekov). Based on our assuredness that robust integration is formed primarily ‘from the bottom up’ by means of substantial cooperation, the EDB continues to publish a series of reports on cooperation in particular sectors and industries throughout the post-soviet space.
represent both the objects of integration and its subjects, since they proactively shape economic interaction between countries, for example, by investing in crucial cross-border infrastructure. therefore, this overview is highly relevant for all research on regional integration.
1
the Economic Effects
of the Creation of the Single
Economic Space and potential
Accession of ukraine
1
Viktor Ivanter – russian economist, academic of the russian academy of sciences (since 2000), and an expert in economic, finance and banking analysis and forecasting. since 1997, he has been heading the institute of Economic Forecasting at the russian academy of sciences (iEF ras). He is also the chairman of the institute’s dissertation council, a board member of the Free Economic society, and the chief editor of the studies on russian Economic Development (Problemy Prognozirovaniya) journal.
Valery Geets – Ph.D. in economics, academic of the national academy of sciences of ukraine; an honoured master of sciences and engineering, and a laureate of the state prize. since 1997, he has been heading the institute of Economics and Forecasting at the national academy of sciences of ukraine (iEF nasu) and since 1998, academician secretary of the Economics Department at nasu.
Vladimir Yasinskiy – Head of strategy and research Department, Member of the Board at the Eurasian Development Bank. He was trained as economist at the Economic Faculty of Moscow state university and at the institute for Economy of the russian academy of sciences (post-graduate studies). His professional record includes teaching at the People’s Friendship university in Moscow and multiple assignments in nepal, China and india in the capacity of deputy trade representative as well as deputy representative of gazprom in China. He is with the Eurasian Development Bank since 2006.
E-mail: [email protected]
Alexander Shirov – Candidate of economic sciences, head of laboratory and member of the academic council at iEF ras. His areas of expertise include the analysis and forecasting of the national economy, intersectoral studies, and foreign trade relationships.
E-mail: [email protected]
Andrey Anisimov – Head of a division at the EDB Centre for integration studies. He majored in economics at the st. Petersburg state university. His areas of expertise are economics and economic integration. He has authored a number of publications. E-mail: [email protected]
1 This article has been prepared based on a research conducted from Russia – by Prof. V. Ivanter, RAS member, M. Uzyakov,
D. Kuvalin, I. Frolov, A. Shirov, A. Moiseyev, M. Gusev, A. Yantovskiy, and V. Potapenko, junior research fellow; from Ukraine – by Prof. V. Geets, NASU member, L. Shinkaruk, T. Shinkorenko, and Y. Gerasimova; from the Eurasian Development Bank – E. Vinokurov and A. Anisimov.
INtRoDuCtIoN
the collapse of the soviet union led to the severing of a multitude of economic ties, which exacerbated the crisis of the 1990s. in recent years, the desire to recover from these losses and utilise the surviving industrial and technological potential has driven integration processes in the post-soviet area – this time on the basis of new, market-based principles.
reconstructive integration processes can play an important role in adding impetus to the advancement of the largest post-soviet countries. on the one hand, economic reintegration will produce standard synergistic effects such as reduced transaction costs in bilateral and multilateral cooperation, improved terms of trade and investment exchange, gains from the transnational division of labour, and the creation of new market opportunities. on the other hand, the relative uniformity of the technological arena and the common linguistic and cultural environment allow the mechanisms of interaction between post-soviet countries to be greatly simplified.
the economic growth in almost all post-soviet countries made it possible to develop successful interaction and form the necessary resources that can be used to speed up integration.
in recent years, tangible prerequisites have emerged for the formation and rapid development of an economic union between the region’s countries. in 2010, the Customs union between Belarus, kazakhstan and russia began to operate. seventeen agreements that form the basis of the single Economic space are entering into effect in 2012. in 2015, the sEs states intend to establish the Eurasian Economic union, which other post-soviet countries can join.
the study of fundamental conditions and practical effects of Eurasian integration are an important research and expert objective addressed by the Comprehensive assessment of the Macroeconomic Effects of Various Forms of Deep Economic integration of ukraine and the Member states of the Customs union and the single Economic space2. this survey continued the three-year cooperation between the Eurasian Development Bank, the institute of Economic Forecasting at the russian academy of sciences (iEF ras), and the institute of Economics
and Forecasting at the national academy of sciences of ukraine (iEF nasu)3.
this survey is the most comprehensive analysis of the effects of deep economic integration between the economies of russia, ukraine, kazakhstan and Belarus prepared in the past twenty years.
2 Full version of the report is available at: http://www.eabr.org/r/research/analytics/centre/projects/ukraine/. Please refer to this
link for literature and complete methodology of the project.
3 Scientific and Technological Interaction between Russia and Ukraine: Forecasting Opportunities and Mechanisms for Their
MEtHoDoLoGY
the issues relating to the creation of economic unions between nations are critical elements of long-term economic policies that cannot be implemented without a comprehensive analysis of the consequences of the decisions under consideration. at the same time, there is a palpable lack of the type of work that would provide quantitative assessments of the possible macroeconomic and sectoral effects of the expansion of integration processes in the post-soviet area. in accordance with this, research was carried out to test and produce a numerical estimate for various hypotheses of the possible integration scenarios between the Customs union countries and ukraine.
a quantitative assessment of integration effects of the economic unions of various types and scales is associated with significant theoretical and technical difficulties. Even with respect to European integration, although it has a history of over fifty years, the economic science still lacks uniform approaches to assessing integration effects of the creation and functioning of the European Community. in addition, integration processes in the post-soviet area have their own significant peculiarities.
the key objectives of the research were to determine the status quo and outlooks for the advancement of integration ties between ukraine, russia and russia’s partners within the Customs union and the single Economic space; to develop methodological tools to assist in the selection of the efficient forms and areas for the development of integration processes; and to assess, in a sound and comprehensive manner, the economic effects of ukraine joining the sEs, for ukraine itself and for russia, kazakhstan and Belarus.
Methodologically, the assessment of integration effects was carried out using a model analytical and forecasting set, which includes intersectoral macroeconomic models for russia, ukraine, Belarus and kazakhstan, and a trade model which forms export and import flows in the countries under consideration in their mutual trade and their trade with other countries. Before developing the model analytical and forecasting set a comparative analysis of the existing approaches to the quantitative assessment of integration effects was carried out. these approaches used in the world practice include computable general equilibrium models, gravity models, dynamic input-output models for intersectoral production, and multiple regression models.
the statistics used in the model set are official data from national statistics agencies and international institutions.
and output table are included in a sector of the baseline table or are distributed between several sectors in a certain proportion.
the coefficients for the correspondence matrix (each country had its own matrix) were calculated using the data provided in national accounts, which present the sectoral structure of the economies in the most detailed manner.
in addition, data on foreign trade between the sEs countries and ukraine have been prepared and aligned and the process of the formation of scenario conditions for the forecast has been modelled.
SCENARIo AppRoACH
[image:24.482.34.431.327.613.2]integration effects can be provisionally divided into instant and long-term effects. the first group is connected primarily to the reaction of an economy to a reduction or abolishment of customs barriers. as a rule, instant effects are a change in the volume of foreign trade flows. However, their impact on the economic dynamics discontinues almost completely in a short period of time. instant integration effects are relatively easier to assess because they are directly connected to the historical elasticity of foreign trade flows against changes in table 1.1.
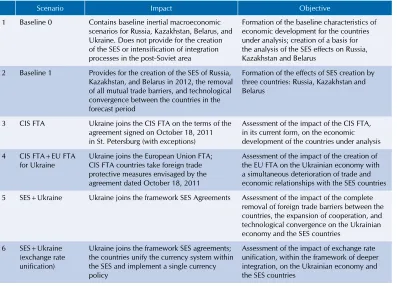
Integration scenarios considered
scenario impact objective
1 Baseline 0 Contains baseline inertial macroeconomic scenarios for russia, kazakhstan, Belarus, and ukraine. Does not provide for the creation of the sEs or intensification of integration processes in the post-soviet area
Formation of the baseline characteristics of economic development for the countries under analysis; creation of a basis for the analysis of the sEs effects on russia, kazakhstan and Belarus
2 Baseline 1 Provides for the creation of the sEs of russia, kazakhstan, and Belarus in 2012, the removal of all mutual trade barriers, and technological convergence between the countries in the forecast period
Formation of the effects of sEs creation by three countries: russia, kazakhstan and Belarus
3 Cis Fta ukraine joins the Cis Fta on the terms of the agreement signed on october 18, 2011 in st. Petersburg (with exceptions)
assessment of the impact of the Cis Fta, in its current form, on the economic development of the countries under analysis
4 Cis Fta+Eu Fta for ukraine
ukraine joins the European union Fta; Cis Fta countries take foreign trade protective measures envisaged by the agreement dated october 18, 2011
assessment of the impact of the creation of the Eu Fta on the ukrainian economy with a simultaneous deterioration of trade and economic relationships with the sEs countries
5 sEs+ukraine ukraine joins the framework sEs agreements assessment of the impact of the complete removal of foreign trade barriers between the countries, the expansion of cooperation, and technological convergence on the ukrainian economy and the sEs countries
6 sEs+ukraine (exchange rate unification)
ukraine joins the framework sEs agreements; the countries unify the currency system within the sEs and implement a single currency policy
customs tariffs. Long-term integration effects are connected to dynamic and structural changes in economies caused by changes in the efficiency parameters, the creation of cooperation ties, and the expansion of markets.
to produce a quantitative assessment of integration effects, several scenarios need to be considered. an analysis and comparison of these calculations make it possible to formulate conclusions on the significance of integration processes for economies.
the possible scenarios of integration in the post-soviet area were calculated using a set of intersectoral macroeconomic models of russia, kazakhstan, Belarus and ukraine developed in the course of research.
the scenarios that have been considered are presented in Table 1.1.
the calculations make it possible to produce an incremental assessment of the effects of integration in the post-soviet area for a number of current scenarios that factor in trade (instant) effects and technological convergence (long-term effects).
SES-3
the calculations suggest that the creation of the single Economic space between russia, kazakhstan and Belarus would have a positive effect on the development of the countries involved. given the existing economic structure, the primary directions of foreign trade relationships, and the scale of the economies, it is expected that the greatest effects will be observed in Belarus.
By the end of the forecast period, exports to the sEs countries are expected to account for up to 35% of Belarusian gDP. By 2030, the gDP gain in this option is forecasted to outrun the baseline by up to 15%. therefore, the calculations show that, in the long run, the success of integration processes in the
post-figure 1.1.
Effects of SES creation on Belarus
a) Belarusian gDP and exports to the sEs ($ trillion) 2011 2013 2015 2017 2019 2021 2023 2025 2027 2029
0 0.02 0.04 0.06 0.08 0.1 0.12
soviet area will be of vital importance to the advancement of the Belarusian economy. the share of mechanical engineering and food processing in the country’s industrial structure is expected to grow.
kazakhstan’s economy remains dependent, to a significant extent, on the dynamics of hydrocarbon production. this situation is largely associated with the fact that kazakhstan continues to enjoy relatively high potential for the expansion of oil and gas production. though increasing, exports to the sEs countries remain at a relatively low level compared to gDP. at the same time, due to technological convergence and a reduction in the energy and material intensity of production, integration processes allow reaching an additional gDP of 4% compared to the baseline scenario by the end of the forecast period. figure 1.1.
Effects of SES creation on Belarus
b) additional increase in Belarusian gDP under the sEs-formation option (2010, $ billion)
2011 2013 2015 2017 2019 2021 2023 2025 2027 2029 0
2 4 6 8 10 12 14 16 18
Exports to the sEs gDP
figure 1.2.
Effects of SES creation on Kazakhstan
a) kazakhstan’s gDP and exports to the sEs, in constant 2010 prices ($ trillion)
2011 2013 2015 2017 2019 2021 2023 2025 2027 2029 0
0.05 0.1 0.15 0.2 0.25 0.3 0.35 0.4 0.45
0 2 4 6 8 10 12 14
2011 2013 2015 2017 2019 2021 2023 2025 2027 2029
the share of mining sectors and metallurgy in the kazakh economy will gradually decline. a rapid growth in the service sector, mechanical engineering, transportation and communications will result in the growth of their respective shares in gross output.
as the scale of the russian economy cannot be compared with those of other sEs countries, integration processes in the post-soviet area are not expected to produce a determining impact on the dynamics of russian gDP. in addition, the gradual devaluation of the Belarusian rouble, against the backdrop of increasing energy prices, will have an additional adverse effect on the trade and economic relationships within the sEs (first and foremost, on the trade between russia and Belarus).
figure 1.2.
Effects of SES creation on Kazakhstan
b) additional increase in kazakhstan’s gDP under the
sEs-formation option (2010, $ billion)
Exports to the sEs gDP
figure 1.3.
Effects of SES creation on Russia
a) russian gDP and exports to the sEs, in constant 2010 prices ($ trillion)
0 0.5 1 1.5 2 2.5 3 3.5 4
2011 2013 2015 2017 2019 2021 2023 2025 2027 2029
20 30 40 50 60 70 80 90
10
0
2011 2013 2015 2017 2019 2021 2023 2025 2027 2029
figure 1.3.
Effects of SES creation on Russia
b) additional increase in russian gDP under the sEs-formation option (2010, $ billion)
the development of integration ties will allow russia to reap an additional annual gain of more than 2% of the baseline gDP by the end of the forecast period.
the three countries’ cumulative gain from the formation of the sEs, compared
to the non-integration scenario, is shown in Figure 1.4. as for the aggregate
gDP of the sEs countries, the difference between the options is expected to exceed 2.5% by 2030. in 2030, the gDP gain over the baseline option is expected to reach $75 billion for russia (in 2010 prices), $13 billion for kazakhstan, and $14 billion for Belarus. From 2011 to 2030, the cumulative effect of the development of integration ties can be estimated at $632 billion (in 2010 prices) for russia, $106.6 billion for kazakhstan, and $170 billion for Belarus.
Exports to the sEs gDP
figure 1.4.
Integral effect of SES creation on Russia, Kazakhstan and Belarus
(additional increase in the three countries’ aggregate gDP over the baseline scenario,
% of gDP) 0 0.5 1 1.5 2 2.5 3
%
uKRAINE, SES-3 AND ftA, SES-4
the baseline scenario for the development of the ukrainian economy assumes that the key trends of the economic development observed in recent years will continue.
the main problem, which ukraine is expected to encounter in the baseline scenario, is that, given the growing energy prices4, the necessary level of competitiveness of producers can only be maintained if energy intensity is reduced in an accelerated manner. a radical reduction in energy intensity requires, in turn, large investments. revenue losses against the backdrop of rising costs maintain the relatively low fixed capital accumulation rates. at the same time, production growth is restricted because of the gradual retirement of “old”, idle capital. therefore, the economy faces an acute problem of limited capital. nevertheless, the remaining potential to achieve growth using ageing facilities enables the ukrainian economy to demonstrate higher economic growth than Belarus, which is experiencing an acute deficit of fixed capital.
table 1.2.
Average annual growth rates of ukrainian GDp and the main components of the end demand (in constant prices,%)
Source: Calculations by iEF ras and iEF nasu
2011-2015 2016-2020 2021-2025 2026-2030
Household consumption 6.1 5 4.3 3.6
government consumption 2.7 2.4 2 1.7 investments in fixed capital 11 8.5 7.2 5.1
Export 4.1 4.1 4.2 4.3
import 8.4 7 5.7 4.3
gDP 4.4 3.8 3.9 3.6
4 A “window of opportunity” associated with the extension of various energy price discounts to Ukraine will unavoidably
close following Russia’s transition to the principle of equal return on natural gas supplies to the domestic and foreign markets (in this scenario, taking place in 2015).
it should be noted that while the lack of significant changes to the structure of the economy causes a slowdown in economic growth, it is impossible to accelerate the growth in output in exporting sectors. ukrainian gDP in the baseline scenario is expected to drop in the long term from 4.4% in 2010-2015 to 3.6% in 2025-2030.
as (in the scenario under consideration) ukraine joins neither the European union Free trade area nor the single Economic space, slower growth in exports is expected to have a significant effect on its economy as a whole.
coal in ukraine’s energy balance, the energy intensity of production is reduced
and domestic production grows to 30 billion m3. oil imports are forecasted to
increase by 50% on 2010 to 23 million tonnes (see table 1.3). the country’s higher dependence on energy imports is expected to boost growth in capital investments aimed at the modernisation of production facilities and at reducing energy intensity.
table 1.3.
production and import of energy resources in ukraine
(baseline scenario)
Source: Calculations by iEF ras and iEF nasu
2010 2015 2020 2025 2030
oil (million tonnes)
Production 4 5 5 5 5
import 8 9 9 10 10
Share of imports in domestic consumption 64.7% 66.3% 65.5% 67.6% 67.9%
Gas (billion m3)
Production 20 26 28 29 30
import 37 37 38 39 43
Share of imports in domestic consumption 65.2% 59.2% 57.3% 57.4% 58.9%
Coal and peat (million tonnes)
Production 56 62 68 75 82
import 12 15 18 20 21
Share of imports in domestic consumption 17.8% 19.3% 21% 21.4% 20.7%
Electric power (billion kWh)
Production 193 220 245 264 276
import 2 2 2 2 2
Share of imports in domestic consumption 1.1% 1% 0.9% 0.8% 0.8%
traditional exporting industries continue to account for a high share in the ukrainian economy. the baseline scenario is premised on rather high rates of agricultural growth (up to 4-5% a year), which is expected to make agriculture to account for approximately 7.4% of the ukrainian gross output by the end of the forecast period. the shares of metallurgy and chemical production also remain high.
to assess the impact of intercountry trade on economic development, estimates were generated for a number of scenarios that differ in terms they envision for ukrainian integration with the sEs countries.
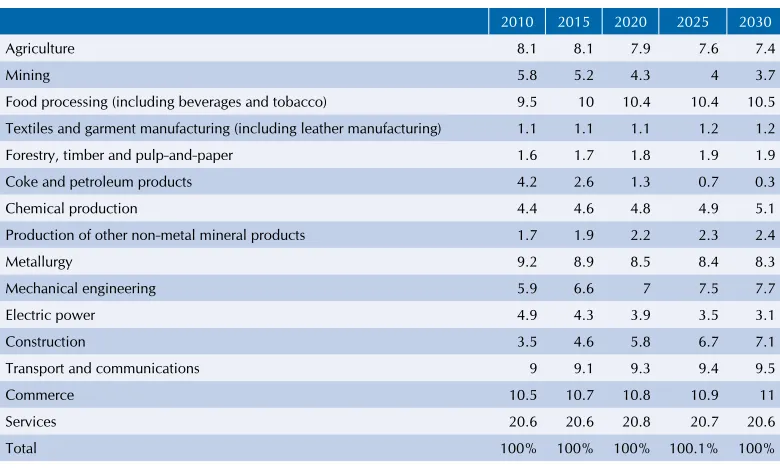
table 1.4.
Sectoral composition of the ukrainian economy in constant prices
(% of gross output)
Source: Calculations by iEF ras and iEF nasu
2010 2015 2020 2025 2030
agriculture 8.1 8.1 7.8 7.6 7.4
Mining 5.8 5.4 5 4.7 4.5
Food processing (including beverages and tobacco)
9.5 9.9 10.1 10.2 10.2
textiles and garment manufacturing (including leather manufacturing)
1.1 1.1 1.1 1.1 1.2
Forestry, timber and pulp-and-paper 1.6 1.7 1.8 1.8 1.9
Coke and petroleum products 4.2 2.8 1.7 1 0.5
Chemical production 4.4 4.5 4.7 4.8 5
Production of other non-metal mineral products
1.7 1.9 2.1 2.3 2.4
Metallurgy 9.2 8.7 8.5 8.3 8.2
Mechanical engineering 5.9 6.5 6.9 7.3 7.6
Electric power 4.9 4.5 4.2 3.9 3.7
Construction 3.5 4.6 5.7 6.6 7
transport and communications 9 9.1 9.2 9.2 9.4
Commerce 10.5 10.7 10.7 10.8 10.8
services 20.6 20.6 20.5 20.4 20.3
total 100% 100% 100% 100% 100%
table 1.5.
Change in key macroeconomic indicators compared to the baseline option
(scenario envisioning ukraine joining the Cis Fta, with exceptions; % of baseline volumetric indicators)
Source: Calculations by iEF ras
russia 2015 2020 2025 2030
Export 0.01 0.01 0.01 0.01
import 0 0 0 0.01
gDP 0 0 0 0
kazakhstan 2015 2020 2025 2030
Export 0 0 0.01 0.01
import 0 0 0.02 0.02
gDP 0 0 0 0
Belarus 2015 2020 2025 2030
Export 0.04 0.04 0.04 0.04
import 0 0 0 0
gDP 0.02 0.02 0.02 0.02
ukraine 2015 2020 2025 2030
Export 2.38 2.07 1.77 1.51
import 0 0 0.03 0.05
two countries and ukraine is in the sectors where the levels of trade barriers remain virtually constant. Belarus’ exports and its gDP are expected to grow insignificantly. the most significant gain is forecasted for ukraine’s production, with gDP outpacing the baseline option by an average of 0.5%.
[image:32.482.102.426.228.453.2]thus, an unequivocal conclusion is that if ukraine joins the Cis Fta with exceptions across a number of key sectors this is not expected to have a significant effect on trade and economic relationships in the post-soviet area. in essence, this option could be deemed the preservation of its status quo with an insignificant positive effect from lifting certain barriers to trade with the Cis countries.
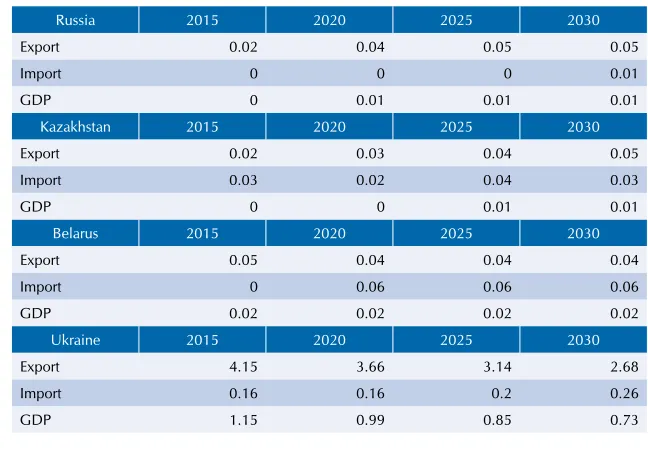
table 1.6.
Change in key macroeconomic indicators compared to the baseline option
(scenario envisioning ukraine joining the sEs; only effects of improvements in trade with the sEs countries; % of baseline volumetric indicators)
Source: Calculations by iEF ras
russia 2015 2020 2025 2030
Export 0.02 0.04 0.05 0.05
import 0 0 0 0.01
gDP 0 0.01 0.01 0.01
kazakhstan 2015 2020 2025 2030
Export 0.02 0.03 0.04 0.05
import 0.03 0.02 0.04 0.03
gDP 0 0 0.01 0.01
Belarus 2015 2020 2025 2030
Export 0.05 0.04 0.04 0.04
import 0 0.06 0.06 0.06
gDP 0.02 0.02 0.02 0.02
ukraine 2015 2020 2025 2030
Export 4.15 3.66 3.14 2.68
import 0.16 0.16 0.2 0.26
gDP 1.15 0.99 0.85 0.73
in the scenario that envisions ukraine joining the single Economic space without exceptions, the gDP gains for russia and kazakhstan are expected to be more appreciable than those under the scenario envisioning the creation of the Cis Fta. in this scenario, Belarusian gDP is expected to remain almost unchanged compared to the scenario envisioning ukraine’s partial joining the sEs. For ukraine itself, the impact on gDP is expected to increase by approximately 50% compared to the previous scenario because of price reductions, lower production costs and increased exports of metallurgical and agricultural products (see table 1.6).
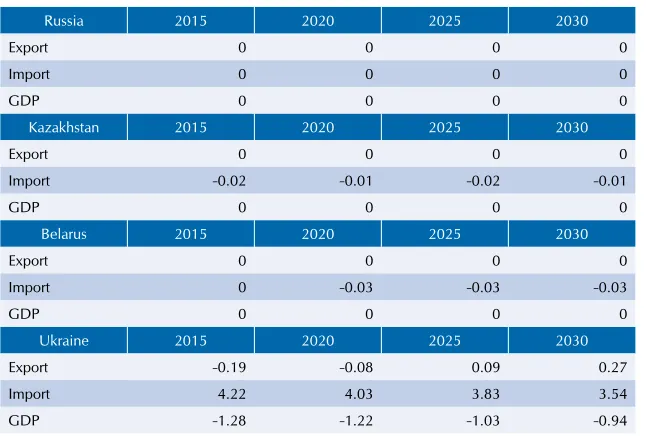
union. this assumes the reciprocal lifting of customs duties between ukraine and the Eu countries. at the same time, the sEs countries are expected to establish customs duties for ukraine at the levels that are used in trade with European countries. ukrainian exports to the Eu are forecasted to grow by 10% and imports from the Eu by 15%.
the trade turnover between the sEs countries and ukraine is forecasted to decrease by approximately 2.5%. Compared to the baseline scenario, this option forecasts lower economic growth for russia, kazakhstan and Belarus, triggered by a decline in exports to ukraine. ukrainian gDP is also expected to be lower than in the baseline scenario because of a reduction in exports to the sEs countries and a growth in imports from the Eu, which is expected to exceed the increases in exports to the Eu (see table 1.7).
the main adverse effects on the ukrainian economy are expected to be caused by:
• a reduction in the aggregate exports of mechanical engineering products;
• the impossibility, because of limited industrial capacity, to accelerate growth in production and in the export of metallurgical, chemical and agricultural products;
• continued dependence on the importation of energy commodities from the
[image:33.482.57.381.393.611.2]sEs countries, in a situation characterised by the low price elasticity of consumption; in other words, expenditures of the ukrainian economy on energy resources are expected to grow significantly.
table 1.7.
Change in key macroeconomic indicators compared to the baseline option
(scenario envisioning ukraine’s joining the Eu Fta;
% of baseline volumetric indicators)
Source: Calculations by iEF ras
russia 2015 2020 2025 2030
Export 0 0 0 0
import 0 0 0 0
gDP 0 0 0 0
kazakhstan 2015 2020 2025 2030
Export 0 0 0 0
import -0.02 -0.01 -0.02 -0.01
gDP 0 0 0 0
Belarus 2015 2020 2025 2030
Export 0 0 0 0
import 0 -0.03 -0.03 -0.03
gDP 0 0 0 0
ukraine 2015 2020 2025 2030
Export -0.19 -0.08 0.09 0.27
import 4.22 4.03 3.83 3.54
the formation of the single Economic space means not only the expansion of intercountry trade, but also deeper industrial cooperation between the enterprises of the countries involved. in addition, the lifting of customs barriers is expected to encourage competition among post-soviet enterprises that are roughly equivalent in terms of their capacity and potential. all this will stimulate technological convergence between the economies, which will lead, inter alia, to an equalisation of the indicators of energy and material intensity and to the attainment of closer productivity in terms of the utilisation of primary resources. this scenario assumes that the energy and material intensity of the ukrainian economy will decline at faster rates, levelling off at the standard of the currently more advanced russian economy. this will cause a reduction in energy consumption and, therefore, lower dependency on energy imports. in addition, lower production costs are expected to enhance opportunities for reducing prices for the purposes of stimulating demand and higher production. the same factor conditions the additional growth in exports.
table 1.8.
Change in key macroeconomic indicators compared to the baseline option
(scenario envisioning ukraine’s joining the sEs and technological convergence; % of baseline volumetric indicators)
Source: Calculations by iEF ras
russia 2015 2020 2025 2030
Export 0.03 0.1 0.1 0.1
import 0 0 0 0.01
gDP 0 0.01 0.01 0.01
kazakhstan 2015 2020 2025 2030
Export 0.03 0.05 0.07 0.08
import 0.03 0.02 0.04 0.03
gDP 0 0.01 0.01 0.01
Belarus 2015 2020 2025 2030
Export 0.15 0.34 0.39 0.41
import 0 0.06 0.06 0.06
gDP 0.06 0.15 0.18 0.2
ukraine 2015 2020 2025 2030
Export 4.35 4.35 3.73 3.09
import -2.19 -5.7 -5.41 -5.28
gDP 2.81 5.94 6.65 6.57
in this scenario, the ukrainian economy is expected to see the greatest effects, as the impact of technological convergence within the sEs was already factored in the baseline scenario envisioning the unification of russia, Belarus and kazakhstan.
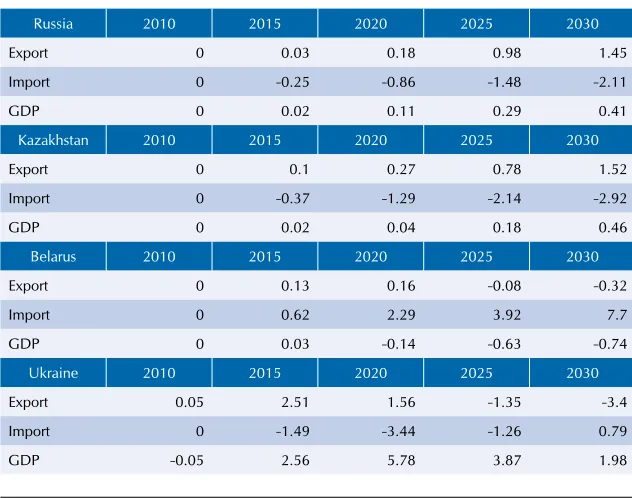
risks of the member states in mutual trade. on the other hand, advantages in bilateral trade will become impossible if a national currency devaluates. at first glance, currency integration seems less advantageous to the net importers of energy resources who cannot offset the trade balance deficit with changes in exchange rates. thus, it is important to understand whether the effects of the lifting of customs duties and enhanced industrial cooperation will offset the losses associated with the need to use a unified currency system. the estimates generated for this scenario, which encompasses all of the aforementioned factors, indicate that the ukrainian economy will preserve its gain, though lower compared to the baseline scenario. given that by 2030 the positive impact of these effects on Belarusian gDP is expected to reach approximately 6% of the baseline gDP, it can be asserted that, in the long term, joining the single Economic space with the unification of the currency system will yield a greater gain than that offered by the scenario envisioning the independent setting of exchange rates.
[image:35.482.57.373.317.566.2]these forecasts reflect the existing integration risks associated with the formation of a single currency and financial system in the post-soviet area (see table 1.9).
table 1.9.
Change in key macroeconomic indicators compared to the baseline option
(scenario envisioning ukraine’s joining the sEs with a unified currency system and technological convergence; % of baseline volumetric indicators)
Source: Calculations by iEF ras
russia 2010 2015 2020 2025 2030
Export 0 0.03 0.18 0.98 1.45
import 0 -0.25 -0.86 -1.48 -2.11
gDP 0 0.02 0.11 0.29 0.41
kazakhstan 2010 2015 2020 2025 2030
Export 0 0.1 0.27 0.78 1.52
import 0 -0.37 -1.29 -2.14 -2.92
gDP 0 0.02 0.04 0.18 0.46
Belarus 2010 2015 2020 2025 2030
Export 0 0.13 0.16 -0.08 -0.32
import 0 0.62 2.29 3.92 7.7
gDP 0 0.03 -0.14 -0.63 -0.74
ukraine 2010 2015 2020 2025 2030
Export 0.05 2.51 1.56 -1.35 -3.4
import 0 -1.49 -3.44 -1.26 0.79
gDP -0.05 2.56 5.78 3.87 1.98
as regards mutual trade in energy commodities kazakhstan and russia will clearly remain net exporters in the foreseeable future and ukraine and Belarus net importers.
in the context of the existing trade and economic relationships it appears that integration will not have a significant effect on trade in primary commodities. the distribution of product flows from these sectors in trade within the sEs and between the sEs and third countries will depend on demand. it should be assumed that, in the foreseeable future, the production capacities in the primary sectors will continue to significantly exceed domestic demand in post-soviet countries. this will keep sectors such as metallurgy, chemical production, and fuel and energy export-oriented.
a more complex and pressing task is to provide scenarios for mutual trade in high value-added products, primarily mechanical engineering products. at present, 70-90% of all mechanical engineering products are imported to the sEs countries and ukraine from other countries. in 2010, russia imported 92% of all of its mechanical engineering products from third countries, ukraine 83%, Belarus 75%, and kazakhstan 72%.
the high share of third countries in equipment imports by the sEs countries and ukraine is explained primarily by the gap in technological development and efficiency of their mechanical engineering sectors.
in terms of energy intensity of gDP, russia lags significantly behind Europe. in 2010, russia’s energy expenditures per $1 of gDP (in constant 2005 prices recalculated to reflect purchasing power parity) were almost 300% higher than those of European oECD countries. importantly, these are the countries that are the main suppliers of mechanical engineering products to the sEs countries and ukraine.
table 1.10.
Assessment of the gap in economic efficiency and scientific and technological development compared to the oECD countries
(Europe, times)
Source: Eia, calculations by iEF ras
2010 2020 2030
russia 3.7 2.7 2.5
kazakhstan 4.3 2.9 2.5
Belarus 4.9 3.2 2.5
ukraine 5.4 3 2.5
5 http://www.eia.gov
the forecasts of the us Department of Energy5 and iEF ras for the productivity
in assessing the possible development of trade in mechanical engineering products it can be assumed that mutual trade in these goods between the sEs countries and ukraine has potential to replace imports from third countries to the extent to which the scientific and technological gap can be bridged. in other words, bridging this gap would mean that the sEs countries and ukraine will be able to reduce the share of imports of mechanical engineering products from third countries.
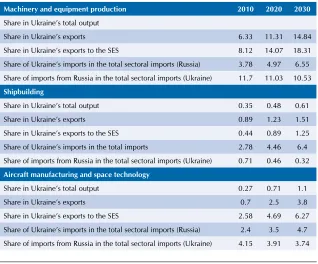
table 1.11.
Assessment of integration effects at the sectoral level6
(%)
Source: Calculations by iEF ras
Machinery and equipment production 2010 2020 2030
share in ukraine’s total output
share in ukraine’s exports 6.33 11.31 14.84 share in ukraine’s exports to the sEs 8.12 14.07 18.31 share of ukraine’s imports in the total sectoral imports (russia) 3.78 4.97 6.55 share of imports from russia in the total sectoral imports (ukraine) 11.7 11.03 10.53
Shipbuilding
share in ukraine’s total output 0.35 0.48 0.61 share in ukraine’s exports 0.89 1.23 1.51 share in ukraine’s exports to the sEs 0.44 0.89 1.25 share of ukraine’s imports in the total imports 2.78 4.46 6.4 share of imports from russia in the total sectoral imports (ukraine) 0.71 0.46 0.32
Aircraft manufacturing and space technology
share in ukraine’s total output 0.27 0.71 1.1 share in ukraine’s exports 0.7 2.5 3.8 share in ukraine’s exports to the sEs 2.58 4.69 6.27 share of ukraine’s imports in the total sectoral imports (russia) 2.4 3.5 4.7 share of imports from russia in the total sectoral imports (ukraine) 4.15 3.91 3.74
6 Structural indicators are calculated in constant prices.
it should be noted that the positive trade and economic relationships between russia and ukraine would provide potential for a significant intensification of interaction in developing mechanical engineering. For example, the supply of ukrainian aircraft engines will remain vital for russian helicopter manufacturers at least through 2017-2018. the available alternative – the construction of factories in russia – involves high financial and technological risks.
in the area of aircraft manufacturing, the antonov Design Centre has engineering potential and competencies that russian manufacturers lack. Moreover, the massive production of aircraft designed in ukraine is currently impossible without russian parts and assembly sites.
in addition, a great deal of the defence and dual-purpose equipment that is currently in use in the sEs countries features ukrainian-made parts. the servicing of this equipment will also contribute to the on-going cooperation in the mechanical engineering sector. However, these ties can only be maintained and advanced if new types of equipment are created. the development of cooperation in aircraft manufacturing will boost turnover in the sector. By 2030, the share of aircraft equipment in ukraine’s exports to the sEs could reach 7%.
given the deficit in the shipbuilding production capacities, as well as the country’s dominant positions in the post-soviet area in the development and manufacture of gas-turbine engines for navy, commercial, and passenger vessels, there are significant prospects for cooperation in the shipbuilding sector. By 2030, the share of shipbuilding products in ukrainian exports to the sEs countries is expected to grow to 1.2%.
as for machinery and equipment production, ukraine’s main opportunities are associated with the utilisation of its potential to develop power engineering and with the development and manufacture of equipment for the production and transportation of natural resources, conventional weapons, and military equipment. additional opportunities for the development of mechanical engineering can arise following the rollout of production focused on the sEs markets and providing industrial assembly and subsequent localisation. the most promising areas are the production of investment equipment, construction machinery and equipment, agricultural equipment, and rolling stock. the utilisation of the existing mechanical engineering potential, combined with the launch of industrial assembly projects, can increase the share of mechanical engineering in ukraine’s exports to the sEs countries to 20% by 2030.
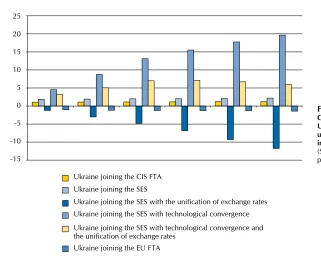
High export growth is also expected in the scenario where ukraine forms a free trade area with the Eu; however because of the significant increase in imports and a reduction in exports to the sEs countries in this case ukrainian gDP is expected to dip slightly.
[image:39.482.66.387.358.614.2]a significant increase in gDP is typical of the scenarios that provide for technological convergence. Export growth is expected in the scenarios envisioning ukraine’s joining the sEs or the Eu Fta. the scenario envisioning the fixing of the exchange rate entails significant negative effects for the ukrainian economy because of worsened balance of payments. in essence, this prompts the necessity to invest in improvements to economic efficiency, first and foremost in reducing the energy intensity of production. otherwise, a mechanism must be envisioned for the transfer of capital flows within the sEs in order to minimise distortions in the balance of trade and payments. the proposed scenarios suggest that the main criteria for improving the gDP dynamics when selecting customs policies are associated with the expansion of markets for manufacturers and a reduction in expenditures on raw materials and energy commodities through the introduction of new technologies and a reduction in the share of customs payments in their cost. For this reason, ukraine joining the sEs appears to be a more advantageous option compared to the scenario envisioning the formation of a free trade area with the Eu, because it affords ukrainian industries more competitive advantages in the contemplated
figure 1.5.
Changes in ukrainian GDp under various integration scenarios
($ billion, 2010 prices) -15
-10 -5 0 5 10 15 20 25
ukraine joining the Cis Fta ukraine joining the sEs
ukraine joining the sEs with the unification of exchange rates ukraine joining the sEs with technological convergence ukraine joining the sEs with technological convergence and the unification of exchange rates