Role of Financial and Technology
Inclusion, Remittances and Exports
vis-à-vis growth: A study of Nepal
Kumar, Ronald R.
University of the South Pacific
2 November 2011
Online at
https://mpra.ub.uni-muenchen.de/38850/
Role of Financial and Technology Inclusion, Remittances and Exports vis-à-vis growth: A study of Nepal
Ronald Ravinesh Kumar School of Economics Faculty of Business & Economics
University of the South Pacific kumar_rn@usp.ac.fj
Abstract
Using the ARDL Bounds approach to cointegration technique, we explore the role of financial services, information and communications technology, remittance inflows and export liberalisation in Nepal over the periods 1975-2010. The results show that financial development, telecommunications, remittance inflows and export orientation are instrumental in improving income level both in the long and short-run, although in the latter, the effects from financial and technology inclusion and remittances have lagged negative effects. Consequently, we propose besides the need for stable macroeconomic and sound institutional structures, policies targeted towards greater financial viz. technology inclusion, investment in and integration of technology across sectors, encouraging greater remittance inflows through sound labour mobility schemes, export promotion strategies focussed towards not only addressing supply side constraints but also strengthening trade partnership at regional and international fronts as a crucial way forward to establishing a new economic order for a new Nepal.
Keywords: Information and communications technology; financial development; trade
Role of Financial and Technology Inclusion, Remittances and Exports vis-à-vis growth: exploring a new economic order for a new Nepal
Abstract
Using the ARDL Bounds approach to cointegration technique, we explore the role of financial services, information and communications technology, remittance inflows and export liberalisation in Nepal over the periods 1975-2010. The results show that financial development, telecommunications, remittance inflows and export orientation are instrumental in improving income level both in the long and short-run, although in the latter, the effects from financial and technology inclusion and remittances have lagged negative effects. Consequently, we propose besides the need for stable macroeconomic and sound institutional structures, policies targeted towards greater financial viz. technology inclusion, investment in and integration of technology across sectors, encouraging greater remittance inflows through sound labour mobility schemes, export promotion strategies focussed towards not only addressing supply side constraints but also strengthening trade partnership at regional and international fronts as a crucial way forward to establishing a new economic order for a new Nepal.
Keywords: Information and communications technology; financial development; trade
openness; remittances; Nepal.
1. Introduction
Nepal, a landlocked and predominantly an agrarian economy, is one of the least developing countries in the South Asian region and is classified as one of the poorest countries in the world. The population growth in the country has averaged around 2 percent with a total population close to 30 million people, and per capita income of USD 524 in 2010. The economy’s GDP is growing at a rate of 4.5 percent on an annual basis over the last decade and inflation in 2010 was 10 percent (World Bank, 2010).
Poverty has remained rampant and deprivation widespread but there is a definite shift in the economy with pronounced growth in the secondary sector. Centralization in the capital Kathmandu of both government and private structures, over dependence on foreign aid, widespread corruption and abuse of authority by bureaucrats and politicians, exclusion of large sections of population from devising policy and programs for development and failure of donors to ensure proper use of funds have adversely impacted the pro-poor growth prospects (Sharma, 2007; ADB, 2009).
There are signs of growth in some critical (services) sectors of the economy. These includes growth in financial services, (growth in domestic credit to private sectors), trade and exports of goods and services, ICT (telecommunications and mobile phone services) and remittance inflows as a result of increase in migration and employment demand abroad for close to 1.6 million (unskilled and semi-skilled) Nepalese in close to 107 countries around the globe (ADB, 2010; Gaudel, 2006). Besides, the large inflow of remittances has also supplemented the domestic savings in meeting the country's investment requirements. The major destination of the Nepalese labour force are Malaysia, Qatar, Saudi Arabia and United Arab Emirates which absorb more that 93 percent of the labour force migrated from Nepal (Pant, Pandey and Rahut, 2011).
Nepal began to move towards an open, market oriented economy in the mid-1980s with the adoption of policies involving greater liberalization of the domestic economy and trade. The interest rate spread in Nepal has been among the lowest in the South Asian region in order to support growth in investment through lowering the cost of borrowings. Moreover, the country has under taken substantial reforms in the financial sector, which led to more than three-fold increase in the credit to GDP ratio since 1985 (ADB, 2009).
The balance of the paper is divided as follows. Firstly, to set the scene, a brief literature on, financial development, ICT, trade and remittances vis-à-vis economic growth is provided. Secondly, a section on snapshot of sectoral trends and pattern are provided. The third and fourth sections are on data and method, and results respectively. Finally, conclusion and some ensuing policy matters are put forth.
2. A brief literature survey
In a recent book on modern economic growth, Acemoglu (2009) has provided a comprehensive view on economic growth and development. Under the modern growth paradigm, he provides a theoretical justification of the role of various instrumental factors which support growth. Therefore, besides the crucial role of labour and capital stock in the production function, other contemporary variables describing the structural changes and transformations include, inter-alia, changes in the composition of production and consumption, that is, the shift from agriculture to industry and to services, urbanization, financial development, changes in inequality of income and inequality of opportunity, the transformation of social and living arrangements, technological diffusion, financial institutions, changes in internal organization of firms and the demographic transitions, can be crucial drivers of productivity and growth in an economy.
2.1 Remittances
Remittance inflows are one of the financial flows referring to the private income or savings from income earned that are transferred from one or more family members living and working abroad back to the family members in the home country (Chami, Cosimano, and Gapen 2006). Over the last four decades, remittances have surpassed official development assistance (ODA) of developing countries (World Bank 2011).
2006; Browne and Leeves 2007; Buch and Kuckulenz 2010; De Haas 2005; Gaudel, 2006; Maclellan and Mares 2005; Ratha 2007; Sen 1999; UNESCAP 2010).
For example, Ahmed, in a study, Sugiyarto and Jha (2011) examines the micro and macro level impact of remittances in Pakistan. Similar to Siddiqui and Kemal (2006), they show that reduction in remittances will reduce GDP, investment and household consumption, which in turn will increase poverty level and that households who receive remittances tend to be better off and their probability of becoming poor decreases by 12.7 percent.
Suleri and Savage (2006) in their research on remittances and natural disasters in Pakistan conclude that: remittances can make people less vulnerable to natural disasters since households with international migrants tends to be better able to make investments in better housing; remittances receiving households are more resilient to natural disasters; remittances received when shared outside the household tend to have a positive multiplier effects; remittance flows are highly vulnerable to the infrastructure damage that occurs during disasters; and irrespective of the ways remittances are received (formal or informal), the role of a quality telecommunication, finance and local transport services are critical determinants of smooth flow of remittances. Moreover, the role of aid and donor agencies in improving remittance-dependent infrastructure is extremely important in order to secure reliable, timely and consistent transfer remittances as an alternative source of capital inflows in times of emergencies and crisis. Evidently, improvement in remittance transfer infrastructure have played critical role in this regard in many South Asian countries (Kock and Sun 2011).
have a long-run positive effect, however, in the short-run, the impact is negative. In separate studies, Gaudel (2006) and Srivastava and Nagendra (2007) underscores the role of remittances in Nepal’s economic development.
Migrants use a number of services to remit money to their relatives back home. Among the most commonly used formal means of sending remittances are the: automated teller machines (ATM), Western Union money transfer services and bank draft facilities. However, in many developing countries, particularly where the financial services and basic infrastructure are not well developed to support efficient and reliable transactions, the cost of transferring money are high and risky (Ratha and Riedberg 2005). According to Irving, Mohapatra and Ratha (2010), the factors influencing remittance transfer includes: the number of competitors (service providers), which depends on the size of that particular remittance corridor and legal regulations; the cost of remittance providers, which depends on the method and technology available to them for use; the needs and preferences of customers; and the extent to which consumers are aware of the various choices of services available to them. Further, the preferences of customers are equally dependent on the availability and accessibility of existing remittance-transfer services, the selection of which are largely based on the speed, the needs at the destination, and the sender’s legal status .
Remittances in Nepal have affected consumption patterns differently for lower class or poor households than the middle or rich ones. The poor households use remittance income to fulfil their basic needs (consumption, housing, education, health care and paying off debts) while the rich ones spend on travelling abroad, capital projects and entrepreneurial activities (Gaudel, 2006). The flow of remittances in Nepal has not only increased in size but also has a poverty reducing effect (Riester, 2010; Sharma, 2007). In a broader context, Gaudel finds that remittance inflows have equally improved the nominal GDP in Nepal besides providing a stable source of foreign exchange earnings.
remittances have welfare enhancing effect (improvement in livelihood, health and education and savings), a more effective use of remittances is needed to scale-up the benefits.
The remittance sending approach used by migrant workers in Nepal is characteristically better relative to other developing countries. As described by Gaudel, remittance transaction companies cannot receive cash directly from the Nepalese workers working abroad. The workers have to deposit their remittances in a commercial bank account and then the transaction company through its account delivers the remittances to the recipient at the cheapest cost (about 1 percent of remittance income). There is also the Hundi system facilitating Nepalese migrants in Japan and Korea. Remittance transfer services are also provided by Western Union, IME and Prabhu Money Transfers companies in Nepal (Gaudel, 2006). Moreover, Gaudel highlights that of these agencies, more than 200 sub-agent including banks, finance companies, trading concerns, and enterprises have been opened in five Development Regions of Nepal to facilitate remittance transfers and that some migrants who do not have bank accounts use the option of group sending where they send money to a single account and spilt the money when they return home.
2.2 Financial development
A substantial body of literature exists in support of the role of financial development as critical contributor to economic growth (King and Levine 1993; Beck, Levine and Loyaza 2000; and Levine, Loayza and Beck 2000). Kar, Peker, and Kaplan (2008), using Turkey as case study find trade liberalization, financial development and the interaction between the two have positively contributed to economic growth in the long term. Hassan, Sanchez and Yu (2011) find two-way causality relationship between finance and growth for most regions and one-way causality from growth to finance for the two poorest regions. Some recent studies also attempted to link remittances, aid and foreign direct investment to financial development and income while arguing that although remittances have a marginal contribution to economic progress, it is a reliable source of capital inflow for many small and developing countries for countries like India, Pakistan, Philippines, Fiji, Samoa, Tonga and Vanuatu (Jayaraman, Choong and Kumar 2011a; 2011b; 2010; 2009; Kumar, Naidu and Kumar, 2011; Kumar 2011a,b).
A well cited study by Wacziarg and Welch (2008) show that trade liberalization has resulted in higher growth for many countries, and those which experienced negative or no effect were mainly due to political instability, unfavourable macroeconomic policies, or high protection barriers. Winters, McCulloch and McKay (2004) argue that trade liberalization, if managed properly, can be an important component of a pro-poor development strategy.
The amount of exports and imports of goods and services, besides other factors are important determinant of the level of trade openness in an economy. Moreover, with high trade intensity, an economy also realises benefits from comparative advantage since through international trade a country will import those goods and services that are costly to produce at home and export the goods and services which they can efficiently produce (Frankel and Rose, 2000). Noting this, Rose (2004) lists seven indicators of trade policy. These include: openness measured by the ratio of trade (imports and exports) as a percent of GDP, imports as a percent of GDP; trade flows adjusted for country-characteristics; tariffs; non-tariff barriers; informal or qualitative measures; composite indices; and measures based on price outcomes.
However, for trade liberalization to be supportive of growth, an economy’s trade profile which includes the intra-regional trade, relative dependence on imports, exports and trade with developed markets, trade balance as a share of GDP and the time it takes to complete trade procedures are all crucial determinants (UNESCAP 2011).
In a study by Sharma and Bhandari (2005) on Nepal’s economy viz. foreign trade, they find
exports play a critical role in development process and therefore the need to consider evaluating the import substitution strategy which is supposed to be applicable to efficient industries, and ensuring a proper mix of import substitution and export orientation policies are in place to boot exports.
2.4 Information and communication technology and telecommunications (ICT)
tourism besides other services (linked) sectors (Sheldon, 1997). Moreover, the growth in ICT has exacerbated economic activity and reduced transaction costs thus providing economies of scale. Koutroumpis (2009) finds a causal positive link between broadband infrastructure and growth particularly in the presence of a critical mass infrastructure.
Notably, investment in ICT has the potential to develop the economy through increasing labour productivity (Katz, 2009). Advancement in broadband infrastructure results in scale-up effect on overall growth by providing inter- and across- sectoral productivity and efficiency gains, greater choice and connectivity to economic agents (consumers, producers, governments among others) and improvement in the quality of (goods and) services (Porter 2001; Jalava and Pohjola 2008; Buhalis and Law 2008; Kuppusamy et al 2009; Venturini 2009).
Horscroft (2010) highlights that, countries which are sea locked and geographically isolated from large business centers constraining key economic operations, ICT sector has an immense potential to integrate business operations and have significant spill over benefits for other industries which are directly or indirectly linked. However, Minges and Gray (2004) highlight that the lack of infrastructure often pulls back advancement and results in slow development in the ICT sector.
Kumar and Kumar (2012) and Kumar (2011c) show that information and communications technology are instrumental to long term economic development of small and developing countries like Fiji which is experiencing rapid growth in urbanisation besides sectors such as tourism, finance and technology. Minghetti and Buhalis (2010) contend that the nexus between ICT and tourism supports virtually all practical aspects of doing business and narrows the digital divide.
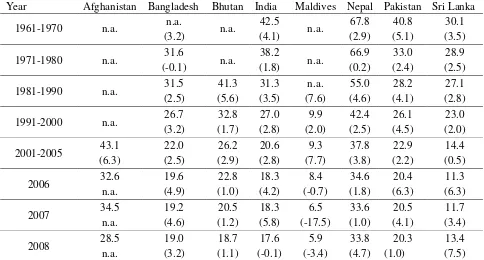
Nepal is still predominantly agrarian economy with close to a third of the GDP share attributed to agriculture (Table 1).
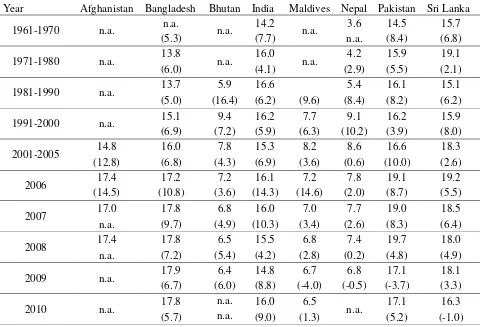
Manufacturing share of GDP is low for all South Asian countries (Table 2), which is a clear indication of low foreign direct investment and lack of pre-investor environment. Using the year 2007 as a reference point, Bhutan (6.8 per cent), Maldives (7.0 per cent) and Nepal (7.7 per cent) have less than 10 percent of manufacturing values added as a share of their respective GDPs.
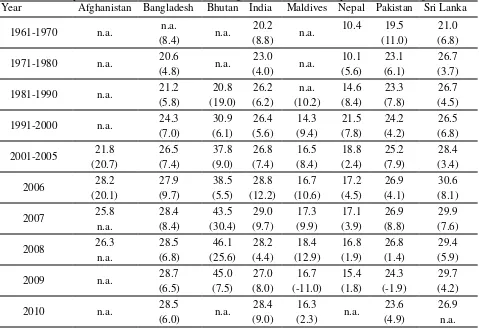
Interesting to note is the growth in services sector (Table 3). In 2009, Nepal's services (as a percent of GDP) rose by 5.3 percent, making services value added more than half (52 per cent) of its GDP. The largest services share as a percent of GDP is recorded in Maldives (77 per cent) followed by Sri Lanka (58 per cent), India (55 per cent), Pakistan (54 per cent) and Bangladesh (53 per cent) in the same year. The lowest share is recorded in Bhutan (37 per cent).
[image:11.612.71.555.447.707.2]While Nepal fairs well in terms of services and agriculture, the industry value added (as a percent of GDP) remains very low compared to the rest of the South Asian countries (Table 4).
Table 1: Agriculture value added as a share of GDP (growth rate of agriculture value added in percent)
Year Afghanistan Bangladesh Bhutan India Maldives Nepal Pakistan Sri Lanka
1961-1970 n.a. n.a. n.a. 42.5 n.a. 67.8 40.8 30.1
(3.2) (4.1) (2.9) (5.1) (3.5)
1971-1980 n.a. 31.6 n.a. 38.2 n.a. 66.9 33.0 28.9
(-0.1) (1.8) (0.2) (2.4) (2.5)
1981-1990 n.a. 31.5 41.3 31.3 n.a. 55.0 28.2 27.1
(2.5) (5.6) (3.5) (7.6) (4.6) (4.1) (2.8)
1991-2000 n.a. 26.7 32.8 27.0 9.9 42.4 26.1 23.0
(3.2) (1.7) (2.8) (2.0) (2.5) (4.5) (2.0)
2001-2005 43.1 22.0 26.2 20.6 9.3 37.8 22.9 14.4
(6.3) (2.5) (2.9) (2.8) (7.7) (3.8) (2.2) (0.5)
2006 32.6 19.6 22.8 18.3 8.4 34.6 20.4 11.3
n.a. (4.9) (1.0) (4.2) (-0.7) (1.8) (6.3) (6.3)
2007 34.5 19.2 20.5 18.3 6.5 33.6 20.5 11.7
n.a. (4.6) (1.2) (5.8) (-17.5) (1.0) (4.1) (3.4)
2008 28.5 19.0 18.7 17.6 5.9 33.8 20.3 13.4
2009 n.a. 18.7 17.6 17.8 5.6 32.8 21.6 12.6
(4.1) (1.7) (0.4) (-7.9) (2.2) (4.0) (3.2)
2010 n.a. 18.8 n.a. 16.2 5.2 n.a. 21.8 13.6
(4.7) (5.0) (-3.2) (2.0) (5.0)
Table 2: Manufacturing value added as a share of GDP (growth rate of manufacturing value added in percent)
Year Afghanistan Bangladesh Bhutan India Maldives Nepal Pakistan Sri Lanka
1961-1970 n.a. n.a. n.a. 14.2 n.a. 3.6 14.5 15.7
(5.3) (7.7) n.a. (8.4) (6.8)
1971-1980 n.a. 13.8 n.a. 16.0 n.a. 4.2 15.9 19.1
(6.0) (4.1) (2.9) (5.5) (2.1)
1981-1990 n.a. 13.7 5.9 16.6 5.4 16.1 15.1
(5.0) (16.4) (6.2) (9.6) (8.4) (8.2) (6.2)
1991-2000 n.a. 15.1 9.4 16.2 7.7 9.1 16.2 15.9
(6.9) (7.2) (5.9) (6.3) (10.2) (3.9) (8.0)
2001-2005 14.8 16.0 7.8 15.3 8.2 8.6 16.6 18.3
(12.8) (6.8) (4.3) (6.9) (3.6) (0.6) (10.0) (2.6)
2006 17.4 17.2 7.2 16.1 7.2 7.8 19.1 19.2
(14.5) (10.8) (3.6) (14.3) (14.6) (2.0) (8.7) (5.5)
2007 17.0 17.8 6.8 16.0 7.0 7.7 19.0 18.5
n.a. (9.7) (4.9) (10.3) (3.4) (2.6) (8.3) (6.4)
2008 17.4 17.8 6.5 15.5 6.8 7.4 19.7 18.0
n.a. (7.2) (5.4) (4.2) (2.8) (0.2) (4.8) (4.9)
2009 n.a. 17.9 6.4 14.8 6.7 6.8 17.1 18.1
(6.7) (6.0) (8.8) (-4.0) (-0.5) (-3.7) (3.3)
2010 n.a. 17.8 n.a. 16.0 6.5 n.a. 17.1 16.3
[image:12.612.74.554.190.517.2](5.7) n.a. (9.0) (1.3) (5.2) (-1.0)
Table 3: Services value added as a share of GDP (growth rate of services value added in percent)
Year Afghanistan Bangladesh Bhutan India Maldives Nepal Pakistan Sri Lanka
1961-1970 n.a. n.a. n.a. 37.2 n.a. 21.8 39.7 48.9
(3.8) (7.0) n.a. (6.8) (3.9)
1971-1980 n.a. 47.8 n.a. 38.7 n.a. 23.0 43.9 44.4
(2.5) (4.4) (4.4) (6.3) (5.4)
1981-1990 n.a. 47.3 37.8 42.5 n.a. 30.4 48.5 46.2
(3.7) (9.8) (6.6) (18.7) (3.7) (6.6) (4.7)
1991-2000 n.a. 49.0 36.3 46.6 75.8 36.1 49.7 50.5
(4.5) (7.8) (7.3) (8.1) (6.4) (4.5) (6.0)
2001-2005 35.2 51.6 36.0 52.6 74.2 43.4 51.9 57.2
[image:12.612.70.554.537.714.2]2006 39.2 52.5 38.6 52.9 74.9 48.2 52.8 58.0
(16.9) (6.4) (11.4) (10.1) (24.0) (5.2) (6.5) (7.7)
2007 39.7 52.4 36.0 52.7 76.2 49.3 52.6 58.4
n.a. (6.9) (7.3) (10.3) (8.1) (4.0) (7.0) (7.1)
2008 45.2 52.5 35.2 54.2 75.7 49.4 52.9 57.2
n.a. (6.5) (7.9) (10.1) (5.5) (8.9) (6.0) (5.6)
2009 n.a. 52.6 37.4 55.3 77.7 51.8 54.2 57.8
(6.3) (12.1) (10.1) (0.3) (5.3) (1.6) (3.3)
2010 n.a. 52.6 n.a. 55.4 78.5 n.a. 54.6 59.5
[image:13.612.76.555.255.584.2](6.4) (9.1) (5.9) (4.6) (12.5)
Table 4: Industry value added as a share of GDP (growth rate of industry value added in percent)
Year Afghanistan Bangladesh Bhutan India Maldives Nepal Pakistan Sri Lanka
1961-1970 n.a. n.a. n.a. 20.2 n.a. 10.4 19.5 21.0
(8.4) (8.8) (11.0) (6.8)
1971-1980 n.a. 20.6 n.a. 23.0 n.a. 10.1 23.1 26.7
(4.8) (4.0) (5.6) (6.1) (3.7)
1981-1990 n.a. 21.2 20.8 26.2 n.a. 14.6 23.3 26.7
(5.8) (19.0) (6.2) (10.2) (8.4) (7.8) (4.5)
1991-2000 n.a. 24.3 30.9 26.4 14.3 21.5 24.2 26.5
(7.0) (6.1) (5.6) (9.4) (7.8) (4.2) (6.8)
2001-2005 21.8 26.5 37.8 26.8 16.5 18.8 25.2 28.4
(20.7) (7.4) (9.0) (7.4) (8.4) (2.4) (7.9) (3.4)
2006 28.2 27.9 38.5 28.8 16.7 17.2 26.9 30.6
(20.1) (9.7) (5.5) (12.2) (10.6) (4.5) (4.1) (8.1)
2007 25.8 28.4 43.5 29.0 17.3 17.1 26.9 29.9
n.a. (8.4) (30.4) (9.7) (9.9) (3.9) (8.8) (7.6)
2008 26.3 28.5 46.1 28.2 18.4 16.8 26.8 29.4
n.a. (6.8) (25.6) (4.4) (12.9) (1.9) (1.4) (5.9)
2009 n.a. 28.7 45.0 27.0 16.7 15.4 24.3 29.7
(6.5) (7.5) (8.0) (-11.0) (1.8) (-1.9) (4.2)
2010 n.a. 28.5 n.a. 28.4 16.3 n.a. 23.6 26.9
(6.0) (9.0) (2.3) (4.9) n.a.
3. Data and Method
4.1 Data
the economic development of Nepal, one needs to focus on the role of other capital inflows like remittances and aid (Sharma, 2007).i Moreover, the largest sources of foreign currency for Nepal are tourism, exports and remittances, the latter gaining greater significance recently.
Table 5: Selected key indicators for Nepal
Land Area (Sq.km.'000) 143.4
Population (2006-2010 in millions) 28.9
Per Capita GDP (US$) Current Prices (2006-2010) 417.1
Aid Per Capita (US$) Current Prices (2005-2009) 21.8
Aid as percentage of GDP (2006-2010) 6.0
Annual Average Growth Rate in percent (2006-2010) 4.5
Annual Average Inflation in percent (GDP deflator) (2006-2010) 10.0
Fiscal Balance of Central Government as percent of GDP (2004-2005) -1.2
Central Government Debt as a percent of GDP (2004-2008) 49.5
Current Account Balance as percent of GDP (2006-2010) 1.4
Foreign Direct Investment as a percent of GDP (2006-2010) 0.2
Source: WDI, World Bank (2010); Statistical Database System Online, ADB (2009). Note: interval years correspond to averages calculated by the author
We take the analysis a step further by exploring the inclusive role of financial sector development and information and communications technology (ICT) which has been critical instruments in establishing a new global order for many poor and developing countries. Accordingly, we hypothesise financial and technology inclusion, remittance inflows and export to have a positive effect on Nepal’s economic activity.
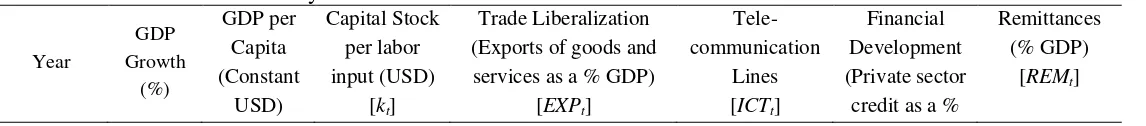
The annual data used in the analysis are from 1975-2010 (35 years of annual data). The capital stock utilized for the study has been built up by perpetual inventory method.ii Labour stock is measured by average employment to population ratio.iii Data on telecommunication lines, domestic credit to private sectors (as a percent of GDP) used as a proxy for financial development and exports of goods and services (as a percent of GDP) used as a measure trade liberalization are sourced from World Development Indicators and Global Development Finance
(WDI) issued by World Bank (2010). A summary of the data is provided in Table 6.
Table 6: Data Summary for selected variablesa
Year
GDP Growth
(%)
GDP per Capita (Constant
USD)
Capital Stock per labor input (USD)
[kt]
Trade Liberalization (Exports of goods and services as a % GDP)
[EXPt]
Tele-communication
Lines [ICTt]
Financial Development (Private sector
credit as a %
Remittances (% GDP)
[image:14.612.27.600.651.714.2]GDP) [FINt]
1961-1970 2.5 n.d. 6.5 n.d. 1.8 n.d.
1971-1980 2.1 857 8.8 9,017 5.1 n.d.
1981-1990 4.8 1,808 11.3 28,005 10.3 n.d.
1991-2000 5.0 2,203 20.8 134,676 21.8 1.4
2001-2005 3.4 2,188 17.4 380,027 27.2 10.4
2006 3.4 2,169 13.4 611,544 32.9 16.0
2007 3.4 2,164 13.0 701,126 37.0 16.9
2008 6.1 2,158 12.1 805,061 51.7 21.7
2009 4.4 2,153 15.3 820,534 59.2 23.1
2010 4.6 2,147 13.6 943,557 55.6 22.1
a.
interval years correspond to averages calculated by the author. Source: data from WDI, World Bank (2010)
4.2 Method
Subsequently, we take the view that financial development, ICT, remittance inflows and exports have positive effects on income level and economic growth of Nepal. Further, using the conventional Cobb-Douglas production function with the Hicks–neutral technical progress, we set the per worker income (yt) equation as:
yt = At ktα , 0 < α < 1 (1)
where A = stock of technology and k = capital per worker, and α is the profit share. The Solow
model assumes that the evolution of technology is given by
At = AoegT (2)
where A0is the initial stock of knowledge and T is time.
Further, we define Atas:
When EXPt, FINt, ICTt and REMtare entered as shift variables in the conventional Solow model
where labour and capital are considered as fundamental instruments, the effects on total factor productivity (TFP) are duly captured. Therefore, expanding (2) and (3), we get:
At = AoegT EXPtβFINtλICTt REMt (4)
And therefore,
yt = (AoegT EXPtβ FINtλ ICTt REMt)ktα (5)
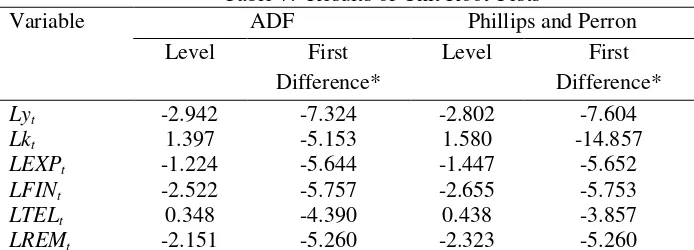
[image:16.612.133.480.498.623.2]Since the number of observations is small, the bounds testing approach under ARDL procedure developed by Pesaran (Pesaran, Shin and Smith, 2001) is deployed. In bounds testing approach, pre-testing of unit roots is not required and it is possible to investigate cointegration of the levels of the variables, irrespective of their order. However, to ensure the order of variables are at most I(1) in order to avoid the criticism various sorts, the unit root tests are first conducted to ensure they are of the same order before entering them into analysis. In computing unit root tests to examine the time series properties of the variables, the ADF and Phillips-Perron test statistics are used. From the test results (Table 7), all variables are non-stationary in their levels however they are stationary in their first differences.
Table 7: Results of Unit Root Tests
Variable ADF Phillips and Perron
Level First
Difference*
Level First
Difference*
Lyt -2.942 -7.324 -2.802 -7.604
Lkt 1.397 -5.153 1.580 -14.857
LEXPt -1.224 -5.644 -1.447 -5.652
LFINt -2.522 -5.757 -2.655 -5.753
LTELt 0.348 -4.390 0.438 -3.857
LREMt -2.151 -5.260 -2.323 -5.260
Notes: The ADF critical values are based on Mckinnon. The optimal lag is chosen on the basis of Akaike Information Criterion (AIC). The null hypothesis for both ADF and Phillips-Perron tests is a series has a unit root (non-stationary). * denotes the rejection of the null hypothesis of existence of unit root at 1% level of significance.
The next step is to examine the existence of a long run relationship between yt, kt, EXPt, FINt,
The ARDL equations are specified as follows:iv
t p
i t i
LREM i
p
i t i
LICT i
p
i t i
LFIN i
p
i t i
LEXP i
p
i t i
Lk i p
i t i
Ly i TREND t LREM t LICTT t LFIN t LEXP t Lk t Ly t Ly 1 0 16 0 15 0 14 0 13 0 12 1 11 17 1 16 1 15 1 14 1 13 1 12 1 11 10 (6) 4. Results
5.1 Bounds Test Results
There are two steps in examining the long-run relationship. First, Equation (7) is estimated by ordinary least squares technique. Second, for each equation, the existence of a long-run relationship can be traced by imposing a restriction on all estimated coefficients of lagged level variables equating to zero. Based on the F-statistics (or Wald statistics):
0
: 1 2 3 4 5 6
0 i i i i i i
H
(Null: existence of no cointegration)0 ; 0 ; 0 ; 0 ; 0 ; 0
: 1 2 3 4 5 6
1 i i i i i i
H (Alternative: existence of long-run cointegration)
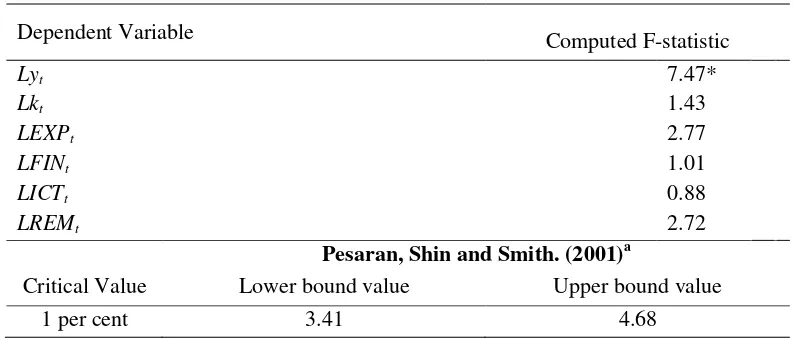
The results of the bounds test are reported in Table 8, confirming the presence of a long run relationship amongst the variables when only real output per worker (Lyt) is set as the dependent
variable. The computed F-statistics for Lyt is 7.47, which is significant at 1 per cent level of
[image:17.612.107.504.520.689.2]significance.
Table 8: Results of Bound Tests
Dependent Variable Computed F-statistic
Lyt 7.47*
Lkt 1.43
LEXPt 2.77
LFINt 1.01
LICTt 0.88
LREMt 2.72
Pesaran, Shin and Smith. (2001)a
Critical Value Lower bound value Upper bound value
1 per cent 3.41 4.68
a
Having confirmed the existence of a long-run relationship between yt with kt, EXPt, FINt, ICTt
and REMt, a number of diagnostic test were performed (see lower panel of Table 10), such as
Lagrange multiplier test of residual serial correlation; Ramsey’s RESET test using the square of the fitted values for correct functional form; normality test based on a test of skewness and kurtosis of residuals; and heteroscedasticity test based on the regression of squared residuals on squared fitted values. The results showed that the equation performed relatively well as the disturbance terms are normally distributed and serially uncorrelated with homoscedasticity of residuals. Besides, the CUSUM and CUSUM of Squares plot showed the parameters of the model are relatively stable over time.1
Subsequently, the long-run equation is as follows:
) 38 . 9 ( ) 24 . 11 ( ) 18 . 29 ( ) 11 . 20 ( ) 18 . 39 ( ) 22 . 38 ( ) 62 . 31 ( * 0.012 -* .025 0 * .154 0 * .075 0 * .080 0 * .229 0 1.930 t TREND LREM LICT LFIN LEXP Lk Ly (7)
Note: * indicates significance at 1% level
From the the long-run regression equation (7) shows that the capital stock share (Lk) is about 0.23.2 Exports of goods and services (LEXP) contribute about 0.08 per cent to per worker income. Moreover, financial development contribution is close to 0.075 percent. Interestingly, information and communications technology (LICT) has been instrumental to the economic activity, contributing close to 0.154 percent to per worker income. Remittance inflows (LREM) contribution to per worker income is 0.025 percent. The negative coefficient from trend variable, (TREND = -0.012 per cent) is a plausible indication of a relatively weak economic institutions and policy environment impeding long-run growth and development.
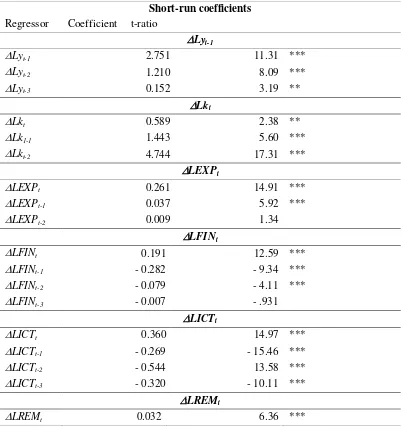
Next, we report the short run results which further supports the role of growth in capital stock
(Lkt), lagged effects from per worker income (Lyt-n), exports(LEXPt), financial development
(LFINt), ICT (LICTt) and remittances (LREMt) in driving the short-run growth of the
economy (Table 9). Notably, the growth in lagged per worker income has a positive and significant feedback effects on growth in current income. Similarly, the growths in lagged capital stock share and in exports of goods and services have significant positive effects on income.
1
Graphs not provided here to conserve space, however is available upon request.
2
The initial growth (period t=0) in: financial development (LFINt = 0.191 per cent), ICT (LICTt
= 0.36 per cent) and remittance inflows (LREMt = 0.032 per cent) have significant positive
[image:19.612.106.509.290.718.2]effect on the growth of per worker income. However, as noticed by the lagged growth effects from these variables, the positive effects decline over a three lag periods (t=1, t=2 and t=3). This is particularly the case because in the short run, other factors and effects (exogenously) besides financial development, technology and remittance inflows govern the economic decisions. Nevertheless, the positive effects in the initial (t=0) need to be captured, harnessed and maximised through sound policies.
Table 9: Dependent variable: RGDP/Labour (Lyt) ARDL (4,3,3,4,4,4)
Short-run coefficients
Regressor Coefficient t-ratio
Lyt-1
Lyt-1 2.751 11.31 ***
Lyt-2 1.210 8.09 ***
Lyt-3 0.152 3.19 **
Lkt
Lkt 0.589 2.38 **
Lk1-1 1.443 5.60 ***
Lkt-2 4.744 17.31 ***
LEXPt
LEXPt 0.261 14.91 ***
LEXPt-1 0.037 5.92 ***
LEXPt-2 0.009 1.34
LFINt
LFINt 0.191 12.59 ***
LFINt-1 - 0.282 - 9.34 ***
LFINt-2 - 0.079 - 4.11 ***
LFINt-3 - 0.007 - .931
LICTt
LICTt 0.360 14.97 ***
LICTt-1 - 0.269 - 15.46 ***
LICTt-2 - 0.544 13.58 ***
LICTt-3 - 0.320 - 10.11 ***
LREMt
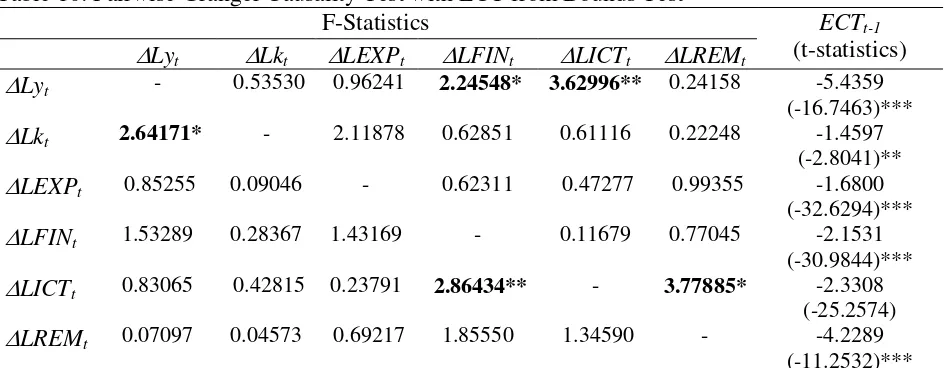
Next, to ascertain the direction of causality between the short run, I(0) variables, we carried out the Granger Causality test (Table 10). The results show a unidirectional causation where: growth in ICT Granger cause growth in financial development and remittance inflows; growth in per worker income Granger cause growth in financial development and ICT expansion; and growth in capital stock Granger cause growth in growth in income per worker.
Table 10: Pairwise Granger Causality Test with ECT from Bounds Test
F-Statistics ECTt-1
(t-statistics) Lyt Lkt LEXPt LFINt LICTt LREMt
Lyt - 0.53530 0.96241 2.24548* 3.62996** 0.24158 -5.4359
(-16.7463)***
Lkt 2.64171* - 2.11878 0.62851 0.61116 0.22248 -1.4597
(-2.8041)**
LEXPt 0.85255 0.09046 - 0.62311 0.47277 0.99355 -1.6800
(-32.6294)***
LFINt 1.53289 0.28367 1.43169 - 0.11679 0.77045 -2.1531
(-30.9844)***
LICTt 0.83065 0.42815 0.23791 2.86434** - 3.77885* -2.3308
(-25.2574)
LREMt 0.07097 0.04573 0.69217 1.85550 1.34590 - -4.2289
(-11.2532)***
**, * and *** refers to 5%, 10% and 1% level of significance respectively.
5. Conclusion and Policy Implication
In this paper, we set out to explore the nexus between export viz. trade openness, financial development, ICT, remittance inflows and income level in Nepal. The long run relationship is clear as per worker income is influenced by these variables. In the short run, there are positive
LREMt-1 - 0.094 - 7.59 ***
LREMt-2 - 0.026 - 3.89 ***
LREMt-3 - 0.017 - 5.69 ***
Ct 10.489 17.74 ***
TRENDt - 0.063 - 6.56 ***
ECT t-1 - 5.436 - 16.74 ***
0.99
DW-statistics 3.16
S.E. of Regression: 0.0016 F-statistics F( 23,8): 358.6369
Mean of Dependent Variable: 0.0185 S.D. of Dependent Variable: 0.0257
Residual Sum of Squares : 0.7E-5 Equation Log-likelihood: 198.8962
impacts, however, with some lagged negative effects from remittances, financial development and ICT services. Nevertheless, exports of goods and services, lagged per worker income (which is a plausible proxy for previous years government policies) and capital productivity remains critical to growth all throughout.
The positive short run effects from financial and technology inclusion and remittances indicate the relative importance these subsectors play in the economy of Nepal. However, plausible factors explaining the negative lagged effects includes uncertainty, weak and poor economic and investment climate (high risks associated with doing business), weak institutions and poor infrastructures,. Therefore, financial inclusion, technology diffusion and remittance inflows need to be considered seriously in sketching out pro-growth policies.
For policy deliberation, therefore, the following points are put forward: Firstly, the need to reduce transaction cost of doing business in Nepal is important. This needs to be focussed towards attracting open government partnership that is encouraging public-private partnership besides partnering with non-governmental organization in improving availability, accessibility and affordability of financial and technology services. A particular focus need to be given towards incentivising foreign direct investment and boosting manufacturing sector operations.
It is important that institutional structures are strengthened and basic infrastructures are put in place to kick start efficient operations of key sectors in the economy. Further, the need for good governance practices in public service operations, efficient and productive use and effective management of aid whilst strengthening partnership with donor agencies are critical course to take. Making effective use of aid towards constructing basic infrastructure that will support ICT development and greater financial inclusion (via rural banking, micro-finance, micro lending and saving schemes), and expanding and diversifying exports whilst ensuring that comparative advantage is realised from promising sectors will support backward-forward linkage besides improving productivity in the economy.
technology inclusion viewpoint. Moreover, the recent growth in mobile technology and telecommunications facilities in Nepal should be capitalised towards making interaction between remittance senders and recipients cost efficient and reliable. Modelling the use of mobile technologies such as that led by the mobile network operations (M-Paisa or M-Pesa) in countries in the African region such as Nigeria, Kenya and currently introduced in Fiji, are some practical measures. However, noting the need for heavy capital investment, the role of aid is once again underscored.
Moreover, ensuring scale at least cost transactions is vital, and hence providing affordable ICT and financial services with aggressing promotion schemes with clear welfare improvement motive should be part of the financial inclusion debate.
It is equally crucial to look at the banking and financial services fees and charges. Therefore, having an effective regulatory and monitoring framework will ensure consumers are not charged unnecessarily high prices for transferring relatively small amounts of money. Therefore, high transaction costs and exorbitant (hidden) prices charged by commercial banks, which are particularly the case in small and low income countries where banking and financial services are relatively small in scale, should be addressed. All these will form a significant part of an effective remittance management system, where technology, finance, remitters and recipients are connected efficiently. The options to liberalise financial sector in order to promote greater competition can also be looked at. However, openness of financial sector need to be approached with care and in a gradual approach, ensuring that sound regulatory and monitoring framework is in place at the outset to attract only genuine investors in the banking system.
In terms of export sector liberalization, it is vital that Nepal should focus on aggressive liberalization of its sectors that can not only support domestic market but have the potential (surplus) to furnish international markets. This can be achieved by selectively removing export taxes in selected sectors to incentivise domestic production for global market and protection of critical local sectors for domestic consumption that would otherwise lead to issues of food security if not managed well. Subsequently, ensuring that financial and technology services are readily available to support the growth of key sectors are imperative in driving efficiency and competitiveness. .
Noting that Nepal is predominantly agriculture based economy, improving productivity in this sector is important. There is an immense scope to expand services sector such as ICT, financial services, tourism, and education among others, besides manufacturing sector plausibly through attracting foreign direct investment which are duly supportive of economic growth and does not undermine resources or camouflaged to strategically harm the domestic industries.
Finally, negotiations on trade in services, particularly focussing the General Agreements on Trade in Services (GATS) under mode IV which covers the temporary movement of natural persons, should be prioritised. The bi-lateral and multi-lateral deals for short-term unskilled and semi-skilled workers should be considered both within and outside South Asian region. Nevertheless, any negotiation deals between interested trade partners need to be made with a win-win mindset and giving due consideration to protecting workers from being exploited. Further, excess skilled labour that are mostly unemployed or underemployed, the migration schemes will be an outlet for maximizing human capital and skill transfer besides the plausible increase in remittance inflows that will ensue over time. Hence, in an effort to establish a new Nepal in the globalised world order, the government need to have broad-based and sector-focussed policies prioritising financial and technology inclusion.
6. References
Acemoglu, D. (2009) Introduction to Modern Economic Growth, Princeton University Press, U.S.A.
Ahmed, J., Zaman, K. & Shah, I. (2011). "An empirical analysis of remittances-growth nexus in Pakistan
Ahmed, V., Sugiyarto, G. & Jha, S. (2011). "Remittances and Household Welfare: A Case Study of
Pakistan", Journal of Social and Policy Sciences, 1: 125-190.
Asian Development Bank (ADB). (2009). Statistical Database System Online. Manila, Asian
Development Bank. Retrieved from https://sdbs.adb.org/sdbs/index.jsp. [14 July, 2011].
Beck, T., Levine, R. & Loayza, N. (2000). "Finance and the sources of growth", Journal of Financial
Economics. 58: 261-300.
Brown, R. & Ahlburg, A.D. (1999). "Remittance in the Pacific", International Journal of Social
Economics, 26: 325-344.
Browne, R. & Leeves, G. (2007). Impacts of International Migration and Remittances on Source Country Household Incomes in Small Island States: Fiji and Tonga. Discussion Paper No. 347. School of
Economics, University of Queensland, Australia. Retrieved from
http://espace.library.uq.edu.au/eserv.php?pid=UQ:119810&dsID=econdp_347_0407.pdf. [5 December, 2011].
Buch, M.C. & Kuckulenz, A. (2010). "Worker Remittances and Capital Flows to Developing Countries. International Migration. 48(5): 89-117.
Buhalis, D. & Law, R. (2008). "Progress in information technology and tourism management: 20 years on
and 10 years after the Internet - The start of eTourism research", Tourism Management, 29: 609-623.
Chami, R., Cosimano, T.F. and Gapen, M.T. (2006). "Beware of emigrants bearing gifts: optimal fiscal and monetary policy in the presence of remittances", IMF Working Paper WP/06/61, Washington, D.C.: International Monetary Fund.
Chami, R., Hakura, D. & Montiel, P. (2009). "Remittances: An Automatic Output Stabilizer?", IMF
Working Paper WP/09/91. IMF. Retrieved from
http://www.imf.org/external/pubs/ft/wp/2009/wp0991.pdf. [17 October, 2011].
De Haas, H. (2005). "International Migration, Remittances and Development: myths and facts", Third
World Quarterly, 26: 1269-1284.
Frankel, J.A. and Rose, A.K. (2000). "Estimating the effects of currency unions on trade and output",
NBER Working Paper Series No. 7875. NBER, Cambridge. Retrieved from
http://www.wcfia.harvard.edu/sites/default/files/W7857.pdf. [1 December, 2011]
Gaudel, Y.S. (2006). "Remittance Income in Nepal: Need for Economic Development", The Journal of
Nepalese Business Studies, 3: 9-17.
Hassan, M.K., Sachez, B. & Yu, J.S. (2011) Financial development and economic growth: New Evidence from panel data. Quarterly Review of Economics and Finance. 51(1): 88-104.
Horscroft, V. (2010). An Eye on East Asia and Pacific - The Role of Information and Communications
Technology in Mitigating the Challenges on Economic Geography in the Pacific Islands. World Bank.
Retrieved from
http://siteresources.worldbank.org/INTEASTASIAPACIFIC/Resources/226262-1291126731435/EOEA_Virginia_Horscroft_Nov2010.pdf [29 December 2010].
Irving J., Mohapatra, S. & Ratha, D. (2010). "Migrant Remittance Flows: Findings from a Global Survey of Central Banks", World Bank Working Paper No. 194/2010. Washington, D.C.: World Bank.
Jalava, J. & Pohjola, M. (2008). "The roles of electricity and ICT in economic growth: Case Finland",
Explorations in Economic History, 45: 270-287.
Jayaraman, T.K., Choong, C.K. & Kumar, R. (2009). "Role of Remittances in Economic Growth in
Pacific Island Countries: A Study of Samoa", Perspectives on Global Development and Technology, 8:
Jayaraman, T.K., Choong, C.K. & Kumar, R. (2010). "Role of remittances in Tongan economy",
Migration Letters, 7: 224-230.
Jayaraman, T.K., Choong, C.K. & Kumar, R. (2011a). "Role of Remittances in India’s Economic
Growth", Global Business and Economics Review. [Forthcoming]. Retrieved from
http://www.inderscience.com/browse/index.php?journalID=168&action=coming> [20 October, 2011].
Jayaraman, T.K., Choong, C.K. & Kumar, R. (2011b) Role of remittances in small Pacific Island economies: an empirical study of Fiji. International Journal of Economics and Business Research. 3(5): 526-542.
Kar, M., Peker, O. & Kaplan, M. (2008) Trade Liberalization, Financial Development and Economic Growth in the Long Term: The Case of Turkey. South East European Journal of Economics and Business. 3(2): 25-38.
Katz, R.L. (2009). "The Economic and Social Impact of Telecommunications Output A Theoretical
Framework and Empirical Evidence for Spain", Intereconomics, 44: 41-48.
King, R.G. & Levine, R. (1993a). "Finance and Growth: Schumpeter Might Be Right", Quarterly Journal
of Economics, 108: 717-737.
King, R.G. & Levine, R. (1993b). "Finance, entrepreneurship and growth: theory and evidence", Journal
of Monetary Economics, 32: 513-542.
Kock, U. & Sun, Y. (2011). "Remittances in Pakistan-Why have they gone up, and why aren’t they
coming down?", IMF Working Papers WP/11/200, IMF. Retrieved from
http://www.imf.org/external/pubs/ft/wp/2011/wp11200.pdf?. [17 October, 2011].
Koutroumpis, P. (2009). "The economic impact of broadband on growth: A simultaneous approach",
Telecommunications Policy, 33: 471-485.
Kumar, R.R. & Kumar, R. (2012). "Exploring the nexus between information and communications
technology, tourism and growth in Fiji", Tourism Economics, 18: 359-371.
Kumar, R.R. (2011a). "Do Remittances, Exports and Financial Development Matter for Economic
Growth? A Case Study of Pakistan using Bounds Approach", Journal of International Academic
Research, 11: 18-27.
Kumar, R.R. (2011b). "Role of Trade Openness, Remittances, Capital Inflows, and Financial
Development in Vanuatu", in: Sirkeci, I., Cohen, J.H. & Ratha, D. (eds.), Migration and Remittances
during the Global Financial Crisis and Beyond, Washington DC; World Bank.
Kumar, R.R., Naidu, V. & Kumar, R. (2011). "Exploring the Nexus between Trade, Visitor Arrivals,
Remittances and Income in the Pacific: a study of Vanuatu", Acta Universitatis Danubius. Œconomica, 7:
199-218.
Kuppusamy, M., Raman, M. & Lee, G. (2009). "Whose ICT Investment Matters to Economic Growth:
Private or Public? The Malaysian Perspective", Electronic Journal on Information Systems in Developing
Countries, 37: 1-19.
Levine, R., Loayza, N. & Beck, T. (2000). "Financial Intermediation and Growth: Causality and Causes",
Journal of Monetary Economics, 46: 31-77.
Maclellan, N. & Mares, P. (2005) Remittances and labour mobility in the Pacific - A working paper on seasonal work programs in Australia for Pacific Islanders. Melbourne, Swinburne Institute for Social
Research. Australia. Retrieved from
McKinnon, R.I. (1973) Money and capital in economic development. Washington, DC: Brookings Institution.
Minges, M. & Gray, V. (2004) Bula Internet: Fiji ICT Case Study. International Telecommunication
Union. Retrieved from http://www.itu.int/ITU-D/ict/cs/fiji/material/CS_FJI.pdf [accessed: 27 December 2010].
Pant, K.P., Pandey, V.L. & Rahut, D.B. (2011) Effects of Foreign Employment on Poverty, Labour Supply and Agricultural Growth in South Asia: A Case of Nepal, India and Bhutan. Sanei Working Paper Series, No. 11-08. South Asia Network of Economic Research Institutes, Bangladesh. Retrieved from http://www.saneinetwork.net/research/round11/08-K%20P%20Pant.pdf [ 2 December, 2011].
Pesaran, M.H., Shin, Y. & Smith, R. (2001). "Bounds testing approaches to the analysis of level
relationships", Journal of Applied Econometrics, 16: 289-326.
Porter, M. (2001) "Strategy and the Internet", Harvard Business Review, 79: 63-78.
Ratha, D. & Riedberg, J. (2005). On Reducing Remittance Costs, Washington D.C.: World Bank.
Ratha, D. (2007). Leveraging Remittances for Development, Migration Policy Institute, Washington D.C.:
World Bank.
Riester, A. (2010). "Impact of the global recession on international labour migration and remittances: Implications for poverty reduction and development in Nepal, Philippines, Tajikistan, and Uzbekistan",
in: Bauer, A. & Thant, M. (eds.) (2010). Poverty and Sustainable Development in Asia: Impacts and
Responses to the Global Economic Crisis. Asian Development Bank, Manila. Retrieved from
http://www.adb.org/documents/books/poverty-sustainable-development/poverty-sustainable-development-asia.pdf [2 December, 2010].
Rose, A.K. (2004). "Do WTO members have more liberal trade policy?", Journal of Internal Economics,
63: 209-235. Retrieved from
http://www.sciencedirect.com/science?_ob=MiamiImageURL&_cid=271695&_user=826297&_pii=S002
2199603000710&_check=y&_origin=&_coverDate=31-Jul-2004&view=c&wchp=dGLbVlt-zSkzV&md5=a05c6b27abe36a19028dee7265f57609/1-s2.0-S0022199603000710-main.pdf. [5 December, 2011]
Sen, A. (1999). Development as Freedom, New York: Anchor Books.
Sharma, O. & Bhandari, R. (2005). "Foreign Trade and Its Effects on Nepalese Economic Development",
The Journal of Nepalese Business Studies, 2: 13-32.
Sharma, S.R. (2007). "Planned Development and Conflict: The Role of Private Sector in augmenting
remittance in Nepal", in: Dhugana, H. & Logan, M. (eds.), Sustainable Development in Conflict
Environments: Challenges and Opportunities, SAHAKARYA Project. Centre for International Studies
and Cooperation (CECI), Kathmandu, Nepal
Sheldon, P. (1997). Tourism information technologies, Oxford: CAB.
Srivastava, N.L. & Chaudhary, S.K. (2007). Role of Remittance in Economic Development of Nepal, The
Journal of Nepalese Business Studies, 4: 28-37.
Suleri, A.Q. & Savage. K. (2006). Remittances in crises: a case study from Pakistan, Overseas
Development Institute (ODI). U.K.
United Nations Economic and Social Commission for Asia and the Pacific, (UNESCAP) (2010).
Economic and Social Survey, 2010, Bangkok: UNESCAP.
Wacziarg, R. & Welch, K. (2008). "Trade Liberalization and Growth: New Evidence", The World Bank
Economic Review, 22: 187-231.
Winters, A.L, McCulloch, N. & McKay, A (2004). "Trade Liberalization and Poverty: The Evidence So
Far", Journal of Economic Literature. 42: 72-115.
World Bank (2011). WDI Online Word Development Indicators, Washington D.C.: World Bank.
Retrieved from http://databank.worldbank.org/ddp/home.do?Step=1&id=4# [8 August, 2011]
i
The impact of ODA on per worker income was also tested during analysis. It was found that aid has a negative and not statistically significant effect on the level of income or the growth rate. Therefore, we safely claim that at this stage, aid does not support pro-poor growth in Nepal.
ii
The perpetual inventory method to compute the capital stock, with 2 percent depreciation rate was used. Given the lack of data on investment, we used gross fixed capital formation at constant prices to estimate the capital. Initial capital is 1.1 times the 1974 real GDP and investment for 1975-1990 is assumed to be fixed at 1975 investment level and for 1991-2010, investment is fixed at 1990 investment level.
iii
Employment data is estimated using the average employment to population ratio (0.68) multiplied by the respective year of population.
iv