Commodity investments: opportunities
for Indian institutional investors
Mukherjee, Dr. Kedar nath
National Institute of Bank Management (NIBM), India
15 September 2011
Online at
https://mpra.ub.uni-muenchen.de/33510/
Commodity Investments: Opportunities for Indian Institutional Investors
Dr. Kedar nath Mukherjee*
*Assistant Professor (Finance), National Institute of Bank Management, Pune – 411 048, INDIA
Abstract:
An attempt has been made to establish the fact that by investing in commodities or it
alternative channels, institutional investors like banks can not only compensate for the lower
risk-free returns in their major chunk of investments in Government securities, but also will
be able to diversify some amount of their portfolio risk which is expected to rise by taking
exposure in commodity market. The results exhibited in all the tables and figures clearly
depict that investment in alternative channels like commodity indices or commodity futures
contracts in India will not only allow the institutional investors to leverage their portfolio
return, but also will ensure that diversification benefits is achieved. Therefore, even if
investment in direct commodities are restricted for Indian banks, but still there is a significant
opportunity for them to invest in the available alternative channels like commodity indices or
commodity futures contracts
Key Words : Investment Portfolio, Commodity, Commodity Futures, Institutional Investors
JEL Classification : G10, G14, G15
_______________________________
* Corresponding Author: Assistant Professor, National Institute of Bank Management, NIBM Post Office, Kondhwe Khurd, Pune – 411 048, Maharashtra, INDIA;
Tel (+91)-20-26716351 (Off.),
Fax: (+91)-20-26834478; e-mail: kedshad_mukherjee@yahoo.com, kedar@nibmindia.org.
Commodity Investments: Opportunities for Indian Institutional Investors
Dr. Kedar nath Mukherjee1. INTRODUCTION
Where to invest? This seems to be a very common question for different investors. The
typical means of investments where especially the institutional investors can take significant
exposures include Equity, Fixed Income Securities like Bonds, other investable funds,
Derivatives, Commodities, etc. During recent years, commodities prices and the level of
investment in commodities rose significantly. Commodities could provide the yield investors
were looking for but, more important, investors began taking greater advantage of the
negative price correlation to bonds and equities to diversify their portfolios. Unlike the
traditional assets like bonds or equities, the opportunities and challenges in commodity
investments has made the scope of investment considerably wider for the investors in world
economy. Investors can take reasonably good amount of exposure in commodity market,
either through direct investments in different commodities or through various indirect
channels. Direct commodity investment has historically been a small part of investors’
overall asset allocation. Owning equity or debt issued by companies specializing in
commodity markets has been the principal means of obtaining commodity exposure. In recent
years, however, the number and variety of commodity-linked investments, offering direct
exposure to commodity markets, has considerably increased. Commodity based indices,
commodity futures contract are some of the important means to get a direct exposure into the
commodity market. However, the investors’ benefits of commodity or commodity-based
products lie primarily in their ability to offer risk and return trade-offs that cannot be easily
replicated through other investment alternatives
Commodity indices are designed to capture the returns to holding long positions in
agriculture, metals, energy, or livestock. Such indices can be created not only from the spot
prices of core commodities, but also from the prices of the concerned futures contracts on
several commodities. In the past decade, several such investable commodity indices have
been created which are based on the spot and futures prices of several commodities.
Commodity exposures through such indices also enable the investor to avoid the cost of
individual commodities and also on commodity indices allows the investors to take a direct
exposure in commodity sector without facing the challenges of holding the physical
commodities. This facility along with the other basic benefits of financial futures makes the
commodity futures contract very interesting for the investors interested in commodity market.
Investors like banks may also be restricted to hold any commodities, except bullions, in their
physical form, but they can still get the benefits of commodity market through investments in
such commodity indices or commodity futures contracts. It is also true that commodity
indices differ from the individual commodity in a number of ways, including variations in
commodity selection criteria and weighting schemes, as well as operational issues such as
rolling mechanism and rebalancing strategy. Even if the physical commodity market in India
is quite developed, not from the perspective of wider participation from different level of
investors including Indian banks, the concept of commodity indices and commodity futures
contract is not yet well taken by the market players in India.
Some of the commodity indices, offered in Indian commodity exchanges like Multi
Commodity Exchange (MCX), and National Commodity and Derivatives Exchange
(NCDEX), are MCX METAL, MCX ENERGY, MCX AGRI, MCX COMDEX, Dhaanya,
etc. MCX AGRI and Dhaanya are the commodity indices created from the prices of various
agricultural commodities in different proportion. Several Group Indices, like MCX AGRI,
MCX METAL & MCX ENERGY, both on the spot and futures prices of selected
commodities, have been developed to represent different commodity segments as traded on
the exchange. MCX COMDEX is the maiden Composite Commodity Index in India based on
commodity spot and futures prices at MCX. It is essentially the simple weighted average of
the three group indices, giving 40 percent weight each to the components of metal and energy
index and the balance 20 per cent to the components of agricultural index. Dhaanya is the
agriculture index that includes the most liquid agricultural futures contracts traded at
NCDEX. These indices are considered to be significant barometers for the performance of
commodities market and would be an ideal investment tool in commodities market over a
period of time. It is generally perceived that by holding & rolling positions in all such index
futures contracts, investors would be able to replicate the returns otherwise generated on the
basket of commodities included in the concerned index. The index futures contracts are
expected to give users the ability to efficiently hedge commodity and inflation exposure and
lay off the residual risk. On the other hand, out of more than 100 commodities listed in the
total number of commodities. The history of individual commodity futures over the last few
decades clearly reveals the importance of commodities as a significant means of investment
for domestic as well as international investors.
RATIONALE FOR INCLUDING COMMODITIES IN A PORTFOLIO
The primary reasons for including commodities or commodity-linked exposures in an
investment portfolio are Availability of Alternative Commodity Exposure, Return Prospects,
Benefits of Diversification, and Inflation Protection.
Availability of Alternative Commodity Exposure
The option of obtaining commodity exposure through direct physical investments is not
practical because of storage costs and the perishable nature of many commodities. Investors,
expected to take any long or short position in commodity sector, are not necessarily required
to get exposed to any physical commodity. Availability of commodity indices and
commodity futures contracts, as discussed in the above section, gives the investors an
opportunity to take significant exposure in the commodity sector without physically dealing
with any commodity. Equity share of commodity-based companies, which is essentially a
financial asset, is also an alternative means to take exposure in the commodity sector.
Therefore, the availability of various alternative means of investment in physical
commodities makes the commodity sector exposure attractive for the worldwide investors.
Return Prospects
The average return from direct commodities or commodity-linked investments is
comparatively greater than the same from equities or bonds. The prospect of higher return
makes such means interesting for the investor to include in their investment portfolio, even if
it brings higher volatility comparative to the other traditional assets classes.
The Benefits of Diversification
Commodities have historically provided an excellent diversification benefit when combined
with the traditional asset classes. Commodity Indices generally show very low correlation
with several other asset classes that are typically part of a broadly diversified portfolio,
positive returns, will serve to lower the overall volatility and improve the risk-adjusted
returns of a planned portfolio
Inflation Protection
Diversifying financial assets from inflation risk can often be effectively managed by
including commodities in a portfolio. Alternatively, in addition to diversification benefits,
commodities have historically provided a strong inflation hedge. Since Commodities are real
goods and raw materials, they are directly linked to the rising prices that drive inflation. In
times of unexpected inflation, Commodities can act to counter-balance the equity and fixed
income asset classes, which typically under-perform during these periods. This premise can
be well tested by calculating the correlation of commodity returns, as well as stock, bond,
hedge fund, and real estate returns, with a proxy for unexpected inflation.
COMMODITIES AS A PART OF BANKS’ INVESTMENT PORTFOLIO
The surplus funds, comes into the treasury of banks and used to create a pool of investments
in different assets, cannot be invariably utilized to invest in any commodities. In terms of
Section 8 of the Banking Regulation Act, 1949, no banking company can directly or
indirectly deal in the buying or selling or bartering of goods. However a Provision of the
same section stipulates that restrictions imposed in Section 8 shall not apply to any such
business as is specified by Central Government in terms of Section 6(1) (o). Thus the Central
Government may consider issuing a notification under Section 6(1) (o) of the B. R. Act, 1949
permitting banks to deal in the business of agricultural commodities including derivatives. In
1997, RBI permitted few banks to import and resell gold as canalizing agencies. However,
banks engaged in this bullion market do their business on consignment purchase and sale
basis for a transaction fee. Even if Indian banks are legally restricted to directly invest in
commodities, the availability of alternative channels like commodity based equities,
commodity indices, commodity futures contracts, etc. may lead to a reasonable proposition
for the banks to take indirect exposure in the commodity sector. Financing agricultural loans
against Warehouse Receipts, commonly known as Warehouse Receipt Financing, even if
considered to be one of the important direct exposures that a bank can have in the commodity
market; but this exposure is a part of banks’ loan book and therefore is not treated as a part of
banks’ investment portfolio. Above all, even if financial institutions like banks have restricted
significant amount of direct or indirect exposure can be taken to create a optimum investment
portfolio, giving due consideration to the perspective of both risk and returns.
BRIEF OVERVIEW OF THE STUDY
In light of the recent surge in many commodities, it might be useful to discuss the potential
role and use of commodities in the investment portfolio of various levels of investors,
especially the institutional investors like Banks and other Financial Institutions. The purpose
of this study is to empirically validate the theoretical arguments for the risk and return
advantages of commodity investment. The comparative advantage, especially in terms of
portfolio diversification, is examined by considering different asset classes like Equity and
Bonds, both at the individual asset level and at the index level. The performance of the
commodity indices, both Sector wise and Composite indices, is compared with the same on
traditional and alternative investments like equities and bonds.
Results, as depicted by the different statistical measures, clearly indicate that
commodity indices have sources of risk and return that are distinct from traditional assets like
stocks and bonds, and therefore offer investors an important additional area leveraging their
returns and also to ensure natural portfolio diversification. Even if different alternative
channels can be used to replicate direct investment in commodities, impact of all the
available substitute are not found to be similar and therefore could not be used invariable by
the institutional investors to construct their investment portfolios. The negative correlation
between the returns of commodities and that of selected bonds confirms that institutional
investors like Indian banks can easily diversify their portfolio by entering into various
alternative investment channels available in the commodity market. The composite results on
the movements of annualized average return and volatility among major assets classes in
different years starting from 2005 to 2011 (till May) clearly exhibits the requirement of
commodities to be a part of investment portfolio of various institutional investors, not only to
leverage their returns but also to get the benefits of inverse correlation and to ensure portfolio
diversification. The performance of each of the asset classes is briefed in detail in the
following section.
Studies such as Lummer and Siegel (1993), Kaplan and Lummer (1998), Greer (2000),
Jensen, Jonson and Mercer (2000 and 2002), Gor- ton and Rouwenhorst (2005), Erb and
Harvey (2006), Ibbotson Associates (2006), Laws and Thompson (2007), Roache (2008),
etc., focusing on the role of commodity futures in a diversified portfolio, have commonly
found that: under the appropriate circumstances, a diversified portfolio with commodity
futures provides higher average returns and a better Sharpe ratio than the traditional portfolio
of stocks, bonds and even real estate.
Although commodities have been considered as an investible asset class since at least
1978, widespread inclusion of commodities in the asset allocation decision is a more recent
phenomenon. Bjornson and Carter (1997) have found that commodity expected returns are
lower during times of high interest rates, expected inflation and economic growth. While,
Weiser (2003) reported that commodity futures returns change with different stages of a
business cycle. As direct investment in physical commodities is not practical because of
storage costs and the perishable nature of many commodities, research on the strategic and
tactical asset allocation focuses on the commodity futures.
The attraction of commodity futures is based partially on the view that commodity
prices tend to have low correlations with security returns and also provide an inflation hedge,
as evidenced by Bodie & Rosansky (1980), Irwin and Brorsen (1985), Lee, Leuthold and
Cordier (1985), Elton et al. (1987), Irwin and Landa (1987), Edwards & Park (1996).
Schneeweis and Spurgin (1997) have examined the correlations of oil-based futures
contracts with energy-related and non-energy related stock, bond, real estate and commodity
markets, and CPI. Their results confirmed that, except in periods of extreme energy price
movement, many traditional forms of indirect energy investment such as natural resource
mutual funds or energy-based common stocks are not correlated with energy price
movements.
Kaplan and Lummer (1998) have considered the performance of two portfolios,
consisting of 60% in US stocks, 30% in bonds and 10% in bills in the first, and a second
portfolio consisting of 57% US stocks, 28.5% in bonds, 9.5% in bills and 5% in GCSI. Over
the period 1970 to 1996, the first portfolio returned 11.1% per annum with a standard
deviation of 11.8% whereas the second returned 11.4% with a standard deviation of 11%,
Becker and Finnerty (2000) have found that the inclusion of portfolios of long
commodity futures contracts (CRB and GSCI) improves the risk and return performance of
stock and bond portfolios for the period of 1970 through 1990. They observed that the
improvement is more pronounced for the 1970s the 1980s due to the high inflation of the
1970s with commodities acting as an inflation hedge.
Jensen et al (2002), over the period January 1973 to December 1999, have calculated
monthly returns on a portfolio consisting of four assets, namely domestic (US) and
non-domestic stocks and corporate bonds together with a money market instrument and
commodity futures represented by Goldman Sachs Commodity (total return) Index (GCSI).
They also have found that the inclusion of commodity futures raised the mean monthly return
by figures in the region of 4 to 8 basis points per month (i.e. 48 to 96 basis points per annum).
The optimal proportion of commodity futures (again the GCSI index) was significantly
increased at all risk levels during periods of monetary restraint.
Gorton and Rouwenhorst (2005) have constructed their own commodity futures index
for the period 1959 – 2004 and examined how this compares with returns from stock and
bond indices. They concluded that the average annualized return on the collateralized futures
index was very similar to that on the SP500 over the whole period and both assets
outperformed corporate bonds. They also found that the relative performance varied over
time and that the diversification benefits of commodities work well when they are needed
most. Accordingly they have reached a conclusion that commodity futures are useful in
creating diversified portfolios with respect to the idiosyncratic component of returns.
CISDM (2006) in their work have exhibited that direct commodity investment can
provide significant portfolio diversification benefits to traditional stock and bond portfolios
and can provide return opportunities not only beyond those achievable from
commodity-based stock and bond investment, but also beyond that of simple inflation hedging.
Erb, C.B. and C.R. Harvey (2006), have evidenced that commodity futures are an
inconsistent, if not weak, hedge against unexpected inflation. Their portfolio analysis
suggests that a long-only strategic allocation to commodities as a general asset class is a bet
on the future term structure of commodity prices, in general, and on specific portfolio
weighting schemes, in particular. They have examined three trading strategies that use both
momentum and the term structure of futures prices and have found that the tactical strategies
By examining the role of commodities in a portfolio consisting of five futures assets
(one commodity and four stock indices) and a money market asset over the period November
1994 to March 2007, Laws and Thompson (2007) have showed that introduction of
commodities provided an increase in return without a corresponding rise in risk
Greer (2007) observes that a typical client allocation to commodity futures is about
five percent, but the same can easily be made for a fifteen percent allocation based on desired
risk and return parameters.
As exhibited by Nguyeny and Sercu (2010), the performance of out-of-sample
optimal portfolios show that the proposed strategy with commodity futures performs better
than (i) any stand- alone assets (stocks, bonds, commodity futures); (ii) the optimal portfolio
without commodity futures and (iii) strategies that consider only one type of information. If
the business cycle is divided three stages (early, middle and late), then they have suggested a
strategy to go long commodity futures: (i) with a restrictive policy in middle, late stages of
booms and during the recession; and (ii) under an expansive policy: in a boom.
Conover, Jensen, Johnson, and Mercer (2010) in their study, based on a sample period
of 36 years, have shows substantial benefits to commodity investments regardless of the
equity style that an investor pursues. Interestingly they have shown that, adding a commodity
exposure enhances an equity portfolio’s return mostly during periods when the Central Bank
increases interest rates, which is consistent with the belief that a major attraction of
commodities is that they serve as an inflation hedge.
III. DATA AND METHODOLOGY
DATA
The daily price information on three major asset classes, Bonds, Equities, and Commodities,
both at the individual asset as well as index levels, has been studied. The seven years sample
period, starting from 2005 till 2011 (May) is chosen for the study. Even if the daily price
information in the bond market is collected only during 2010, the annual return and volatility
details for securities with different tenors are collected separately for the concerned analysis.
Five different benchmark, as on May 2011, coupon bonds (8.00% G.S. 2011, 10.25% G.S.
2012, 9.00% G.S. 2013, 12.30% G.S. 2016, and 10.70% G.S. 2020) of different tenors (less
(CCIL-B-TRI, CCIL-B-PRI, CCIL-L-TRI, CCIL-L-PRI), both Broad based and Liquid indices
brought out by Clearing Corporation of India Limited (CCIL), are used in the study. The
tenor specific security wise annual average returns or yields and yield volatility has been
collected from the Handbook of Statistics on Indian Economy, published by the Reserve
Bank of India (RBI). In regards to the commodity class, 1 overall commodity index (MCX
COMDEX), 3 sector-specific (MCX AGRI, MCX ENERGY, and MCX METAL) indices, and 6
individual non-agricultural commodities (Aluminum, Copper, Crude Oil, Gold, Natural Gas,
and Silver), both from the underlying Spot and Futures segments have been included in the
study. 6 equity indices namely NIFTY, NIFTY JUNIOR, S&P500, BANK NIFTY, ENERGY,
and MIDCAP; along with 8 individual stocks namely INFOSYS, IOC, ONGC, RELIANCE,
SAIL, SBIN, TELCO, and TISCO, only from the spot segment, are considered to represent the
equity segment of the investment portfolio. Since Indian banks are not allowed to trade on
equity derivatives contracts, equity futures contracts, even if very actively traded in India, are
kept outside the scope of this study. Daily equity price details of another 7 companies, viz.
Hindalco Industries Ltd., National Aluminum Co. Ltd., Hindustan Oil Exploration Co. Ltd.,
Oil & Natural Gas Corporation. Ltd., Jindal Steel & Power Ltd., Steel Authority of India Ltd.,
Tata Steel Ltd., engaged in various commodity business, have also been collected to
understand whether they can be used as an alternative to other direct or indirect channels of
commodity investment. All commodities and equity related data have been collected
respectively from the website of Multi Commodity Exchange (MCX) and National Stock
Exchange (NSE). Data on all commodity futures contract represents the Nearest Month
contract due to their highest liquidity among all others, expired at different months.
METHODOLOGY
A preliminary attempt has been made to quantify the risk and return in commodity market, in
comparison with that of the other conventional asset classes. Different univariate and
bivariate basic statistical measures are estimated to understand the risk-return characteristics
of individual assets and also to understand the co-movements among different asset classes,
over a period of seven years. Annualized average returns and volatility (Standard Deviation),
over different annual periods, in all the three major asset classes, viz. Bond, Equity, and
Commodity, have been calculated, assuming that there are 250 trading days in a year. The
average of daily logarithmic return in equities and commodities over different annual periods
number of trading days in a year. At the same time, the average variation (Standard
Deviation) over different annual periods have also been transformed into annual volatility by
considering the product of daily average variation and square root of the assumed number of
trading days per year (i.e. Annual Volatility = Daily S.D. × √250). As far as the annual return
or yield in the bond market is concerned, a dual treatement has been followed to deal with the
bond indices and the individual bonds. The daily and annualized average return and volatility
of the bond indices is calculated in the way similar to the other asset class. But since most of
the bonds in market like India are expected to be hold till the maturity and accordingly
redeemed at the face value, the average market yield expected to be generated on bond with
different tenors are used as the proxy return measures for the individual bonds. The annual
average yield on Government Dated securities for various maturities, published on monthly
basis, is used to replicate the average annual return expected to be generated from the
concerned asset class. Since bonds have a fixed lives and the return from the same also
depends on the maturity period, the annual return of a specific fixed income security over
different annual periods cannot be compared. Therefore, instead of following the approach of
averaging daily logarithmic price change followed by annualizing the same, the annual yield
data on fixed income securities of various tenors have been straight way picked up from the
concerned data source as published by the RBI. On the other hand, the volatility of such yield
of different tenors has been calculated through the SD of monthly annualized return on all the
concerned securities.
In order to incorporate the trade-off between the return and risk, annual
comprehensive measure, called Sharpe Ratio, has also been calculated for all the individual
assets in different asset classes. This figure exhibits the strength of excess returns (Concerned
Return minus the Risk-free Return) of different assets in relation to their individual risk.
Alternatively, the ratio is defined as:
Sharpe Ratio = (Asset Return – Risk Free Return) / S. D. of Asset Return
All the figures are annualized and the annual yield on 364 Days Treasury bill has been
considered as the risk free returns. Even if the risk-free rate is practically set based on the
investment horizon of the investors, the 364 Days T-bill rate is invariably used as a proxy of
annual risk-free return to enable the investors to understand the per unit risk premium of
different assets under various asset classes. This ratio enables the investors to evaluate the
performance of different assets not by taking separate views on their return and risk, but by
All the above statistical measures are applied in the study to understand the relative
performance of individual assets under different asset classes. But since a typical institutional
investor like banks are actually concerned about the performance of their whole investment
portfolio created by taking exposure in different asset classes like bonds equities,
commodities, etc., the investors may have a serious concern while constructing such portfolio.
One of the important facts that investors always try ensure is how to ensure Portfolio
Diversification. Alternatively, investors generally tries to avoid concentration risk of a
specific asset class and prefer to include such securities in their portfolio so that the high risk
in one asset class gets set-off by the lower risk of other asset class (s). This possibility again
can be ensured by selecting asset classes the prices of which moves inversely, not within the
class but across the asset classes. A negative value of coefficient of correlation or at least a
significantly small positive correlation across the prices of various asset classes is important
to confirm a natural diversification in the portfolio. Therefore, apart from analyzing the risk
and return of different commodity related assets, comparative to the traditional asset classes
like bonds and equities, the impact of different alternative channels of commodity
investments are also examined to ensure the important concern of portfolio diversification.
The Pearson’s Coefficient of Correlation among different pairs of assets are calculated to
verify whether the movements of commodity prices, both at the index level and individual
commodity level, are inversely or at least poorly related with the price movements in other
traditional asset classes. The yearly transformation of the direction and magnitude of such
co-movements between the asset classes also exhibit the possibility of strengthening or
weakening the diversification opportunity.
IV. EMPIRICAL FINDINGS
The opportunities of direct investments in several commodities or in other alternative
channels, such as commodity indices, commodity futures contracts, or commodity based
equities, are analyzed and compared with other assets in various asset classes such as bonds
and equities. Results derived from various statistical measures are explained to support the
well established fact that commodities or its alternative channels plays a very significant role
in creating an optimum investment portfolio, especially for the institutional investors like
banks in India. Findings of the basic statistical measures, as discussed in the previous section,
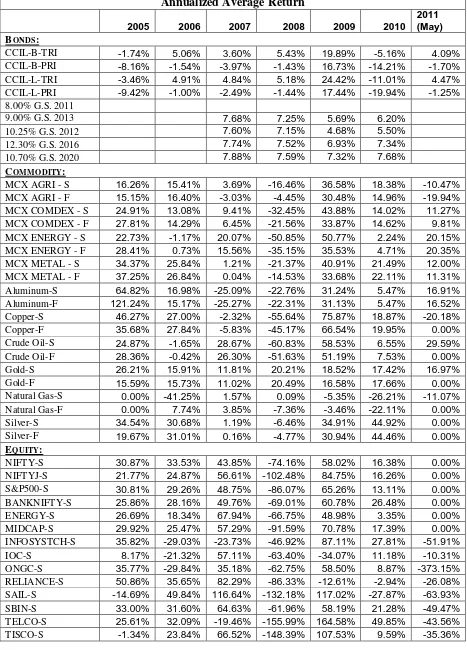
Basic statistical characteristics of some selected assets under various asset classes,
during the period 2005 to 2011 (till May), are exhibited in Table 1 and Table 2. The
annualized average return figures clearly exhibit the fact that almost all the commodity
indices, both spot and futures, and the selected individual commodity futures contracts
generate significantly higher return comparative to the other assets such as bonds and equities.
But interestingly, the average return, calculated from the price change, during the year 2008
in almost all the assets irrespective to any specific asset class are found to be negative, may
be due to the world-wide effect of US sub-prime crisis. Possibility of generating higher return
makes the commodity market more interesting for the investors who are looking for
leveraging the return on their whole portfolio, but at the same time may be ready to bear little
higher risk comparative to other typical investment portfolio only consists of traditional asset
classes. The common market view “Greater the Risk, Higher will be the Return” is also duly
captured in this study. There is no doubt that investors get a comparative advantage in the
commodity market to generate higher return, but the fact, as exhibited in Table 2, that it
brings greater risk as well is also reflected in the study. The concerned table has shown how
the average variation in the commodity returns are higher, comparative to the other assets, in
almost all the years from 2005 to 2011.
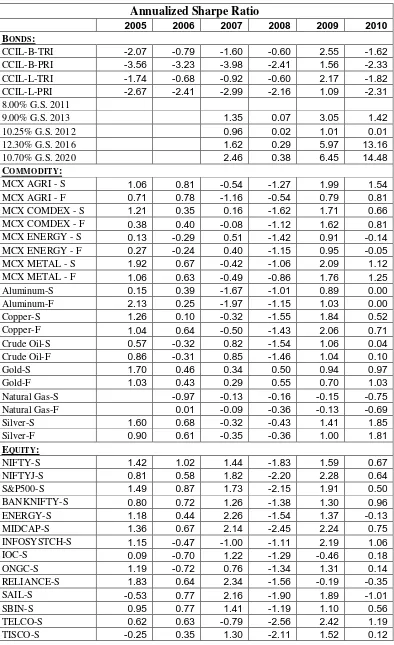
Giving due consideration to the positive trade-off between risk and return, as
validated in the above tables, an attempt has been made to evaluate the performance of
individual assets under various asset classes neither looking solely at the return nor at the risk,
but by comparing some return measures adjusted with the risk. Accordingly the annual
Sharpe Ratio for all the assets under various asset classes is calculated and values are
reported in Table 3. Even if there is a mixed result between commodities and equities, the
risk adjusted performance of commodity indices or individual commodity futures are
expected to be quite different than the bonds, not exclusively reflected in the study due to the
inconsistency in the selection of return measure among the asset class. As reflected in the
returns figures for all the assets during the year 2008, the overall performance of almost all
the assets are also found to be negative during the same period due the wider disturbance in
the market. The transition of annual performance of the commodity indices, both spot and
futures, and also of the selected commodity futures contracts, over the years, is graphically
exhibited respectively in Figure 1 and Figure 2. Even if the change in the performance over
the sample period is similar for most of the commodity indices, the trend of the performance
during the year 2006 and 2008. Even if the risk adjusted performance of the commodity
segment has invariably improved from 2008 to 2009, but subsequently there is a significant
deterioration in the performance during the following year, may be due to the post-crisis
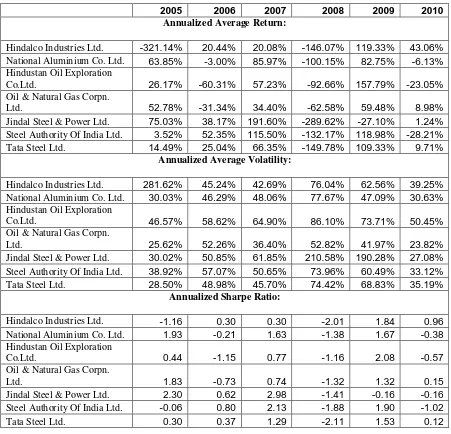
effect. Since the investing in equities of companies dealing with various commodities can be
treated as an alternative channel of commodity investment, an effort has been made to
validate the strength of this alternative channel by examining the performance of such
commodity based equities during the sample period. The annualized return, risk, and risk
adjusted performance measures are reported in Table 4. Even if the performance measures, if
compared between that of bonds and other non-commodity based equities, exhibit the similar
fact as captured otherwise by considering direct commodities, commodities and commodity
based equities cannot be a close substitute of each other while deciding the investment
strategy. The poor and sometime even negative correlation between the returns of some
selected commodities and their related equities, as exhibited in Table 5, clearly depict the fact
that commodity based equities cannot be invariably used as an alternative to direct
commodity investment. It has also been attempted to compare the annual risk adjusted
performance of some commodity based equities and their related commodity futures
contracts, as figured out in Figure 4. Even if 2008 onwards, both the asset classes tends to
perform with a close similarity, but there was a significant difference in the trend of
performance among the two asset class during 2005 to 2008. Especially, Hindalco Industries
and National Aluminum Co. Ltd. have been found to perform quite different in comparison
with their related commodities, such as Copper and Aluminum futures contracts. Even if both
the asset classes are related to commodities, due to significant differences in the underlying
factors affecting the risk and return of both the asset classes, they cannot be used
interchangeably while creating an investment portfolio.
When the annual risk adjusted performance of some selected commodity index
futures and individual commodity futures contracts are compared with that of some other
assets from bond and equity market, as exhibited in Figure 5, the results are found to be quite
interesting, as also supported by Table 3. Even if the direction and degree of movements
during the whole period is almost consistent for the equity and bond related assets, the
commodity instruments are found to possess a different behavior throughout the period. This
possibility makes the commodity market little different than the other conventional asset
classes, and will help the investor to ensure that his portfolio can be diversified if
Apart from being supported by the dissimilar trend in the performance of the
traditional asset classes with that of commodities or commodity related instruments, the
possibility of achieving diversification benefits to the institutional investors can also be
ensured by looking into the co-movements in the returns of different bond and equity related
assets with that of actual commodities or their alternatives, as figured out in Table 6 to Table
8. The correlation in the returns of individual commodity futures contracts with that of all
other assets during the year 2010 are exhibited in Table 6, followed by the correlation among
overall and sector specific commodity indices (both spot and futures) and all other assets in
Table 7. Annual correlations between the returns of major indices in equity, bond and
commodity market during 2005 to 2010 are exhibited in Table 8. The results are interestingly
found to be consistent in all the three tables. Even if the correlations among the returns in
equity and commodity related instruments, almost throughout the period, are found to be
positive, a negative association has been observed between the bond and commodity market,
irrespective of the type (index or individual asset) of the asset, market segment (Spot or
Futures), or the period of study. These results invariably support the fact that an institutional
investor can easily diversify the risk of their portfolio with a reasonable amount of investment
in commodities or commodity related instruments. The negative correlation among the asset
in a portfolio always ensures that the portfolio risk can be optimized by including even risky
assets, but definitely at an optimum proportion.
V. SUMMARY & CONCLUSION
Unlike in case of developed market, institutional investors like banks in India are restricted to
take any direct exposure in commodities except in some bullion. It is very well known that in
a competitive world, it is very difficult to make successful investments without optimizing
the two important parameters of any investment – Return and Risk. Portfolio return can be
maximized only by including some assets that offers a higher yield comparative to normal
market rate. Now the assets that offers higher average return also brings higher risk in the
portfolio, which again need to me minimized to make the investment portfolio truly optimum,
both from the risk and return perspective. It has been well established that commodities gives
higher return and also bring higher risk. Therefore, investment in commodities or commodity
related instruments is one of the essential ways to leverage the portfolio return. But at the
same time, to encounter the higher risk in commodity investment, the portfolio manager
portfolio risk is naturally diversified. Commodities or commodity related instruments not
only offers a higher returns, but also help an investor to create a well diversified portfolio.
There are numerous studies in support of commodity investments. But the attention given by
the major Indian institutional investors in this segment is comparatively very poor. Even if
after a serious attempt from the regulators, the commodity investments in India is restricted
only to a few market players, resulting into the existence of an inefficient market. Since
banks in India are considered to be the major institutional investors, without having any
significant exposure in commodity market except in their loan book, they truly lag behind in
creating an optimum investment portfolio. The author has made an attempt to establish the
fact that by investing in commodities or it alternative channels, institutional investors like
banks can not only compensate for the lower risk-free returns in their major chunk of
investments in Government securities, but also will be able to diversify some amount of their
portfolio risk which is expected to rise by taking exposure in commodity market. The results
exhibited in all the tables and figures clearly depict that investment in alternative channels
like commodity indices or commodity futures contracts in India will not only allow the
institutional investors to leverage their portfolio return, but also will ensure that
diversification benefits is achieved. Therefore, even if investment in direct commodities are
restricted for Indian banks, but still there is a significant opportunity for them to invest in the
REFERENCES:
Bjornson B. and C.A. Carter (1997), “New Evidence on Agricultural Commodity
Return Performance under Time-Varying Risk", American Journal of Agricultural
Economics, Vol. 79, pp. 918-930
Bodie. Z., and Rosansky, V. (1980, May/June), “Risk and Return in Commodity
Futures”, Financial Analysts Journal, pp. 27-39.
C. Mitchell Conover, Gerald R. Jensen, Robert R. Johnson, Jeffrey M. Mercer (Fall 2010), “Is Now the Time to Add Commodities to Your Portfolio?” The Journal of
Investing, Vol. 19, No. 3: pp. 10-19
Center for International Securities and Derivatives Markets- CISDM (2006), “The Benefits of Commodity Investment: 2006 Update” Isenberg School of Management,
University of Massachusetts, Amherst, Massachusetts, 01003
Edwards, F. and Park, J. (1996), “Do Managed Futures Make Good Investments?”
The Journal of Futures Markets, Vol. 16, pp. 475-5I7.
Elton, E., Gruber, M., and Rentzler, J. (1987, April), “Professionally Managed,
Publicly Traded Commodity Funds”, Journal of Business, pp. 177-199
Emmet Doyle, Jonathan Hill, and Ian Jack (2007), “Growth in Commodity
investment: risks and challenges for commodity market participants”, FSA Markets
Infrastructure Department
Erb, C.B. and C.R. Harvey (2006), “The Tactical and Strategic Value of Commodity
Futures", Duke University Working Paper, pp 61
Gorton, G. and Rouwenhorst, K.G. (2005), “Facts and fantasies about commodity
futures”, Yale ICF working paper no. 04-20, pp40.
Greer, R.J. (2000), “The Nature of Commodity Index Returns." The Journal of
Greer, Robert J. (2007), “The Role of Commodities in Investment Portfolios”, CFA
Institute, Conference Proceedings Quarterly (December), pp. 35-44
Irwin, S., and Landa, D. (1987, Fall), “Real-estate, Futures, and Gold as Portfolio
Assets”, The Journal of Portfolio Management, pp. 29-34
Irwin, S., Brrorsen, W. (1985, Fall), “Public Futures Funds”, The Journal of Futures
Markets, pp. 463-85
Jason Laws and John Thompson (May 2007), “Portfolio Diversification and
Commodity Futures”, Working Paper, Liverpool Business School, Liverpool John
Moores University, John Foster Building, Mount Pleasant, Liverpool
Jensen, G., Johnson, R.R.and Mercer, J.M. (2002), “Tactical asset allocation and commodity futures”, The Journal of Portfolio Management, Summer, pp. 100-110
Jensen, G., R.R. Johnson and J.M. Mercer (2000), “Efficient Use of Commodity Futures in Diversified Portfolio", The Journal of Futures Markets, Vol. 20(5), pp.
489-506
Kaplan, P. D. and Lummer, S.L., (1998), “Update: GCSI collateralized futures as a
hedging and diversification tool for institutional portfolios”, The Journal of Investing,
Winter, pp. 11 -17.
Lee, C., Leuthold. R., and Cordier, J. (1985, July/August). “The slock market and
commodities Futures market: Diversification and Arbitrage Potential”, Financial
Analysts Journal, pp. 53-60
Lummer, S.L. and L.B. Siegel (Summer 1993), “GSCI Collateralized Futures: A
Hedging and Diversi_cation Tool for Institutional Portfolio" The Journal of Investing,
Vol: Summer, pp. 75-82.
Roache, S.K. (2008), “Commodities and Market Price of Risk", IMF Working Paper,
WP/08/221.
Van Thi Tuong Nguyen and Piet Sercu (November, 2010), “Tactical Asset Allocation
with Commodity Futures: Implications of Business Cycle and Monetary Policy”,
Working Paper
Table 1: Average Returns of Different Assets in Various Asset Classes
Annualized Average Return
2005 2006 2007 2008 2009 2010
2011 (May)
BONDS:
CCIL-B-TRI -1.74% 5.06% 3.60% 5.43% 19.89% -5.16% 4.09%
CCIL-B-PRI -8.16% -1.54% -3.97% -1.43% 16.73% -14.21% -1.70%
CCIL-L-TRI -3.46% 4.91% 4.84% 5.18% 24.42% -11.01% 4.47%
CCIL-L-PRI -9.42% -1.00% -2.49% -1.44% 17.44% -19.94% -1.25%
8.00% G.S. 2011
9.00% G.S. 2013 7.68% 7.25% 5.69% 6.20%
10.25% G.S. 2012 7.60% 7.15% 4.68% 5.50%
12.30% G.S. 2016 7.74% 7.52% 6.93% 7.34%
10.70% G.S. 2020 7.88% 7.59% 7.32% 7.68%
COMMODITY:
MCX AGRI - S 16.26% 15.41% 3.69% -16.46% 36.58% 18.38% -10.47%
MCX AGRI - F 15.15% 16.40% -3.03% -4.45% 30.48% 14.96% -19.94%
MCX COMDEX - S 24.91% 13.08% 9.41% -32.45% 43.88% 14.02% 11.27%
MCX COMDEX - F 27.81% 14.29% 6.45% -21.56% 33.87% 14.62% 9.81%
MCX ENERGY - S 22.73% -1.17% 20.07% -50.85% 50.77% 2.24% 20.15%
MCX ENERGY - F 28.41% 0.73% 15.56% -35.15% 35.53% 4.71% 20.35%
MCX METAL - S 34.37% 25.84% 1.21% -21.37% 40.91% 21.49% 12.00%
MCX METAL - F 37.25% 26.84% 0.04% -14.53% 33.68% 22.11% 11.31%
Aluminum-S 64.82% 16.98% -25.09% -22.76% 31.24% 5.47% 16.91%
Aluminum-F 121.24% 15.17% -25.27% -22.31% 31.13% 5.47% 16.52%
Copper-S 46.27% 27.00% -2.32% -55.64% 75.87% 18.87% -20.18%
Copper-F 35.68% 27.84% -5.83% -45.17% 66.54% 19.95% 0.00%
Crude Oil-S 24.87% -1.65% 28.67% -60.83% 58.53% 6.55% 29.59%
Crude Oil-F 28.36% -0.42% 26.30% -51.63% 51.19% 7.53% 0.00%
Gold-S 26.21% 15.91% 11.81% 20.21% 18.52% 17.42% 16.97%
Gold-F 15.59% 15.73% 11.02% 20.49% 16.58% 17.66% 0.00%
Natural Gas-S 0.00% -41.25% 1.57% 0.09% -5.35% -26.21% -11.07%
Natural Gas-F 0.00% 7.74% 3.85% -7.36% -3.46% -22.11% 0.00%
Silver-S 34.54% 30.68% 1.19% -6.46% 34.91% 44.92% 0.00%
Silver-F 19.67% 31.01% 0.16% -4.77% 30.94% 44.46% 0.00%
EQUITY:
NIFTY-S 30.87% 33.53% 43.85% -74.16% 58.02% 16.38% 0.00%
NIFTYJ-S 21.77% 24.87% 56.61% -102.48% 84.75% 16.26% 0.00%
S&P500-S 30.81% 29.26% 48.75% -86.07% 65.26% 13.11% 0.00%
BANKNIFTY-S 25.86% 28.16% 49.76% -69.01% 60.78% 26.48% 0.00%
ENERGY-S 26.69% 18.34% 67.94% -66.75% 48.98% 3.35% 0.00%
MIDCAP-S 29.92% 25.47% 57.29% -91.59% 70.78% 17.39% 0.00%
INFOSYSTCH-S 35.82% -29.03% -23.73% -46.92% 87.11% 27.81% -51.91%
IOC-S 8.17% -21.32% 57.11% -63.40% -34.07% 11.18% -10.31%
ONGC-S 35.77% -29.84% 35.18% -62.75% 58.50% 8.87% -373.15%
RELIANCE-S 50.86% 35.65% 82.29% -86.33% -12.61% -2.94% -26.08%
SAIL-S -14.69% 49.84% 116.64% -132.18% 117.02% -27.87% -63.93%
SBIN-S 33.00% 31.60% 64.63% -61.96% 58.19% 21.28% -49.47%
TELCO-S 25.61% 32.09% -19.46% -155.99% 164.58% 49.85% -43.56%
Table 2: Average Volatility of Different Assets in Various Asset Classes
Annualized Average Volatility
2005 2006 2007 2008 2009 2010
2011 (May)
BONDS:
CCIL-B-TRI 3.70% 2.30% 2.37% 2.84% 6.15% 6.58% 1.92%
CCIL-B-PRI 3.95% 2.61% 2.85% 3.55% 8.03% 8.47% 2.53%
CCIL-L-TRI 5.38% 2.92% 2.77% 3.27% 9.32% 9.09% 2.33%
CCIL-L-PRI 5.75% 3.27% 3.31% 3.97% 12.13% 11.00% 2.93%
8.00% G.S. 2011
9.00% G.S. 2013 0.21% 1.74% 0.48% 0.49%
10.25% G.S. 2012 0.22% 1.82% 0.45% 0.56%
12.30% G.S. 2016 0.21% 1.37% 0.45% 0.14%
10.70% G.S. 2020 0.20% 1.23% 0.48% 0.15%
COMMODITY:
MCX AGRI - S 9.78% 10.52% 6.81% 18.63% 16.27% 8.37% 9.17%
MCX AGRI - F 13.04% 12.21% 8.99% 21.26% 33.39% 11.66% 26.28%
MCX COMDEX - S 15.66% 17.65% 12.89% 24.37% 23.14% 12.86% 14.93%
MCX COMDEX - F 57.65% 18.55% 12.03% 25.57% 18.27% 11.28% 14.91%
MCX ENERGY - S 125.12% 27.32% 24.76% 40.72% 51.10% 23.34% 24.96%
MCX ENERGY - F 83.18% 25.22% 20.63% 36.88% 33.06% 17.38% 23.23%
MCX METAL - S 14.79% 28.37% 14.61% 26.80% 17.52% 14.34% 16.04%
MCX METAL - F 29.44% 31.69% 14.92% 25.16% 16.72% 13.26% 14.61%
Aluminum-S 383.91% 25.99% 19.50% 29.45% 30.36% 21.90% 14.71%
Aluminum-F 54.19% 33.35% 16.59% 25.54% 26.07% 20.14% 14.72%
Copper-S 32.09% 203.87% 29.96% 40.44% 38.96% 25.63% 20.91%
Copper-F 28.58% 32.57% 26.52% 36.62% 30.22% 20.46% 0.00%
Crude Oil-S 33.48% 26.89% 25.95% 44.10% 51.09% 23.69% 31.65%
Crude Oil-F 26.16% 23.87% 22.29% 40.31% 44.98% 21.09% 0.00%
Gold-S 11.91% 19.61% 12.97% 26.27% 15.20% 12.32% 10.98%
Gold-F 9.42% 20.43% 12.47% 24.14% 17.77% 11.79% 0.00%
Natural Gas-S 0.00% 49.79% 45.85% 43.76% 64.17% 42.24% 31.64%
Natural Gas-F 0.00% 64.82% 40.67% 39.71% 57.75% 40.08% 0.00%
Silver-S 17.94% 34.75% 19.30% 31.57% 21.82% 21.32% 0.00%
Silver-F 15.23% 39.46% 20.67% 33.19% 26.63% 21.58% 0.00%
EQUITY:
NIFTY-S 17.61% 26.09% 25.32% 44.40% 33.88% 16.19% 0.00%
NIFTYJ-S 19.51% 31.26% 27.05% 49.81% 35.29% 16.94% 0.00%
S&P500-S 16.75% 25.74% 23.89% 43.32% 31.87% 15.24% 0.00%
BANKNIFTY-S 24.99% 29.74% 33.63% 55.14% 43.54% 21.82% 0.00%
ENERGY-S 17.65% 25.79% 26.81% 47.83% 32.66% 16.14% 0.00%
MIDCAP-S 17.69% 27.63% 23.27% 40.32% 29.75% 15.94% 0.00%
INFOSYSTCH-S 26.03% 76.53% 31.16% 48.50% 37.78% 21.11% 27.66%
IOC-S 24.43% 40.50% 40.81% 54.81% 82.64% 31.39% 30.42%
ONGC-S 25.13% 51.30% 36.33% 52.15% 41.58% 23.59% 227.90%
RELIANCE-S 24.52% 45.00% 31.96% 60.06% 88.33% 24.44% 24.80%
SAIL-S 38.69% 56.15% 50.56% 73.19% 59.82% 33.01% 30.60%
SBIN-S 28.67% 31.92% 40.69% 57.88% 48.93% 28.17% 33.28%
TELCO-S 31.60% 40.08% 33.82% 63.70% 66.21% 37.16% 42.82%
Table 3: Annual Performance of Different Assets in Various Asset Classes
Annualized Sharpe Ratio
2005 2006 2007 2008 2009 2010
BONDS:
CCIL-B-TRI -2.07 -0.79 -1.60 -0.60 2.55 -1.62
CCIL-B-PRI -3.56 -3.23 -3.98 -2.41 1.56 -2.33
CCIL-L-TRI -1.74 -0.68 -0.92 -0.60 2.17 -1.82
CCIL-L-PRI -2.67 -2.41 -2.99 -2.16 1.09 -2.31
8.00% G.S. 2011
9.00% G.S. 2013 1.35 0.07 3.05 1.42
10.25% G.S. 2012 0.96 0.02 1.01 0.01
12.30% G.S. 2016 1.62 0.29 5.97 13.16
10.70% G.S. 2020 2.46 0.38 6.45 14.48
COMMODITY:
MCX AGRI - S 1.06 0.81 -0.54 -1.27 1.99 1.54
MCX AGRI - F 0.71 0.78 -1.16 -0.54 0.79 0.81
MCX COMDEX - S 1.21 0.35 0.16 -1.62 1.71 0.66
MCX COMDEX - F 0.38 0.40 -0.08 -1.12 1.62 0.81
MCX ENERGY - S 0.13 -0.29 0.51 -1.42 0.91 -0.14
MCX ENERGY - F 0.27 -0.24 0.40 -1.15 0.95 -0.05
MCX METAL - S 1.92 0.67 -0.42 -1.06 2.09 1.12
MCX METAL - F 1.06 0.63 -0.49 -0.86 1.76 1.25
Aluminum-S 0.15 0.39 -1.67 -1.01 0.89 0.00
Aluminum-F 2.13 0.25 -1.97 -1.15 1.03 0.00
Copper-S 1.26 0.10 -0.32 -1.55 1.84 0.52
Copper-F 1.04 0.64 -0.50 -1.43 2.06 0.71
Crude Oil-S 0.57 -0.32 0.82 -1.54 1.06 0.04
Crude Oil-F 0.86 -0.31 0.85 -1.46 1.04 0.10
Gold-S 1.70 0.46 0.34 0.50 0.94 0.97
Gold-F 1.03 0.43 0.29 0.55 0.70 1.03
Natural Gas-S -0.97 -0.13 -0.16 -0.15 -0.75
Natural Gas-F 0.01 -0.09 -0.36 -0.13 -0.69
Silver-S 1.60 0.68 -0.32 -0.43 1.41 1.85
Silver-F 0.90 0.61 -0.35 -0.36 1.00 1.81
EQUITY:
NIFTY-S 1.42 1.02 1.44 -1.83 1.59 0.67
NIFTYJ-S 0.81 0.58 1.82 -2.20 2.28 0.64
S&P500-S 1.49 0.87 1.73 -2.15 1.91 0.50
BANKNIFTY-S 0.80 0.72 1.26 -1.38 1.30 0.96
ENERGY-S 1.18 0.44 2.26 -1.54 1.37 -0.13
MIDCAP-S 1.36 0.67 2.14 -2.45 2.24 0.75
INFOSYSTCH-S 1.15 -0.47 -1.00 -1.11 2.19 1.06
IOC-S 0.09 -0.70 1.22 -1.29 -0.46 0.18
ONGC-S 1.19 -0.72 0.76 -1.34 1.31 0.14
RELIANCE-S 1.83 0.64 2.34 -1.56 -0.19 -0.35
SAIL-S -0.53 0.77 2.16 -1.90 1.89 -1.01
SBIN-S 0.95 0.77 1.41 -1.19 1.10 0.56
TELCO-S 0.62 0.63 -0.79 -2.56 2.42 1.19
Table 4: Performance Evaluation of Different Commodity Based Equities
2005 2006 2007 2008 2009 2010
Annualized Average Return:
Hindalco Industries Ltd. -321.14% 20.44% 20.08% -146.07% 119.33% 43.06%
National Aluminium Co. Ltd. 63.85% -3.00% 85.97% -100.15% 82.75% -6.13%
Hindustan Oil Exploration
Co.Ltd. 26.17% -60.31% 57.23% -92.66% 157.79% -23.05%
Oil & Natural Gas Corpn.
Ltd. 52.78% -31.34% 34.40% -62.58% 59.48% 8.98%
Jindal Steel & Power Ltd. 75.03% 38.17% 191.60% -289.62% -27.10% 1.24%
Steel Authority Of India Ltd. 3.52% 52.35% 115.50% -132.17% 118.98% -28.21%
Tata Steel Ltd. 14.49% 25.04% 66.35% -149.78% 109.33% 9.71%
Annualized Average Volatility:
Hindalco Industries Ltd. 281.62% 45.24% 42.69% 76.04% 62.56% 39.25%
National Aluminium Co. Ltd. 30.03% 46.29% 48.06% 77.67% 47.09% 30.63%
Hindustan Oil Exploration
Co.Ltd. 46.57% 58.62% 64.90% 86.10% 73.71% 50.45%
Oil & Natural Gas Corpn.
Ltd. 25.62% 52.26% 36.40% 52.82% 41.97% 23.82%
Jindal Steel & Power Ltd. 30.02% 50.85% 61.85% 210.58% 190.28% 27.08%
Steel Authority Of India Ltd. 38.92% 57.07% 50.65% 73.96% 60.49% 33.12%
Tata Steel Ltd. 28.50% 48.98% 45.70% 74.42% 68.83% 35.19%
Annualized Sharpe Ratio:
Hindalco Industries Ltd. -1.16 0.30 0.30 -2.01 1.84 0.96
National Aluminium Co. Ltd. 1.93 -0.21 1.63 -1.38 1.67 -0.38
Hindustan Oil Exploration
Co.Ltd. 0.44 -1.15 0.77 -1.16 2.08 -0.57
Oil & Natural Gas Corpn.
Ltd. 1.83 -0.73 0.74 -1.32 1.32 0.15
Jindal Steel & Power Ltd. 2.30 0.62 2.98 -1.41 -0.16 -0.16
Steel Authority Of India Ltd. -0.06 0.80 2.13 -1.88 1.90 -1.02
Table 5: Correlations between Selected Commodities and Related Commodity based Equities
Commodity vs. Equity Whole
Period 2005 2006 2007 2008 2009 2010
Alluminium(S)-National
Aluminium Co. Ltd. 15.61% -10.77% 36.58% 14.43% 10.74% 11.54% 11.93% Alluminium(F)-National
Aluminium Co. Ltd. 11.13% 3.01% 28.43% -0.86% 7.02% 3.13% 20.78% Copper (S) - Hindalco
Industries Ltd. 3.64% -1.14% 3.01% 17.70% 14.59% 24.76% 10.76% Copper (F) - Hindalco
Industries Ltd. 5.75% -18.44% 17.60% 9.26% 21.88% 25.72% 29.99% Crude Oil (S) -
Hindustan Oil Exploration Co. Ltd.
13.18% -11.40% 15.34% 4.99% 20.73% 14.70% 12.23%
Crude Oil (F) - Hindustan Oil Exploration Co. Ltd.
11.07% 10.15% 18.89% -4.80% 17.29% 7.40% 11.53%
Crude Oil (S) - ONGC 10.10% -2.41% 6.52% 1.56% 10.06% 18.17% 15.70%
Crude Oil (F) - ONGC 15.21% 3.91% 12.21% 9.26% 12.82% 25.38% 18.07%
Natural Gas (S) - ONGC 3.03% NA 15.85% 8.74% -5.11% 1.34% 5.25%
Table 6: Correlations among Individual Commodity Futures and Other Asset Classes during 2010
ALUMINIUM - F
COPPER - F
CRUDE OIL - F
GOLD - F
NATURAL GAS - F
SILVER - F
NIFTY-S 26% 25% 30% -10% -3% 16%
ENERGY-S 21% 24% 26% -8% -3% 14%
INFOSYSTCH-S 18% 13% 19% -9% 4% 9%
IOC-S 16% 12% 13% 0% -6% 0%
RELIANCE-S 13% 18% 18% -8% 3% 14%
SAIL-S 18% 18% 23% -14% -14% 9%
TISCO-S 27% 27% 26% -13% -5% 10%
ALUMINIUM-F 100% 73% 42% -2% 3% 28%
COPPER-F 73% 100% 45% 7% 1% 37%
CRUDEOIL-F 42% 45% 100% 1% -13% 26%
GOLD-F -2% 7% 1% 100% 9% 59%
NATURALGAS-F 3% 1% -13% 9% 100% 6%
SILVER-F 28% 37% 26% 59% 6% 100%
MCXAGRI-F 11% 6% 16% -8% 2% -3%
MCXCOMDEX-F 48% 57% 58% 30% 11% 54%
MCXENERGY-F 34% 39% 72% 7% 12% 27%
MCXMETAL-F 47% 60% 26% 49% 7% 67%
USDINR-S -16% -14% -13% 19% 4% -5%
8.00% G.S. 2011 5% -2% -6% 2% -5% 2%
9.00% G.S. 2013 -4% -9% -8% -3% -5% -2%
10.25% G.S. 2012 2% -3% -4% 3% -5% 4%
12.30% G.S. 2016 -10% -8% -10% 3% -4% -4%
10.70% G.S. 2020 -12% -10% -6% 7% -6% -5%
MCXAGRI-S 16% 18% 20% 0% 3% 6%
MCXCOMDEX-S 25% 20% 40% 1% -6% 15%
MCXENERGY-S 15% 11% 38% -5% -5% 10%
Table 7: Correlations among Commodity Indices (Spot & Futures) and Other Asset Classes during the Year 2010 MCXAGRI - F MCXCOMDEX - F MCXENERGY - F MCXMETAL - F MCXAGRI - S MCXCOMDEX - S MCXENERGY - S MCXMETAL - S
NIFTY-S 19% 20% 16% 12% 27% 38% 37% 21%
ENERGY-S 17% 17% 14% 11% 25% 28% 25% 17%
INFOSYSTCH-S 7% 12% 10% 8% 13% 23% 26% 10%
IOC-S 15% 10% 8% 5% 14% 2% -4% 5%
RELIANCE-S 17% 15% 11% 10% 15% 22% 19% 16%
SAIL-S 18% 9% 8% 2% 17% 35% 33% 23%
TISCO-S 13% 19% 17% 12% 29% 40% 33% 29%
ALUMINIUM-F 11% 48% 34% 47% 16% 25% 15% 26%
COPPER-F 6% 57% 39% 60% 18% 20% 11% 20%
CRUDEOIL-F 16% 58% 72% 26% 20% 40% 38% 24%
GOLD-F -8% 30% 7% 49% 0% 1% -5% 8%
NATURALGAS-F 2% 11% 12% 7% 3% -6% -5% -6%
SILVER-F -3% 54% 27% 67% 6% 15% 10% 14%
MCXAGRI-F 100% 24% 13% 4% 42% 19% 17% 7%
MCXCOMDEX-F 24% 100% 85% 84% 20% 29% 24% 21%
MCXENERGY-F 13% 85% 100% 48% 16% 32% 30% 19%
MCXMETAL-F 4% 84% 48% 100% 9% 14% 8% 16%
USDINR-S -10% -6% -10% 2% -19% -36% -28% -31%
8.00% G.S. 2011 -6% -5% -3% -3% 1% 3% -2% 8%
9.00% G.S. 2013 0% -8% -8% -6% -1% -6% -3% -8%
10.25% G.S. 2012 -1% -4% -4% -3% 2% -2% 1% -5%
12.30% G.S. 2016 -8% -7% -8% -2% -6% -17% -12% -16%
10.70% G.S. 2020 -1% -6% -6% -4% 2% -12% -9% -12%
MCXAGRI-S 42% 20% 16% 9% 100% 34% 18% 22%
MCXCOMDEX-S 19% 29% 32% 14% 34% 100% 84% 78%
MCXENERGY-S 17% 24% 30% 8% 18% 84% 100% 33%
Table 8: Yearly Transition of Correlation among Indices from Different Asset Classes
Whole
Period 2006 2007 2008 2009 2010
NIFTY_NIFTYJ 89.44% 86.68% 85.38% 91.65% 90.73% 86.15%
NIFTY_CCIL-L-TRI 7.67% -4.07% 17.56% 2.39% 22.01% -19.08%
NIFTY_MCX-AGRI 5.79% -0.82% 4.65% 9.83% -3.72% 27.80%
NIFTY_MCX-COMDEX 18.91% 26.33% 25.88% 7.33% 22.70% 39.55%
NIFTY_MCX-ENERGY 16.35% 18.54% 12.65% 7.88% 22.45% 39.27%
NIFTYJ_CCIL-L-TRI 7.95% -3.99% 21.05% 1.35% 25.15% -14.11%
NIFTYJ_MCX-AGRI 6.65% 2.04% -2.35% 13.67% -6.66% 29.74%
NIFTYJ_MCX-COMDEX 16.09% 30.01% 20.31% 2.51% 20.05% 31.36%
NIFTYJ_MCX-ENERGY 13.78% 21.03% 12.63% 4.67% 19.07% 28.00%
CCIL-L-TRI_MCX-AGRI -6.06% 13.34% 6.73% -4.23% -10.38% -11.01%
CCIL-L-TRI_MCX-COMDEX -14.91% -3.63% 7.71% -31.20% -4.37% -18.54%
CCIL-L-TRI_MCX-ENERGY -12.36% -5.37% 4.42% -30.02% -1.27% -19.72%
MCX-AGRI_MCX-COMDEX 22.51% 33.94% 17.63% 11.82% 25.24% 35.49%
MCX-AGRI_MCX-ENERGY 9.03% 7.69% 3.80% 1.42% 13.56% 20.05%
Figure 1: Movement of Annual Performance of Commodity Indices
[image:28.595.75.515.438.712.2]Figure 3: Annual Performances of Commodity Based Equities
[image:29.595.78.528.468.736.2]