Assessment of Wastewater Quality of Drains for Irrigation
Almas Hamid1, Mahrukh Zeb1, Asim Mehmood2, Sana Akhtar1*, Samia Saif2
1Department of Environmental Sciences,Kinnaird College for Women, Lahore, Pakistan; 2Global Environmental Laboratories, La-
hore, Pakistan.
Email: *sanakhtar23@gmail.com
Received June 24th, 2013; revised July 26th, 2013; accepted August 23rd, 2013
Copyright © 2013 Almas Hamid et al. This is an open access article distributed under the Creative Commons Attribution License,
which permits unrestricted use, distribution, and reproduction in any medium, provided the original work is properly cited.
ABSTRACT
Rapid industrialization and overpopulation have stimulated increase in waste water both domestic and industrial. Due to lack of inefficient sewerage system and absence of treatment plants, the wastewater is discharged into drainage systems causing environmental and health implications. At various points, the wastewater of these drains is used for irrigation purposes. This study characterizes the effluent of major drains of Lahore city and assesses its suitability for irrigation. Wastewater samples were collected from drains in winter and spring seasons and analyzed for various parameters of special concern to irrigation. TSS, oil and grease, BOD, COD, chloride, TDS, sodium, SAR, bicarbonate ions, EC, iron, Copper and Nickel were found to be varied in concentration in different drains when compared with NEQS (National Environment Quality Standards) and FAO guidelines for irrigation in both seasons. Regular monitoring and proper treatment of wastewater before discharging into the drains can reduce the pollution in these drains.
Keywords: Industrialization; Wastewater Quality; Drains; Irrigation; Winter and Spring Season; FAO Guidelines
1. Introduction
Pakistan is the sixth most populous country of the world with current population of approximately 183.06 million according to latest survey of 2013. It is expected that population will reach 242.1 million by 2030 at the exist- ing growth rate [1]. Water and food demand will be di- rectly affected which, in turn, will increase the effluent discharges from domestic, industrial and agricultural sec- tors [2].
Being an agricultural country, the water demands of Pakistan are very high. Due to the water scarcity issues, the untreated effluents from the cities are being used for irrigation purposes in many parts of the country includ- ing Lahore [3]. Lack of adequate resources is resulting in the usage of wastewater for irrigation without any treat- ment. Consequently, urban and peri-urban farmers use marginal or untreated wastewater to cultivate a variety of crops. In Pakistan, the percentage of the wastewater, which is treated before use in irrigation is only 2 per cent [4].
The Lahore’s drainage system comprises 8 major and 75 tributary drains having carrying capacity of 7474 Cusecs. The length of total surface drains is 212 km, with 4 pumping stations and pumping capacity of 663 Cusecs.
The major drains of Lahore which include Shahdara drain, Mian Mir drain, Iqbal town drain, Garden town drain, Sattu Katla drain, Charar drain, Chota Ravi drain and Hudiara drain discharge their waste directly into River Ravi, within a reach of about 65 km [5].
Originally, the purpose of these drains was to collect the flood water and agricultural excess water. But due to increase in population and rapid industrialization of Lahore, the drains are now mainly used to collect the industrial and municipal effluents of diverse composition resulting in increasing pollution problems in the irriga- tion outlets [5].
271 industrial units in Lahore district, mainly consti- tuting of textile, dairy, paints & plastic, chemical, food processing, pulp and paper processing, poultry, pesticides, leather, tanneries and pharmaceuticals are disposing of around 281.6 cusec untreated waste into the irrigation canals and drains [6]. Moreover, 3136 cusecs effluent is added by municipalities making a total of 3418 cusecs .It has been reported that in Lahore, very few industries, like 3 out of some 100 industries, using hazardous chemicals, treat their wastewater effectively. The untreated effluent discharges have created multiple environmental and so- cial challenges for the city [5].
Afzal et al. [7] conducted a study to investigate the degree of pollution, in the Hudiara drain, caused by
disposal of untreated sewage and industrial waste of Pakistan and India. The results showed high values of biochemical oxygen demand (BOD), total organic carbon (TOC) chemical oxygen demand (COD), and trace me- tals in the samples taken from the Indo-Pak border. This study demonstrated that the major pollutants in the water of Hudiara drain were suspended solids (SS), fecal coli- form (FC) and chemical oxygen demand (COD).
The discharge of untreated industrial and municipal effluents into the irrigation system can pose a serious threat to the quality of soil & crops and to the health of human beings [6]. According to estimation, untreated effluents from the Lahore city are being used to irrigate approximately 800 to 1000 hectares area. Most trace ele- ments and other heavy metals mount up in soils even- tually contaminating or rendering soils non-productive [3].
The change in physicochemical properties of the soil is the chronic impact of the usage of wastewater for ir- rigation eventually increasing the amount of heavy me- tals in the soil. Long term use of wastewater of drains, can lead to accumulation of high amounts of trace ele- ments in soils and can enter the food chain through absorption via plants.
Cd can be easily absorbed and accumulated in plants and animals in very high quantities [8]. Sharma et al. [9] carried out study in three industrially different cities viz., Ludhiana, Jalandhar and Malerkotla to observe the level of Cd buildup in soils and plants being irrigated with untreated sewage water. Cd level was high at all sites in those plants which were receiving wastewater for ir- rigation as compared to those plants getting tubewell ir- rigation. Similarly, Beta vulgaris (palak) has been highly contaminated with Cd, Pb and Ni due to wastewater irrigation in suburban areas of Varanasi, India causing serious health risks for the human beings.
Sahu et al. [10] assessed the wastewater quality of loamy drain receiving effluent from tanneries and other industries and studied their impacts on soil and vege- tables irrigated with this water. The results showed that most of the parameters were not complying with the prescribed limits for safe disposal of effluents into the surface water. Samples of soil and vegetables from the land irrigated with drain water were also collected and analyzed for Cu, Zn, Ni, Cr, Pb and Cd. The different metals were in diverse concentrations, which may create chronic health hazards to human and cattle through food chain in the long run.
Other effects posed on groundwater quality, wild life & health impacts on farmers have also been assessed. For instance, J. H. J. Ensink et al., [11] carried out a cross sectional study in the city of Faisalabad, Pakistan, to assess the risk of Giardia duodenalis (Giardia) infection in farmers using untreated wastewater in agriculture. A
strong correlation was found between Giardia infections in those households who were using wastewater farming as compared to the ones using regular irrigation water. Cattle grazing on freshly irrigated grasslands with un- treated wastewater reportedly suffered from disease (cysticerosis) in Melbourne, Australia and Denmark [4].
Severe contamination in Ravi River has destroyed 42 species of fish. The bird life has also been acutely af- fected and has migrated to other areas [2]. An extensive and seasonal study was carried out by Akhtar and Nawaz on the effluent quality of six drains of Lahore and their impact on the aquatic life of River Ravi, into which these drains were discharging their effluents. The results when compared with USEPA guidelines for fish and aquatic life proved that River Ravi water quality was not by any means suitable for the propagation of fish during dry weather and canal closure period [12].
Due to the varied nature of industrial manufacturing processes, effluents vary widely in composition and often contain toxic materials to cause serious problems towards human health, plants, crops, animals and aquatic life. The present study was conducted to characterize the physical and chemical characteristics of effluents of the major drains of Lahore city in order to determine the pollutants being discharged into the drains which ultimately found their way into the receiving water bodies, mainly rivers, and to evaluate that whether the surface water quality was suitable for the purpose of irrigation or not, for which it was being extensively utilized [13].
2. Materials and Methods
2.1. Selection of the Study Area
Eight major drains of Lahore city were selected for the present study and the samples were collected from each site namely Shahdara drain, Mian Mir drain, Iqbal town drain, Garden town drain, Sattu Katla drain ,Charar drain, Hudiara drain, Chota Ravi drain [12]. Figure 1 shows the
locations of study area.
2.2. Sampling Procedure
Figure 1. Sampling points of major Drains of Lahore city (View of the Terrain).
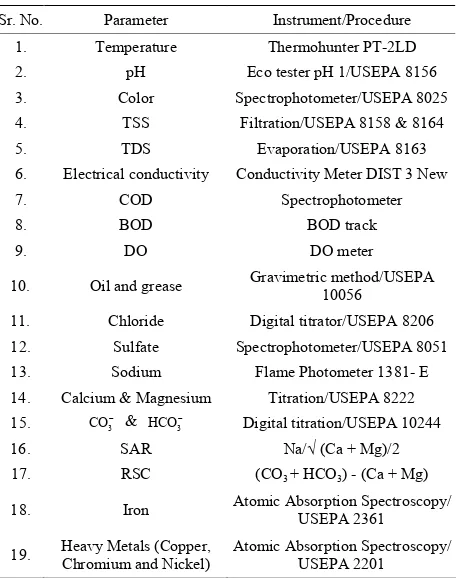
Table 1. Instruments/Procedures used for the analysis of effluents of the drains.
2. After collection, all the samples were transferred care- fully to laboratory for further analysis. A total of 16
samples were collected in two months from these drains. Sr. No. Parameter Instrument/Procedure
1. Temperature Thermohunter PT-2LD
2. pH Eco tester pH 1/USEPA 8156
3. Color Spectrophotometer/USEPA 8025
4. TSS Filtration/USEPA 8158 & 8164
5. TDS Evaporation/USEPA 8163
6. Electrical conductivity Conductivity Meter DIST 3 New
7. COD Spectrophotometer
8. BOD BOD track
9. DO DO meter
10. Oil and grease Gravimetric method/USEPA 10056
11. Chloride Digital titrator/USEPA 8206 12. Sulfate Spectrophotometer/USEPA 8051 13. Sodium Flame Photometer 1381- E 14. Calcium & Magnesium Titration/USEPA 8222
15. CO3
&
3
HCO Digital titration/USEPA 10244
16. SAR Na/√ (Ca + Mg)/2
17. RSC (CO3 + HCO3) - (Ca + Mg)
18. Iron Atomic Absorption Spectroscopy/ USEPA 2361
19. Heavy Metals (Copper, Chromium and Nickel) Atomic Absorption Spectroscopy/ USEPA 2201 2.3. Selection of Parameters
Each sample of the wastewater was tested for various Physio-Chemical parameters as shown in Table 1. Some
of these parameters like pH, Sodium, EC, SAR, RSC, Bicarbonate, Chloride, TDS, Fe, Cu, Ni and Cr were analyzed to test the water quality of these drains for the purpose of irrigation. The results were compared with National Environmental Quality Standards (NEQS) and FAO guidelines for irrigation to establish a baseline con- dition of pollution level in the drains. Table 1 shows the
instruments & procedures used for the analysis of physio- chemical parameters and heavy metals in the waste-wa- ter.
3. Results and Discussion
The focus of the present study was to quantitatively characterize the pollution load in the major drains of the Lahore city in the month of January and March and to assess the suitability of drain water for irrigation as it is being frequently used in irrigation.
January and March from the major drains of Lahore city were analyzed for parameters including pH, Temperature, TDS, TSS, Colour, COD, BOD, DO, Oil and Grease, EC, Cl, 2 , Na, Ca, Mg,
4
SO CO2,
3, RSC and SAR, Fe, Cu, Cr and Ni . The results of the analysis of these physical and chemical parameters are shown in Tables 2-7.
HCO
The pH measurement of the wastewater samples of the drains showed that the water of Shahdara drain, Iqbal
[image:4.595.59.538.232.493.2]town drain and Sattu katla drain was acidic in the winter season while in the spring season, the water of all the drains was alkaline which could be the reason of more flow of water and increase in domestic effluents. The causes of acidity and alkalinity may be runoff, sewage, geology and high nutrient levels. However, these results show that value of pH was within the acceptable range according to National Environmental Quality Standards and FAO guidelines for irrigation. Temperature is a very
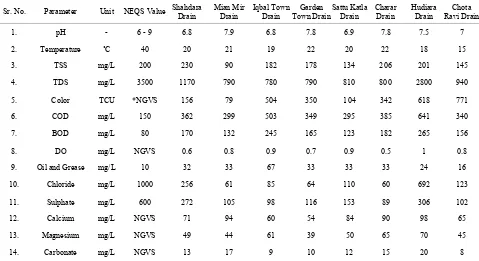
Table 2. Results of Physio-chemical parameters of wastewater of the drains in winters (January) and its comparison with NEQS.
Sr. No. Parameter Unit NEQS Value Shahdara Drain Mian Mir Drain Iqbal Town Drain Town DrainGarden Sattu Katla Drain Charar Drain Hudiara Drain Ravi DrainChota
1. pH - 6 - 9 6.8 7.9 6.8 7.8 6.9 7.8 7.5 7
2. Temperature ˚C 40 20 21 19 22 20 22 18 15
3. TSS mg/L 200 230 90 182 178 134 206 201 145
4. TDS mg/L 3500 1170 790 780 790 810 800 2800 940
5. Color TCU *NGVS 156 79 504 350 104 342 618 771
6. COD mg/L 150 362 299 503 349 295 385 641 340
7. BOD mg/L 80 170 132 245 165 123 182 265 156
8. DO mg/L NGVS 0.6 0.8 0.9 0.7 0.9 0.5 1 0.8
9. Oil and Grease mg/L 10 32 33 67 33 33 33 24 16
10. Chloride mg/L 1000 256 61 85 64 110 60 692 123
11. Sulphate mg/L 600 272 105 98 116 153 89 306 102
12. Calcium mg/L NGVS 71 94 60 54 84 90 98 65
13. Magnesium mg/L NGVS 49 44 61 39 50 65 70 45
14. Carbonate mg/L NGVS 13 17 9 10 12 15 20 8
Table 3. Results of analysis of Physio-chemical parameters of the wastewater of the Drains in winters (January) and its com- parison with FAO guidelines for irrigation.
*FAO Guidelines for irrigation
Degree of restriction on use Sr. No. Parameter Unit
None Slight to
moderate Severe
Shahdara Drain
Mian Mir Drain
Iqbal Town Drain
Garden Town Drain
SattuKatla Drain
Charar Drain
Hudiara Drain
Chota Ravi Drain
1. pH - Normal range 6.5 - 8 6.8 7.9 6.8 7.8 6.9 7.8 7.5 7
2. TDS mg/L <450 450 - 2000 > 2000 1170 790 780 790 810 800 2800 940
3. Conductivity Electrical dS/m <0.7 0.7 - 3.0 > 3.0 5.6 5.0 3.9 4.6 4.4 5.9 6.5 5.6
4. Sodium me/L <3 3 – 9 > 9 46.74 40.57 47.39 41.30 46.57 38.70 56.09 43.04
5. Chloride me/L <4 4 – 10 > 10 7.21 1.72 2.39 1.80 3.10 1.69 19.49 3.46
6. Bicarbonate me/L <1.5 1.5 - 8.5 > 8.5 20.20 19.28 20.98 16.89 18.56 17.70 21.15 18.38
7. SAR - >0.7 0.7 - 0.2 < 0.2 33.8 22.5 28.4 28.2 26.4 19.7 27.5 32.5
[image:4.595.56.540.533.731.2]Table 4. Results of analysis of heavy metals in the wastewater of the drains in winters (January) and its comparison with NEQS and FAO guidelines for irrigation.
Sr. No. Parameter Unit NEQS value
**FAO guidelines for
irrigation
Shahdara Drain
Mian Mir Drain
Iqbal Town Drain
Garden Town Drain
Sattu Katla Drain
Charar Drain
Hudiara Drain
Chota Ravi Drain
1. Iron mg/L 8.0 5.0 5.3 1.3 3.3 2.0 5.5 1.7 1.9 2.1
2. Copper mg/L 1.0 0.20 0.74 0.08 0.50 0.009 3.75 0.07 0.40 0.03
3. Nickel mg/L 1.0 0.20 0.40 0.12 0.11 0.13 2.65 0.23 0.14 0.23
4. Chromium mg/L 1.0 0.10 *ND ND ND ND 1.37 ND ND ND
[image:5.595.58.540.282.525.2]NGVS = No guideline value suggested; ND = Not detected; NEQS Values: (Pakistan, Environmental Protection Agency EPA, 1997); **FAO Guidelines for irrigation: (Pescod, 1992) *Guidelines for Interpretation of Water Quality for Irrigation; **Threshold Levels Of Trace Elements for Crop Production (phytotoxic threshold levels of some selected trace elements in municipal wastewater).
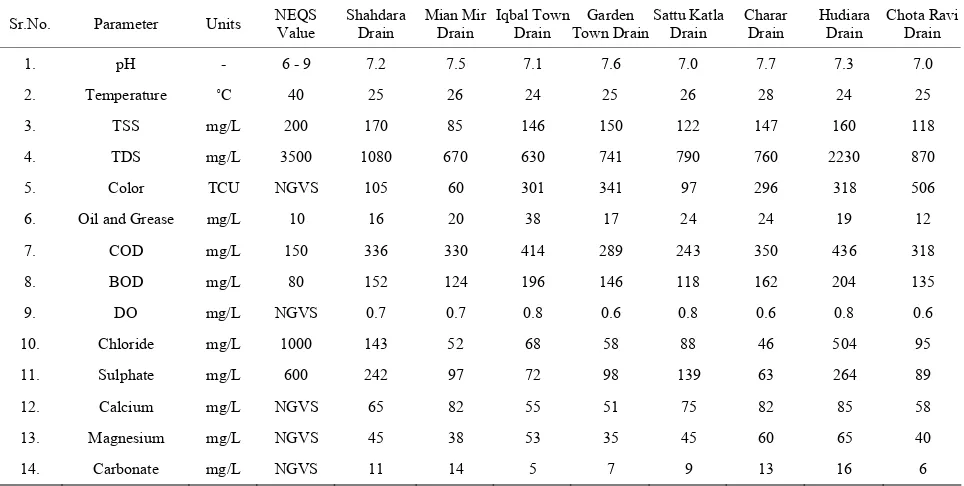
Table 5. Results of analysis of Physio-chemical parameters of wastewater of the drains in spring (March) and its comparison with NEQS.
Sr.No. Parameter Units NEQS Value Shahdara Drain Mian Mir Drain Iqbal Town Drain Town DrainGarden Sattu Katla Drain Charar Drain Hudiara Drain Chota Ravi Drain
1. pH - 6 - 9 7.2 7.5 7.1 7.6 7.0 7.7 7.3 7.0
2. Temperature ˚C 40 25 26 24 25 26 28 24 25
3. TSS mg/L 200 170 85 146 150 122 147 160 118
4. TDS mg/L 3500 1080 670 630 741 790 760 2230 870
5. Color TCU NGVS 105 60 301 341 97 296 318 506
6. Oil and Grease mg/L 10 16 20 38 17 24 24 19 12
7. COD mg/L 150 336 330 414 289 243 350 436 318
8. BOD mg/L 80 152 124 196 146 118 162 204 135
9. DO mg/L NGVS 0.7 0.7 0.8 0.6 0.8 0.6 0.8 0.6
10. Chloride mg/L 1000 143 52 68 58 88 46 504 95
11. Sulphate mg/L 600 242 97 72 98 139 63 264 89
12. Calcium mg/L NGVS 65 82 55 51 75 82 85 58
13. Magnesium mg/L NGVS 45 38 53 35 45 60 65 40
14. Carbonate mg/L NGVS 11 14 5 7 9 13 16 6
Table 6. Results of analysis of Physio-chemical parameters of the wastewater of the Drains in spring (March) and its com- parison with FAO guidelines for irrigation.
FAO Guidelines for irrigation Degree of restriction on use Sr. No. Parameter Unit
None Slight to moderate Severe
Shahdara Drain
Mian Mir Drain
Iqbal Town Drain
Garden Town Drain
Sattu Katla Drain
Charar Drain
Hudiara Drain
Chota Ravi Drain
1. pH - Normal range 6.5-8 7.2 7.5 7.1 7.6 7.0 7.7 7.3 7.0
2. TDS mg/L <450 450 - 2000 >2000 1080 670 630 741 790 760 2230 870
3. conductivity Electrical dS/m <0.7 0.7 - 3.0 >3.0 5.2 4.9 4.5 4.3 4.2 5.3 6.1 5.0
4. Sodium me/L <3 3 - 9 >9 43.3 40 44.34 39.5 42.6 35.2 50 36.5 5. Chloride me/L <4 4 - 10 >10 4 1.46 3 1.63 2.5 1.3 14.2 2.7 6. Bicarbonate me/L <1.5 1.5 - 8.5 >8.5 20 19.6 20.2 16.1 17.9 16.7 20.3 17.8 7. SAR - >0.7 0.7 - 0.2 <0.2 26.5 29.8 33.3 27.4 31.3 23.4 32.0 29.5
[image:5.595.57.540.563.733.2]Table 7. Results of analysis of heavy metals in the wastewater of the drains in spring (March) and its comparison with NEQS and FAO guidelines for irrigation.
Sr. No. Parameter Unit NEQS value FAO guidelines for irrigation Shahdara Drain Mian
Mir Drain
Iqbal Town Drain
Garden Town Drain
Sattu Katla Drain
Charar Drain
Hudiara Drain
Chota Ravi Drain
1. Iron mg/L 8.0 5.0 5.0 1.2 3.0 1.9 5.3 1.5 1.6 2.0
2. Copper mg/L 1.0 0.20 0.72 0.04 0.47 0.008 3.79 0.04 0.39 0.01
3. Nickel mg/L 1.0 0.20 0.39 0.11 0.10 0.12 2.62 0.21 0.13 0.21
4. Chromium mg/L 1.0 0.10 *ND ND ND ND 1.35 ND ND ND
NGVS = No guideline value suggested; ND = Not detected; NEQS Values: (Environmental Protection Agency EPA, 1997); FAO Guidelines for irrigation: (Pescod, 1992) *Guidelines for Interpretation Of Water Quality For Irrigation; **Threshold Levels Of Trace Elements for Crop Production (phytotoxic threshold levels of some selected trace elements in municipal wastewater).
important parameter of the wastewater to be measured. At high temperatures, the water loses its dissolved oxy- gen. The value of temperature was within the recom- mended limit for no risk according to NEQS. FAO guidelines have no suggested value for temperature [14].
[image:6.595.308.533.251.348.2] [image:6.595.331.509.389.507.2]The analysis of effluents showed high concentration of oil and grease in these drains in both seasons i.e. winter and spring. The values were violating the acceptable range in all the drains as specified by NEQS as shown in
Figure 2. The sources of oil and grease in wastewater
can be traced to domestic, commercial and industrial wastewater. The most common industries releasing oil and grease are textile industries, laundries and industries of wool scouring [15]. Large amounts of oil and grease into the water bodies increase the BOD while also caus- ing foul odors by trapping plants and garbage and sub- sequently flies and mosquitoes are attracted to this type of water causing diseases. Oil will form a layer on the surface of water and may inhibit sunlight through it and a decrease in the dissolved oxygen. This will eventually affect the receiving water bodies and aquatic life within it [10]. FAO guidelines for irrigation doe not specify a standard value for oil and grease.
Figure 2. Oil and Grease in the wastewater samples in the winter and spring seasons.
0 100 200 300 400 500 600 700
Sh
ah
da
ra
…
Iq
ba
l T
ow
n …
Sa
ttu K
atl
a …
H
ud
iar
a …
CO
D m
g
/L
[image:6.595.321.521.555.660.2]Major drains of Lahore City COD of the wastewater samples in January COD of the wastewater samples in March
Figure 3. COD of wastewater samples in the winter and spring seasons.
COD values are always higher than BOD values and maybe much higher when significant amounts of bio- logical resistant organic matter are present. The highest COD levels in the month of January and March found in Hudiara drain were 641 mg/L and 436 mg/L whereas the lowest COD values in the month of January and March were 295 mg/L and 243 mg/L respectively as shown in
Figure 3.
0 50 100 150 200 250 300
Sha
hda
ra
…
Iq
ba
l
…
Sa
ttu
Ka
tla
…
Hu
di
ar
a
…
BO
D
m
g
/L
Major drains of Lahore city
BOD of wastewater samples in January
BOD of the wastewater samples in March
NEQS Value
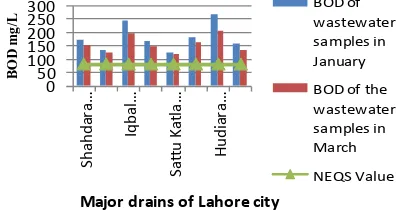
The highest BOD value noted in the month of January and March were 265 mg/L and 204 mg/L as recorded at
Hudiara Drain whereas the lowest BOD values were found in Sattu katla drain for both the months and the values were 123 mg/L and 118 mg/L respectively as shown in Figure 4. These Figures show that Hudiara
drain has the highest BOD value and Sattu katla drain has lowest BOD value. When compared with NEQS (80 mg/L) all the BOD values were found above the limits.
Figure 4. BOD of wastewater samples in the winter and spring seasons.
wastewater coming from sewage treatment plants mostly has organic materials that are decomposed by microor- ganisms, and uses oxygen to carry out their activities [10].
The concentration of Sulphate was in the range of 89 - 306 mg/L in January and in March it ranges from 63 to 246 mg/L which is within the NEQs. FAO guidelines for irrigation have no standard value for sulphate. Calcium is a major constituent of the surface water. The concentra- tion of Ca in the wastewater of Hudiara, Charar and Mian Mir drain was high in both winter and spring season as compared to others. The concentration of magnesium was also high in Iqbal town drain, Hudiara and Charar drain in winter and spring season. There is no guideline value for calcium and magnesium in NEQS and FAO standards.
TDS refer to the total concentration of dissolved sub- stances in the water. TDS is important parameter among agricultural water quality parameters. TDS plays impor- tant role in the plant growth, crop yield and quality of product [16]. The amount of TDS was again high in Hudiara drain as compared to others. Though TDS in the effluents was acceptable according to NEQS, but ac- cording to FAO guidelines for irrigation the water of the Hudiara drain is not suitable for irrigation purposes. The degree of restriction on the use of wastewater of the Hudiara drain is severe (>2000 mg/L), while for the rest of the drains it is from slight to moderate.
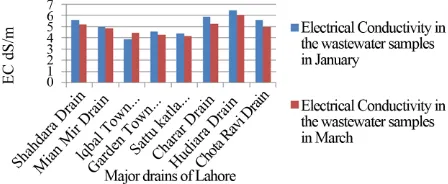
Water having more salt contents carries more electrical current. The electrical conductivity increases approx. 2 percent with every ˚C increase in temperature. It gives an indication of the amount of inorganic materials in the water including calcium, nitrogen, bicarbonate and others [16]. There is no standard value given for EC in NEQS. The results of the analysis of the wastewater showed that the degree of restriction on the use of wastewater is se- vere because all the drains have high EC than the stan- dard value of FAO as shown in Figure 5.
[image:7.595.59.283.615.707.2]It is important to measure chloride so that quality of the wastewater can be assessed for use in irrigation. The major source of chloride in the irrigation outlet can be treated effluents and the municipal sewage [7]. Chloride was present in the range of 60 - 692 mg/L in the samples
Figure 5. Electrical conductivity in the wastewater samples in winter and spring seasons.
of wastewater in the month of January while in the month of March it was in the range of 46 - 504 mg/L. When compared to NEQS, the value of chloride was within the acceptable range. But FAO guidelines for ir- rigation suggest that chloride concentration was above recommended limit for hudiara drain and the degree of restriction on the use of their wastewater is severe (>10 me/L). So it can be said that the water of Hudiara drain is unsuitable for irrigation purposes because it may have a harmful affect on the vegetables and crops grown by utilizing this water [17,18].
The comparison of the results of sodium in the waste- water of the drains with FAO guidelines for irrigation showed that the amount of sodium was very high in all the drains. The degree of restriction on the use of the water of these drains is severe because their concentra- tion is very high (>9.0 me/L). High amount of sodium in the irrigation water causes toxicity problems like im- paired growth, reduction in the yield of crops, change in the morphology of the plants and even its death [19].
The analysis of the bicarbonate ions in the wastewater of all the drains showed that the amount of these ions was very high in all the drains as compared to FAO guidelines for irrigation. The degree of restriction on the use of wastewater of these drains is severe because its value is very high and hence this water is not apposite for the purpose of irrigation.
Sodium adsorption ratio (SAR) is an indication of the probable pressure on the soil properties caused by so- dium. SAR states the concentration of sodium in water relative to calcium and magnesium. When the amount of sodium in the irrigation water exceeds than allowable limit, it disperses the soil resulting in low penetration rate of air and water into the soil. It is difficult to harvest on the dispersed soil. Soils can have excess sodium because of the wastewater irrigation that is why it is important to measure SAR [19]. The results for SAR showed that the water of these drains was not suitable for irrigation as the value of SAR was very high in both winter and spring seasons. The degree of restriction on the use of wastewa- ter of these drains is severe.
Assessment of sodium permeability hazard is referred to as Residual sodium carbonate (RSC). It is measured by taking the bicarbonate/carbonate and calcium/magne- sium concentrations in irrigation water into account. RSC is important parameter for irrigation because in it the relative concentrations of bicarbonate and carbonate are compared with the concentrations of calcium, magne- sium, and sodium [19]. The results showed that the nega- tive value of RSC when compared to the FAO guideline for irrigation (1.25 me/L) is fit for irrigation.
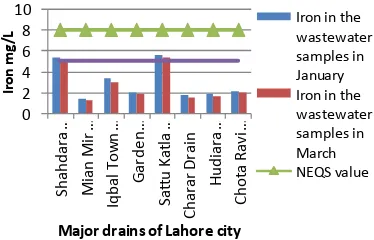
toxicity in Indus basin aquifers [17]. The results of the chemical analysis showed that the amount of iron was within the acceptable range as compared to NEQS. Ac- cording to FAO guidelines for irrigation Shahdara and Sattu Katla drain is not suitable for irrigation due to high Iron content (>5 mg/L) as shown in Figure 6.
Industrial activities, atmospheric deposition and live- stock manure are the reasons of contamination of soil with Cu. Figure 7 shows the results of the analysis of Cu
in the wastewater. The amount of Cu in all the drains falls within the acceptable range suggested by NEQS except in Sattu Katla drain which was very high than the standard value. Comparison of the Cu values with FAO guideline for irrigation showed that the water of Shahdara, Hudiara, Iqbal town and Sattu Katla drain is not fit for cultivation of crops.
Nickel is mostly present in those areas where domestic waste is combined with industrial wastewater [20]. Nickel is readily present in those agricultural lands where domestic wastewater is used for irrigation. High amount of Ni is toxic for the growth of plant. The results of the analysis of the wastewater of the drains of Lahore show- ed that the amount of Ni in all the drains was within the acceptable range of NEQS as given in Figure 8. But
comparison of these values with FAO guideline for irri- gation depicted that the quality of the water of Shahdara, Sattu Katla, Charar and Chota Ravi drain is not suitable for the irrigation of the crops.
The most dominant sources of Cr are phosphate fertil-
0 2 4 6 8 10 Sh ah d ar a … Mi an Mi r … Iqba l To wn … Gar d e n … Sa tt u Ka tl a … C h ar ar Dr ai n Hu d ia ra … Ch o ta Ra vi … Ir o n mg /L
Major drains of Lahore city
[image:8.595.327.517.87.215.2]Iron in the wastewater samples in January Iron in the wastewater samples in March NEQS value
Figure 6. Iron in the wastewater samples in winter and spring seasons. 0 1 2 3 4 Sh a h d a r … Mi a n … Iq b a l … Ga rd e n … S a ttu … Cha ra r … Hu d ia ra … Cho ta … Co p p e r mg /L
Major drains of Lahore city
Copper in the
wastewater
samples in
January
Copper in the
wastewater
samples in
[image:8.595.82.269.451.571.2]March
Figure 7. Copper in the wastewater samples in winter and spring seasons 0 0.5 1 1.5 2 2.5 3 Sh ah d ar a … Iq b al … Sa ttu … Hu d ia ra … Nick e l mg /L
Major drains of Lahore city
Nickel in the wastewater samples in January
Nickel in the wastewater samples in March
Figure 8. Nickel in the wastewater samples in winter.
izers and metallurgic industries which cause atmospheric deposition. It is also released by tanning, ink manufac- ture, metal plating, dyes, wood preserving, textile and ceramic industries [20]. The results of the analysis of the wastewater showed that Cr was not detected into any drain except Sattu Katla drain, in concentration that ex- ceeds both NEQs and FAO standards.
4. Conclusion
The major drains of Lahore city were originally storm water drains. But due to increase in population and rapid industrialization in the city of Lahore, the drains are now mainly used to collect the industrial and municipal ef- fluents of diverse nature. The characterization of the wastewater of these drains showed that many parameters were higher than the prescribed limit as compared to NEQS and FAO guidelines for irrigation. These results provide strong evidence that the water of these drains is not suitable for irrigation and other domestic purposes. Therefore, there is an urgent need to take essential steps to treat industrial wastewater before discharging into these drains so that pollution load can be minimised and the water can be used for beneficial purposes.
5. Recommendations
The findings of the study make it necessary for the gov- ernment and other related authorities of wastewater man- agement to take following actions:
The wastewater of these drains needs to be monitored on a regular basis.
The industrial and municipal effluents should be treated before discharging into the drains and the drain discharge should also be treated before use for irrigation. The implementation and follow-up of the environmental laws should be made compulsory by all the industries.
A detailed study should be conducted to determine heavy metals in the vegetables and soil irrigated by the water of these drains.
[image:8.595.69.269.613.705.2]drinking and bathing. It can contaminate their meat and milk through accumulation of heavy metals and harmful chemicals.
The pumping of groundwater near these drains must be shunned to lessen the hazard of waterborne dis- eases.
All of the drains should be covered in order to reduce the visual impacts on the society, and drains should be lined with concrete so that the risk of seepage of toxic chemicals and heavy metals into the groundwa- ter could be evaded.
REFERENCES
[1] GOP, “Population Census Organization, Government of Pakistan,” 2012. http://www.census.gov.pk/
[2] Economic Adviser’s Wing, Finance Division, Government of Pakistan. “Highlights: Pakistan Economic Survey 2010- 2011,” 2011, pp. 1-11.
[3] E. Naeem, “An Investigation of the Characteristics of Ef- fluent Mixing in Stream,” University of Engineering and Technology, Taxila, 2009.
[4] D. Pay, A. S. Christopher, S. L. Raschid, R. Mark and B. Akiça, “Wastewater Irrigation and Health; Assessing and Mitigating Risk in Low-Income Countries,” In: Non- Pathogenic Trade-Offs of Wastewater Irrigation, Earths-
can, London, 2010, pp. 101-126.
[5] WASA, “Presentation on the Initiative Taken in WASA Lahore Regarding Benchmarking of UWSS,” Water and Sanitation Agency, Lahore, 2007.
[6] IPD, “An Atlas: Surface Water Industrial and Municipal Pollution in Punjab,” Irrigation and Power Department, Directorate of Land Reclamation Punjab, 2008, pp. 1-132. [7] S. Afzal, I. Ahmad, M. Younas, M. D. Zahid, K. M. H. Atique, A. Ijaz and K. Ali, “Study of Water Quality of Hudiara Drain, India-Pakistan,” Environment Internatio- nal, Vol. 26, No. 1-2, 2000, pp. 87-96.
doi:10.1016/S0160-4120(00)00086-6
[8] A. M. Kizer and H. Zhang, “Understanding Your Irriga- tion Water Test Report,” Oklahoma State University, Ok- lahoma, 2001.
[9] K. R. Sharma, M. Agrawal and F. Marshall, “Heavy Me- tal Contamination of Soil and Vegetables in Suburban Areas of Varanasi, India,” Ecotoxicology and Environ- mental Safety, Vol. 66 No. 2, 2007, pp. 258-266.
doi:10.1016/j.ecoenv.2005.11.007
[10] K. R. Sahu, S. Katiyar, J. Tiwari and C. G. Kisku, “As- sessment of Drain Water Receiving Effluent from Tan- neries and Its Impact on Soil and Plants with Particular Emphasis on Bioaccumulation of Heavy Metals,” Journal of Environmental Biology, Vol. 28 No. 3, 2007, pp. 685-
690.
[11] J. H. J. Ensink, W. van der Hoek and W. Simmons Robert, “Livelihoods from Wastewater: Water Reuse in Faisala- bad, Pakistan,” IWA Publishing, London, 2008, pp. 387- 400.
[12] S. Akhtar and N. Mohammad, “Impact of Water Quality on Aquatic Life in River Ravi, Pakistan,” Journal of Na- ture Environment and Pollution Technology, Vol. 11, No.
2, 2012, pp. 219-224.
[13] M. Tariq, M. Ali, and Z. Shah, “Characteristics of Indus- trial Effluents and Their Possible Impacts on Quality of Underground Water,” Soil & Environment, Vol. 25, No. 1, 2006, pp. 64-69.
[14] E. M. Ali, “Impact of Drain Water on Water Quality and Eutrophication Status of Lake Burullus, Egypt, a South- ern Mediterranean Lagoon,” African Journal of Aquatic Science, Vol. 36, No. 3, 2011, pp. 267-277.
doi:10.2989/16085914.2011.636897
[15] WWF, “Pakistan’s Waters at Risk: Water & Health Re- lated Issues in Pakistan & Key Recommendations: A Spe- cial Report,” WWF, Lahore, 2007, pp. 1-25.
[16] SFWF, “TDS and pH,” Organization of Safe Drinking Water, Canada, 2002, pp. 1-6.
[17] M. Ibrahim and S. Salamon, “Chemical Composition of Faisalabad City Sewage Effluent: II Irrigation Quality,”
Journal of Agriculture Research, Vol. 30, No. 1, 1992, pp.
391-340.
[18] A. M. Kahlown, M. Ashraf, M. Hussain, A. H. Salam and Z. A. Bhatti, “Impact Assessment of Sewerage and Indus- trial Effluents on Water Resources, Soil, Crops and Hu- man Health in Faisalabad,” Pakistan Council of Research in Water Resources, Lahore, 2006, pp. 1-105.
[19] M. B. Pescod, “Wastewater Treatment and Use in Agri- culture-FAO Irrigation and Drainage Paper,” Wastewater Characteristics and Effluent Quality Parameters, Food
and Agriculture Organization of the United Nations, Ro- me, 1992.