N A N O R E V I E W
Open Access
Anomalous heat transfer modes of nanofluids:
a review based on statistical analysis
Antonis Sergis
*and Yannis Hardalupas
Abstract
This paper contains the results of a concise statistical review analysis of a large amount of publications regarding the anomalous heat transfer modes of nanofluids. The application of nanofluids as coolants is a novel practise with no established physical foundations explaining the observed anomalous heat transfer. As a consequence,
traditional methods of performing a literature review may not be adequate in presenting objectively the results representing the bulk of the available literature. The current literature review analysis aims to resolve the problems faced by researchers in the past by employing an unbiased statistical analysis to present and reveal the current trends and general belief of the scientific community regarding the anomalous heat transfer modes of nanofluids. The thermal performance analysis indicated that statistically there exists a variable enhancement for conduction, convection/mixed heat transfer, pool boiling heat transfer and critical heat flux modes. The most popular proposed mechanisms in the literature to explain heat transfer in nanofluids are revealed, as well as possible trends between nanofluid properties and thermal performance. The review also suggests future experimentation to provide more conclusive answers to the control mechanisms and influential parameters of heat transfer in nanofluids.
Introduction
Nanofluids are fluids that contain small volumetric quantities (around 0.0001-10%) of nanosized suspen-sions of solid particles (100 nm and smaller in size). This kind of fluids exhibit anomalous heat transfer characteristics and their use as advanced coolants along with the benefits over their conventional counterparts (pure fluids or micron-sized suspensions/slurries) is investigated.
Nanofluids were invented by U.S. Choi of the Argonne National Laboratory (ANL) in 1993, during an investiga-tion around new coolants and cooling technologies, as part of the “Advanced Fluids Program” project taking place At (ANL). The term “Nanofluids” was subse-quently coined to this kind of colloidal suspensions by Choi in 1995 [1].
Since then, thriving research was undertaken to dis-cover and understand the mechanisms of heat transfer in nanofluids. The knowledge of the physical mechan-isms of heat transfer in nanofluids is of vital importance as it will enable the exploitation of their full heat trans-fer potential.
Several literature review papers were issued by researchers in the last years [2-6]. However, it is the current authors’belief that previous reviewers failed to present all the observations and results obtained from the literature in a clear and understanding method. The main problems arise from the fact that the application of nanofluids as coolants is a novel practise with no established physical foundations explaining the observed anomalous heat transfer characteristics. In addition, due to the recent growth of this area, there are no proce-dures to follow during testing for the evaluation of the thermal performance. As a consequence, traditional methods of performing a literature review may be inade-quate in presenting an unbiased, objective and clear representation of the bulk of the available literature.
It was hence decided to perform a statistical analysis of the findings of the available publications in the litera-ture in order to alleviate the problems faced by previous reviewers. The statistical analysis would enable the depiction of observations on comprehensive charts (his-tograms and scatter diagrams) hence making possible the extraction of conclusions in a more solid and math-ematically trustworthy manner. The present literature review gives the same amount of weight to all of the observations available in the literature.
* Correspondence: [email protected]
The Department of Mechanical Engineering, Imperial College London, London SW7 2AZ, UK
Sergis and HardalupasNanoscale Research Letters2011,6:391 http://www.nanoscalereslett.com/content/6/1/391
This review addresses the following questions:
a. What are the general heat transfer characteristics of nanofluids?
b. What are the trends linking the heat transfer per-formance of certain nanofluids with their by-part mixture parameters?
c. What are the most prevailing theories explaining the anomalous heat transfer behaviour observed in nanofluids?
The next section of this article describes the nanofluid characteristics followed by “Methodology of statistical analysis section”. The next two sections present the results of the analysis obtained.“Nanoemulsions”section of this review contains brief information regarding a dif-ferent type of fluids that has started emerging in the lit-erature recently and might in the future be incorporated into the broader category of nanofluids. The final sec-tion contains the main conclusions reached by the cur-rent review.
Characteristics of nanofluids
This section epitomizes the most common nanofluid preparation methods by providing information about the last stages of the fluid creation. Note that the“Quality” of a nanofluid represents the extent of achievability of the desired properties of the mixture.
The desired properties of a nanofluid are:
a. Even, durable and stable suspension of the solid nanoparticles in the host fluid (Basefluid)
b. Low or no formation of agglomerates
c. No chemical change of the basefluid (i.e. the solid particles must not chemically react with the host fluid).
Nanofluids follow either single or multi-step creation methods. The single-step creation approach refers to a direct evaporation method (Vacuum Evaporation onto a Running Oil Substrate-VEROS). This method attains the best quality nanofluids; however, there are substantial limitations on the flexibility to create customised nano-particle volumetric concentrations and basefluid type samples.
The multi-step method provides more flexibility, but, in general, with a penalty in the quality of the attained mixture. Nanofluids can be created either by diluting a very dense solution of the required nanofluid with the matching basefluid or by mixing directly the nanoparti-cles of choice with the desired basefluid. The first proce-dure provides more flexibility than the single-step method as the nanoparticles’volumetric concentration can be made to order; however, the quality of the
resulting nanofluid is lower than the one achieved via the single-step method.
The second approach of the multi-step method is the most widely used amongst researchers, since it provides maximum flexibility to control the volumetric concen-tration of the nanoparticles, along with the Basefluid type to be customised given the nanoparticle material, shape and size. On the other hand, this procedure deliv-ered the lowest quality of nanofluids in comparison to all the other methods [1].
The most common liquids used as basefluid are con-ventional coolants, such as deionised water, engine oil, acetone, ethylene glycol. The most common nanoparti-cle materials used are aluminium (Al), aluminium oxide (Al2O3), copper (Cu), copper oxide (CuO), gold (Au), silver (Ag), silica dioxide (SiO2), titanium dioxide (TiO2) and carbon nanotubes (CNTs either single-walled, dou-ble-walled or multi-walled).
Methodology of statistical analysis
In order to tackle the topics mentioned in“ Introduc-tion” section of this paper, the present researchers resolute to following a statistical investigation of a large sample of findings collected from the available literature. The analysis was performed in three levels. The first level consists of the bulk of the findings from all the published work and enables the demonstration of a gen-eral view of the thermal performance of nanofluids. The second level focuses on the most commonly studied nanofluid types and compositions and makes possible to extract trends linking the various nanofluid properties with their thermal performance. The third and final level narrows the sample to include a selection of find-ings from simple geometry experiments (consisting of travelling hot wire and pipe flow type, instead of com-plex geometries), ignoring theoretical investigations, thus providing an insight into what appear to be the controlling parameters of thermal performance of nano-fluids. Additionally, the final level of analysis reveals what is currently missing from the literature and indi-cates what aspects need to be investigated further to reach a more conclusive result regarding the links between thermal performance and nanofluid properties.
Findings were gathered regarding the observed enhancement for several heat transfer modes (conduc-tion, convec(conduc-tion, pool boiling and critical heat flux) compared to the heat transfer performance of the base-fluid alone. Additional information was recorded linking the observed enhancement to the material of the basefluid and nanoparticles, nanofluid composition (nanoparticle concentration), nanoparticle size, tempera-ture of nanofluid, viscosity (enhancement), type of experimental set up, flow status (i.e. laminar or turbu-lent), possible gravitational effects (e.g. for convective Sergis and HardalupasNanoscale Research Letters2011,6:391
http://www.nanoscalereslett.com/content/6/1/391
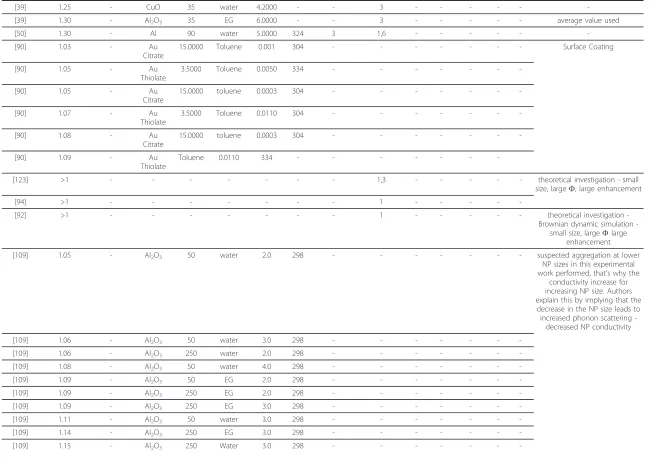
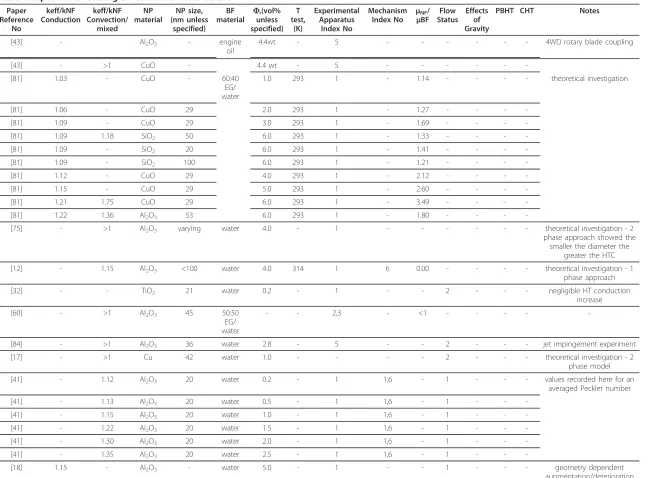
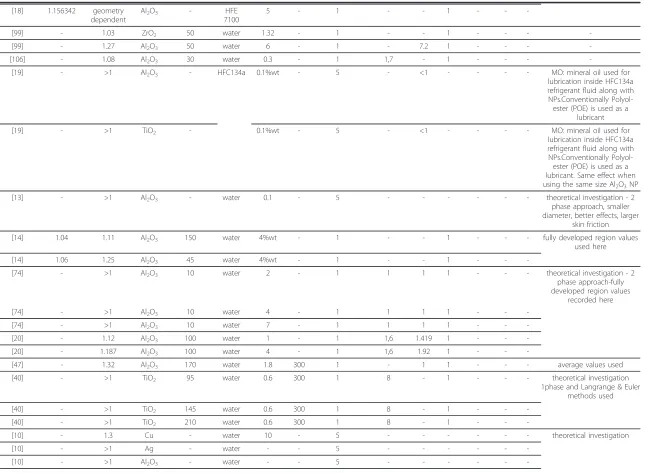
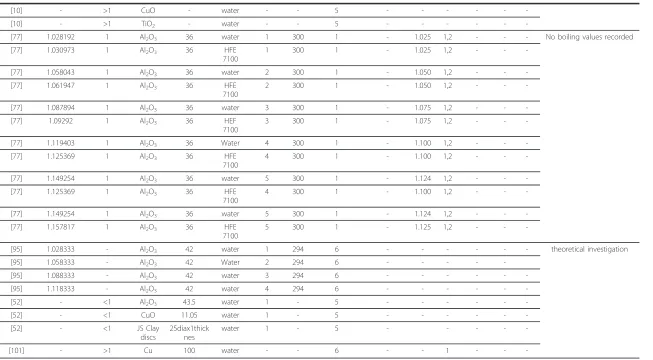
heat transfer), as well as any other interesting observation (see database tables). Finally, the proposed mechanisms for the observed heat transfer anomalies were identified (the assembled database, which was used for the presented review can be found in Tables 1, 2, 3, 4, 5, 6, 7 and 8).
The methodology for the capturing of the findings (numerical and theoretical) from each publication and ensure repeatability of data collection and analysis is as follows:
a. It was decided to limit the data gathering for volu-metric concentrations of nanoparticles (F) up to 10% (focus group).
b. Information was presented on diagrams only when adequate number of cases was available in order to be able to approximately describe the shape of the resulting graph.
c. In cases where Dynamic Light Scattering (DLS) or a Brunnauer-Emmet-Teller (BET) sizing method was used in conjunction with a Transfer Electron Micro-scopy (TEM) or Scanning Electron MicroMicro-scopy (SEM) method, the latter sizing values were pre-ferred over the former ones as they provide better accuracy (DLS and BET methods both take into account the hydrodynamic size of particles with the assumption of sphericity instead of their actual dimensions. This incurs problems when the nano-particles are clustered/agglomerated or not spherical).
d. In the cases where the Pool Boiling Heat transfer (PBHT) or Critical Heat Flux (CHF) were consid-ered, values from experiments representing a real and practical engineering application were recorded over the rest.
e. In the rare case where nanoparticle concentrations were represented as mass fraction quantities, a volumetric conversion, according to Equation 1 was used [7].
= 1
1−m
m ρp ρf
+ 1 (1)
f. When the mode of heat transfer was not clearly stated or was not evident from the experiment (for example if heat transfer mode was purely via conduction/convection), then the experimental values were sorted into the convection/mixed con-vection heat transfer class (when both modes are present, it is expected that the effects of convection would prevail over the effects of conduction).
Table 9 displays an average price list of different nanoparticle materials, while Table 10 and Figure 1 show the nanofluid types in the literature. It is evident that the cost of particular type(s) of nanoparticles heavily controlled the available study. As a consequence, the statistical results of this paper are heavily inclined towards indicating the thermal performance of Al2O3 -water type nanofluids.
Thermal performance studies
[image:3.595.56.543.530.732.2]Previous investigators chose to carry out their studies either via the experimental or the analytical route. For the former one, the majority of researchers selected simple experiments (e.g. simple heated pipe/duct flow or stationary flow experiments) using various combinations of nanofluid concentrations and materials under
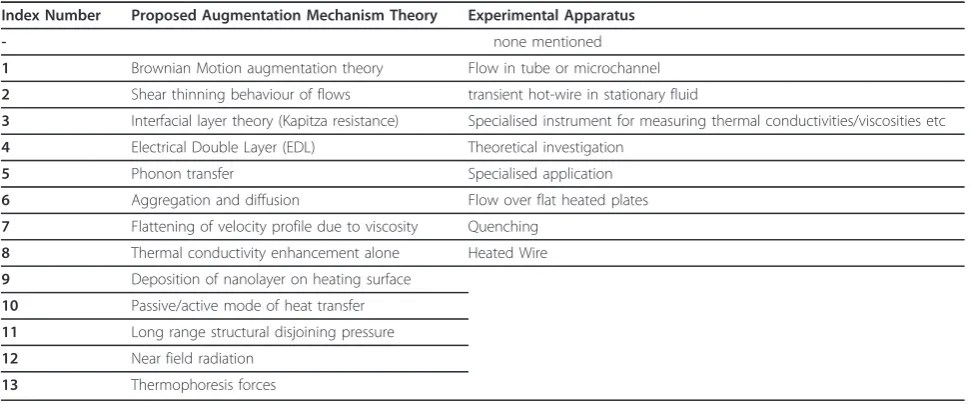
Table 1 Index Number Table
Index Number Proposed Augmentation Mechanism Theory Experimental Apparatus
- none mentioned
1 Brownian Motion augmentation theory Flow in tube or microchannel
2 Shear thinning behaviour of flows transient hot-wire in stationary fluid
3 Interfacial layer theory (Kapitza resistance) Specialised instrument for measuring thermal conductivities/viscosities etc
4 Electrical Double Layer (EDL) Theoretical investigation
5 Phonon transfer Specialised application
6 Aggregation and diffusion Flow over flat heated plates
7 Flattening of velocity profile due to viscosity Quenching
8 Thermal conductivity enhancement alone Heated Wire
9 Deposition of nanolayer on heating surface
10 Passive/active mode of heat transfer
11 Long range structural disjoining pressure
12 Near field radiation
13 Thermophoresis forces
Sergis and HardalupasNanoscale Research Letters2011,6:391 http://www.nanoscalereslett.com/content/6/1/391
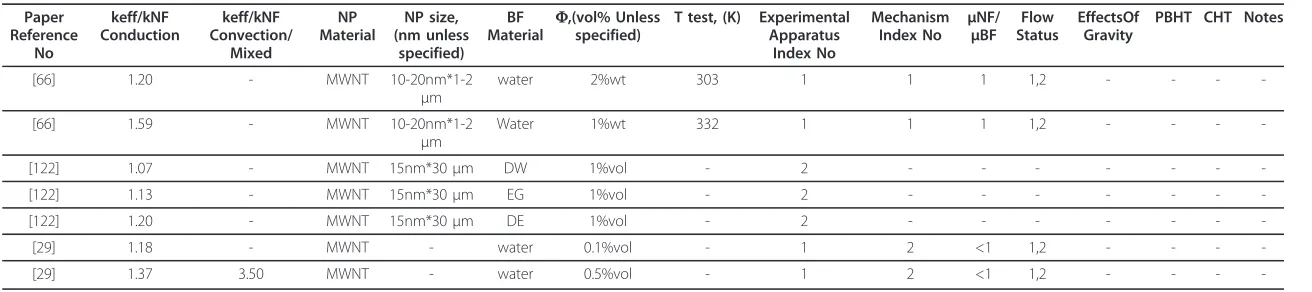
Table 2 Experiments focusing on heat transfer of Carbon Nanotube - Nanofluids
Paper Reference
No
keff/kNF Conduction
keff/kNF Convection/
Mixed
NP Material
NP size, (nm unless
specified) BF Material F
,(vol% Unless specified)
T test, (K) Experimental Apparatus
Index No
Mechanism Index No μ
NF/ μBF
Flow Status
EffectsOf Gravity
PBHT CHT Notes
[66] 1.20 - MWNT 10-20nm*1-2
μm
water 2%wt 303 1 1 1 1,2 - - -
-[66] 1.59 - MWNT 10-20nm*1-2
μm
Water 1%wt 332 1 1 1 1,2 - - -
-[122] 1.07 - MWNT 15nm*30μm DW 1%vol - 2 - - -
-[122] 1.13 - MWNT 15nm*30μm EG 1%vol - 2 - - -
-[122] 1.20 - MWNT 15nm*30μm DE 1%vol - 2 - - -
-[29] 1.18 - MWNT - water 0.1%vol - 1 2 <1 1,2 - - -
-[29] 1.37 3.50 MWNT - water 0.5%vol - 1 2 <1 1,2 - - -
-Sergis
and
Hardalupas
Nanosca
le
Research
Letters
2011,
6
:391
http://ww
w.nanoscalere
slett.com/co
ntent/6/1/3
91
Page
4
of
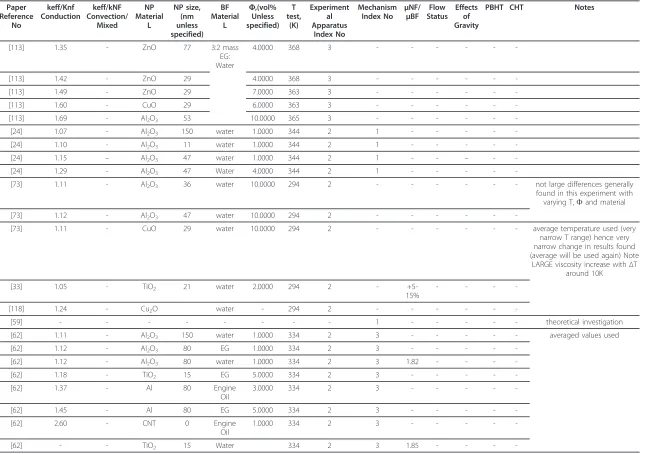
Table 3 Experiments focusing on Conduction heat transfer
Paper Reference
No
keff/Knf Conduction
keff/kNF Convection/
Mixed
NP Material
L
NP size, (nm unless specified)
BF Material
L
F,(vol% Unless specified)
T test,
(K)
Experiment al Apparatus
Index No
Mechanism Index No
μNF/ μBF
Flow Status
Effects of Gravity
PBHT CHT Notes
[113] 1.35 - ZnO 77 3:2 mass
EG: Water
4.0000 368 3 - - -
-[113] 1.42 - ZnO 29 4.0000 368 3 - - -
-[113] 1.49 - ZnO 29 7.0000 363 3 - - -
-[113] 1.60 - CuO 29 6.0000 363 3 - - -
-[113] 1.69 - Al2O3 53 10.0000 365 3 - - -
-[24] 1.07 - Al2O3 150 water 1.0000 344 2 1 - - - -
-[24] 1.10 - Al2O3 11 water 1.0000 344 2 1 - - - -
-[24] 1.15 – Al2O3 47 water 1.0000 344 2 1 - - – -
-[24] 1.29 - Al2O3 47 Water 4.0000 344 2 1 - - - -
-[73] 1.11 - Al2O3 36 water 10.0000 294 2 - - - not large differences generally
found in this experiment with
varying T,Fand material
[73] 1.12 - Al2O3 47 water 10.0000 294 2 - - -
-[73] 1.11 - CuO 29 water 10.0000 294 2 - - - average temperature used (very
narrow T range) hence very narrow change in results found (average will be used again) Note
LARGE viscosity increase withΔT
around 10K
[33] 1.05 - TiO2 21 water 2.0000 294 2 -
+5-15%
- - -
-[118] 1.24 - Cu2O water - 294 2 - - -
-[59] - - - 1 - - - theoretical investigation
[62] 1.11 - Al2O3 150 water 1.0000 334 2 3 - - - averaged values used
[62] 1.12 - Al2O3 80 EG 1.0000 334 2 3 - - - -
-[62] 1.12 - Al2O3 80 water 1.0000 334 2 3 1.82 - - -
-[62] 1.18 - TiO2 15 EG 5.0000 334 2 3 - - - -
-[62] 1.37 - Al 80 Engine
Oil
3.0000 334 2 3 - - - -
-[62] 1.45 - Al 80 EG 5.0000 334 2 3 - - - -
-[62] 2.60 - CNT 0 Engine
Oil
1.0000 334 2 3 - - - -
-[62] - - TiO2 15 Water 334 2 3 1.85 - - -
-Sergis
and
Hardalupas
Nanosca
le
Research
Letters
2011,
6
:391
http://ww
w.nanoscalere
slett.com/co
ntent/6/1/3
91
Page
5
of
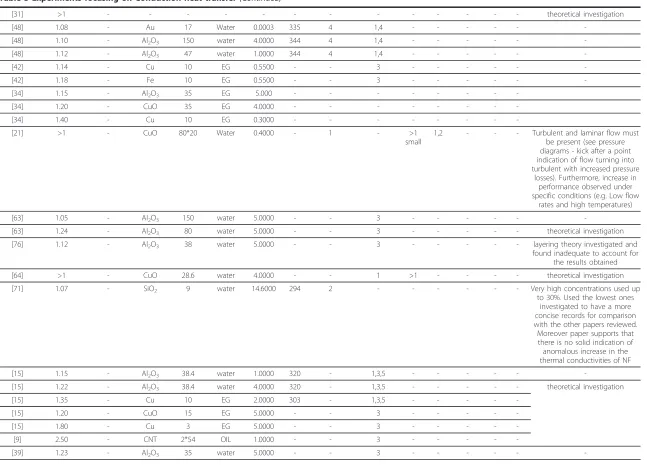
Table 3 Experiments focusing on Conduction heat transfer(Continued)
[31] >1 - - - theoretical investigation
[48] 1.08 - Au 17 Water 0.0003 335 4 1,4 - - -
-[48] 1.10 - Al2O3 150 water 4.0000 344 4 1,4 - - -
-[48] 1.12 - Al2O3 47 water 1.0000 344 4 1,4 - - -
-[42] 1.14 - Cu 10 EG 0.5500 - - 3 - - -
-[42] 1.18 - Fe 10 EG 0.5500 - - 3 - - -
-[34] 1.15 - Al2O3 35 EG 5.000 - - -
-[34] 1.20 - CuO 35 EG 4.0000 - - -
-[34] 1.40 - Cu 10 EG 0.3000 - - -
-[21] >1 - CuO 80*20 Water 0.4000 - 1 - >1
small
1,2 - - - Turbulent and laminar flow must
be present (see pressure diagrams - kick after a point indication of flow turning into turbulent with increased pressure
losses). Furthermore, increase in performance observed under specific conditions (e.g. Low flow
rates and high temperatures)
[63] 1.05 - Al2O3 150 water 5.0000 - - 3 - - -
-[63] 1.24 - Al2O3 80 water 5.0000 - - 3 - - - theoretical investigation
[76] 1.12 - Al2O3 38 water 5.0000 - - 3 - - - layering theory investigated and
found inadequate to account for the results obtained
[64] >1 - CuO 28.6 water 4.0000 - - 1 >1 - - - - theoretical investigation
[71] 1.07 - SiO2 9 water 14.6000 294 2 - - - Very high concentrations used up
to 30%. Used the lowest ones investigated to have a more concise records for comparison with the other papers reviewed. Moreover paper supports that
there is no solid indication of anomalous increase in the thermal conductivities of NF
[15] 1.15 - Al2O3 38.4 water 1.0000 320 - 1,3,5 - - -
-[15] 1.22 - Al2O3 38.4 water 4.0000 320 - 1,3,5 - - - theoretical investigation
[15] 1.35 - Cu 10 EG 2.0000 303 - 1,3,5 - - - -
-[15] 1.20 - CuO 15 EG 5.0000 - - 3 - - - -
-[15] 1.80 - Cu 3 EG 5.0000 - - 3 - - - -
-[9] 2.50 - CNT 2*54 OIL 1.0000 - - 3 - - - -
-[39] 1.23 - Al2O3 35 water 5.0000 - - 3 - - -
-Sergis
and
Hardalupas
Nanosca
le
Research
Letters
2011,
6
:391
http://ww
w.nanoscalere
slett.com/co
ntent/6/1/3
91
Page
6
of
Table 3 Experiments focusing on Conduction heat transfer(Continued)
[39] 1.25 - CuO 35 water 4.2000 - - 3 - - -
-[39] 1.30 - Al2O3 35 EG 6.0000 - - 3 - - - average value used
[50] 1.30 - Al 90 water 5.0000 324 3 1,6 - - -
-[90] 1.03 - Au
Citrate
15.0000 Toluene 0.001 304 - - - Surface Coating
[90] 1.05 - Au
Thiolate
3.5000 Toluene 0.0050 334 - - -
-[90] 1.05 - Au
Citrate
15.0000 toluene 0.0003 304 - - -
-[90] 1.07 - Au
Thiolate
3.5000 Toluene 0.0110 304 - - -
-[90] 1.08 - Au
Citrate
15.0000 toluene 0.0003 304 - - -
-[90] 1.09 - Au
Thiolate
Toluene 0.0110 334 - - -
-[123] >1 - - - 1,3 - - - theoretical investigation - small
size, largeF, large enhancement
[94] >1 - - - 1 - - - -
-[92] >1 - - - 1 - - - theoretical investigation
Brownian dynamic simulation
-small size, largeFlarge
enhancement
[109] 1.05 - Al2O3 50 water 2.0 298 - - - suspected aggregation at lower
NP sizes in this experimental
work performed, that’s why the
conductivity increase for increasing NP size. Authors explain this by implying that the decrease in the NP size leads to increased phonon scattering
-decreased NP conductivity
[109] 1.06 - Al2O3 50 water 3.0 298 - - -
-[109] 1.06 - Al2O3 250 water 2.0 298 - - -
-[109] 1.08 - Al2O3 50 water 4.0 298 - - -
-[109] 1.09 - Al2O3 50 EG 2.0 298 - - -
-[109] 1.09 - Al2O3 250 EG 2.0 298 - - -
-[109] 1.09 - Al2O3 250 EG 3.0 298 - - -
-[109] 1.11 - Al2O3 50 water 3.0 298 - - -
-[109] 1.14 - Al2O3 250 EG 3.0 298 - - -
-[109] 1.15 - Al2O3 250 Water 3.0 298 - - -
-Sergis
and
Hardalupas
Nanosca
le
Research
Letters
2011,
6
:391
http://ww
w.nanoscalere
slett.com/co
ntent/6/1/3
91
Page
7
of
Table 3 Experiments focusing on Conduction heat transfer(Continued)
[61] 1.02 - Al2O3 45 EG 1.0 295 - - - 3ωmethod used
[61] 1.03 - Al2O3 45 EG 2.0 295 - - -
-[61] 1.04 - Al2O3 45 water 1.0 295 - - -
-[61] 1.08 - Al2O3 45 EG 3.0 295 - - -
-[61] 1.08 - Al2O3 45 water 2.0 295 - - -
-[61] 1.10 - Al2O3 45 EG 4.0 295 - - -
-[61] 1.11 - Al2O3 45 water 3.0 295 - - -
-[61] 1.13 - Al2O3 45 water 4.0 295 - - -
-[91] >1 - - - 1 - - - theoretical investigation
[38] 1.1 - Ag 60 water 0.3 424 2 1,13 1.1 1 - - -
-[38] 1.15 - Ag 60 water 0.6 424 2 1,13 1.4 1 - - -
-[38] 1.25 - Ag 60 water 0.9 424 2 1,13 1.6 1 - - -
-[38] 1.40 - Ag 60 water 0.3 464 2 1,13 1.5 1 - - -
-[38] 1.80 - Ag 60 water 0.6 464 2 1,13 1.9 1 - - -
-[38] 2.30 - Ag 60 water 0.9 464 2 1,13 2.2 1 - - -
-Sergis
and
Hardalupas
Nanosca
le
Research
Letters
2011,
6
:391
http://ww
w.nanoscalere
slett.com/co
ntent/6/1/3
91
Page
8
of
Table 4 Experiments focusing on Convection heat transfer
Paper Reference
No
keff/kNF Conduction
keff/kNF Convection/
mixed
NP material
NP size, (nm unless
specified) BF material
F,(vol% unless specified)
T test,
(K)
Experimental Apparatus
Index No
Mechanism Index No
μNF/
μBF Flow Status
Effects of Gravity
PBHT CHT Notes
[43] - Al2O3 - engine
oil
4.4wt - 5 - - - 4WD rotary blade coupling
[43] - >1 CuO - 4.4 wt - 5 - - -
-[81] 1.03 - CuO - 60:40
EG/ water
1.0 293 1 - 1.14 - - - - theoretical investigation
[81] 1.06 - CuO 29 2.0 293 1 - 1.27 - - -
-[81] 1.09 - CuO 29 3.0 293 1 - 1.69 - - -
-[81] 1.09 1.18 SiO2 50 6.0 293 1 - 1.33 - - -
-[81] 1.09 - SiO2 20 6.0 293 1 - 1.41 - - -
-[81] 1.09 - SiO2 100 6.0 293 1 - 1.21 - - -
-[81] 1.12 - CuO 29 4.0 293 1 - 2.12 - - -
-[81] 1.15 - CuO 29 5.0 293 1 - 2.60 - - -
-[81] 1.21 1.75 CuO 29 6.0 293 1 - 3.49 - - -
-[81] 1.22 1.36 Al2O3 53 6.0 293 1 - 1.80 - - -
-[75] - >1 Al2O3 varying water 4.0 - 1 - - - theoretical investigation - 2
phase approach showed the smaller the diameter the
greater the HTC
[12] - 1.15 Al2O3 <100 water 4.0 314 1 6 0.00 - - - - theoretical investigation - 1
phase approach
[32] - - TiO2 21 water 0.2 - 1 - - 2 - - - negligible HT conduction
increase
[60] - >1 Al2O3 45 50:50
EG/ water
- - 2,3 - <1 - - - -
-[84] - >1 Al2O3 36 water 2.8 - 5 - - 2 - - - jet impingement experiment
[17] - >1 Cu 42 water 1.0 - - - - 2 - - - theoretical investigation - 2
phase model
[41] - 1.12 Al2O3 20 water 0.2 - 1 1,6 - 1 - - - values recorded here for an
averaged Pecklet number
[41] - 1.13 Al2O3 20 water 0.5 - 1 1,6 - 1 - -
-[41] - 1.15 Al2O3 20 water 1.0 - 1 1,6 - 1 - -
-[41] - 1.22 Al2O3 20 water 1.5 - 1 1,6 - 1 - -
-[41] - 1.30 Al2O3 20 water 2.0 - 1 1,6 - 1 - -
-[41] - 1.35 Al2O3 20 water 2.5 - 1 1,6 - 1 - -
-[18] 1.15 - Al2O3 - water 5.0 - 1 - - 1 - - - geometry dependent
augmentation/deterioration
Sergis
and
Hardalupas
Nanosca
le
Research
Letters
2011,
6
:391
http://ww
w.nanoscalere
slett.com/co
ntent/6/1/3
91
Page
9
of
Table 4 Experiments focusing on Convection heat transfer(Continued)
[18] 1.156342 geometry
dependent
Al2O3 - HFE
7100
5 - 1 - - 1 - -
-[99] - 1.03 ZrO2 50 water 1.32 - 1 - - 1 - - -
-[99] - 1.27 Al2O3 50 water 6 - 1 - 7.2 1 - - -
-[106] - 1.08 Al2O3 30 water 0.3 - 1 1,7 - 1 - - -
-[19] - >1 Al2O3 - HFC134a 0.1%wt - 5 - <1 - - - - MO: mineral oil used for
lubrication inside HFC134a refrigerant fluid along with NPs.Conventionally Polyol-ester (POE) is used as a
lubricant
[19] - >1 TiO2 - 0.1%wt - 5 - <1 - - - - MO: mineral oil used for
lubrication inside HFC134a refrigerant fluid along with NPs.Conventionally Polyol-ester (POE) is used as a lubricant. Same effect when
using the same size Al2O3NP
[13] - >1 Al2O3 - water 0.1 - 5 - - - theoretical investigation - 2
phase approach, smaller diameter, better effects, larger
skin friction
[14] 1.04 1.11 Al2O3 150 water 4%wt - 1 - - 1 - - - fully developed region values
used here
[14] 1.06 1.25 Al2O3 45 water 4%wt - 1 - - 1 - -
-[74] - >1 Al2O3 10 water 2 - 1 1 1 1 - - - theoretical investigation - 2
phase approach-fully developed region values
recorded here
[74] - >1 Al2O3 10 water 4 - 1 1 1 1 - -
-[74] - >1 Al2O3 10 water 7 - 1 1 1 1 - -
-[20] - 1.12 Al2O3 100 water 1 - 1 1,6 1.419 1 - -
-[20] - 1.187 Al2O3 100 water 4 - 1 1,6 1.92 1 - -
-[47] - 1.32 Al2O3 170 water 1.8 300 1 - 1 1 - - - average values used
[40] - >1 TiO2 95 water 0.6 300 1 8 - 1 - - - theoretical investigation
1phase and Langrange & Euler methods used
[40] - >1 TiO2 145 water 0.6 300 1 8 - 1 - -
-[40] - >1 TiO2 210 water 0.6 300 1 8 - 1 - -
-[10] - 1.3 Cu - water 10 - 5 - - - theoretical investigation
[10] - >1 Ag - water - - 5 - - -
-[10] - >1 Al2O3 - water - - 5 - - -
-Sergis
and
Hardalupas
Nanosca
le
Research
Letters
2011,
6
:391
http://ww
w.nanoscalere
slett.com/co
ntent/6/1/3
91
Page
10
of
Table 4 Experiments focusing on Convection heat transfer(Continued)
[10] - >1 CuO - water - - 5 - - -
-[10] - >1 TiO2 - water - - 5 - - -
-[77] 1.028192 1 Al2O3 36 water 1 300 1 - 1.025 1,2 - - - No boiling values recorded
[77] 1.030973 1 Al2O3 36 HFE
7100
1 300 1 - 1.025 1,2 - -
-[77] 1.058043 1 Al2O3 36 water 2 300 1 - 1.050 1,2 - -
-[77] 1.061947 1 Al2O3 36 HFE
7100
2 300 1 - 1.050 1,2 - -
-[77] 1.087894 1 Al2O3 36 water 3 300 1 - 1.075 1,2 - -
-[77] 1.09292 1 Al2O3 36 HEF
7100
3 300 1 - 1.075 1,2 - -
-[77] 1.119403 1 Al2O3 36 Water 4 300 1 - 1.100 1,2 - -
-[77] 1.125369 1 Al2O3 36 HFE
7100
4 300 1 - 1.100 1,2 - -
-[77] 1.149254 1 Al2O3 36 water 5 300 1 - 1.124 1,2 - -
-[77] 1.125369 1 Al2O3 36 HFE
7100
4 300 1 - 1.100 1,2 - -
-[77] 1.149254 1 Al2O3 36 water 5 300 1 - 1.124 1,2 - -
-[77] 1.157817 1 Al2O3 36 HFE
7100
5 300 1 - 1.125 1,2 - -
-[95] 1.028333 - Al2O3 42 water 1 294 6 - - - theoretical investigation
[95] 1.058333 - Al2O3 42 Water 2 294 6 - - - -
-[95] 1.088333 - Al2O3 42 water 3 294 6 - - -
-[95] 1.118333 - Al2O3 42 water 4 294 6 - - -
-[52] - <1 Al2O3 43.5 water 1 - 5 - - -
-[52] - <1 CuO 11.05 water 1 - 5 - - -
-[52] - <1 JS Clay
discs
25diax1thick nes
water 1 - 5 - - - -
-[101] - >1 Cu 100 water - - 6 - - 1 - -
-Sergis
and
Hardalupas
Nanosca
le
Research
Letters
2011,
6
:391
http://ww
w.nanoscalere
slett.com/co
ntent/6/1/3
91
Page
11
of
Table 5 Experiments focusing on Natural Convection Heat Transfer
Paper Reference
No
keff/kNF Conduction
keff/kNF Convection/
mixed
NP material
NP size, (nm unless specified)
BF material F
,(vol% unless specified)
T test,
(K)
Experimental Apparatus Index
No
Mechanism Index No μ
NF/
μBF Flow Status
Effects of Gravity
PBH T
CHT Notes
[51] - >1 - - - 2 - - - significant - - theoretical
investigation
[82] - >1 Al2O3 60 water 0.3-2% - 1 - 1 - -
-[87] - >1 Al2O3 - water - - 2 - - - -
-[87] - >1 Cu - water - - 2 - - - -
-[87] - >1 TiO3 - water - - 2 - - - -
-[110] - >1 - - - 5 - - - -
-[35] - >1 Ag - water - - 5 - - - -
-[35] - >1 Al2O3 - water - - 5 - - - -
-[35] - >1 Cu - water - - 5 - - - -
-[35] - >1 CuO - water - - 5 - - - -
-[35] - >1 TiO2 - water - - 5 3 - - -
-[46] - >1 Cu 10 water - - 2 1,3,6 - - -
-Sergis
and
Hardalupas
Nanosca
le
Research
Letters
2011,
6
:391
http://ww
w.nanoscalere
slett.com/co
ntent/6/1/3
91
Page
12
of
Table 6 Experiments focusing on Pool Boiling and Critical Heat Flux heat transfer Paper
Reference No
keff/kNF Conduction
keff/kNF Convection/
mixed
NP material
NP size, (nm unless
specified) BF material F
,(vol% unless specified)
T test,
(K)
Experimental Apparatus
Index No
Mechanism Index No μ
NF/ μBF
Flow Status
Effects of Gravity
PBHT CHT Notes
[69] - - Ag
-silver sphere
35 water 0.5%wt 364 7 9 - - - <1 - initially washed sphere
quenched from 974K
[69] - - 35 water 1%wt 364 7 9 - - - <1
-[69] - - 35 water 2%wt 364 7 9 - - - <1
-[69] - - 35 water 4%wt 364 7 9 - - - <1
-[69] - - 25 water 0.125%wt 364 7 9 - - - >1
-[69] - - 25 water 0.25%wt 364 7 9 - - - >1
-[69] - - 25 water 0.5%wt 364 7 9 - - - >1
-[69] - - 25 water 1%wt 364 7 9 - - - >1
-[115] - - Al2O3 220 Trypan
Blue
- - 5 10 - - - >1 -
-[115] - - Au
(Shells)
170 - - 5 10 - - - >1 -
-[115] - - Au
(spheres)
30 - - 5 10 - - - >1 -
-[115] - - Au
(Rods)
14*45 - - 5 10 - - - >1 -
-[57] - - Al2O3 47 water 0.1 - 8 9 - - - - 1.78 unwashed heating
surface values used here. Max values used. When
CHT>1 then PBHT is inferred to be >1 as well
[57] - - SiO2 90 water 0.1 - 8 9 - - - - 2.00
[57] - - TiO2 85 water 0.1 - 8 9 - - - - 2.75
[57] - - TiO2 85 water 1 - 8 9 - - - - 2.70
[56] - - Al2O3 47 water 0.1 374 8 9 - - - - 1.75
[56] - - TiO2 85 water 0.1 374 8 9 - - - - 2.15
[119] - - - 8 11 - - - - >1 theoretical investigation
[29] - - Al2O3 30 water 1.25%wt - 8 9 - - - 1.4 - aggregation is observed with
an effective particle size of around 270 nm
[108] - - Al2O3 25 water 2%wt - 8 6,8 - - - 1.3
-[108] - - SnO2 55 water 3%wt - 8 6,8 - - - 1.2
-[54] - - Al2O3 38.8 water 0.1 304 7 9 - - - - 1.50 Stainless Steel Sphere - SS,
Zircalloy Sphere - Zry quenched from 1304K
Sergis
and
Hardalupas
Nanosca
le
Research
Letters
2011,
6
:391
http://ww
w.nanoscalere
slett.com/co
ntent/6/1/3
91
Page
13
of
Table 6 Experiments focusing on Pool Boiling and Critical Heat Flux heat transfer(Continued)
[54] - - Al2O3 38.8 water 0.1 304 7 9 - - - - 2.37
[54] - - Diamond 165.4 water 0.1 304 7 9 - - - - 1.08
[54] - - diamond 165.4 water 0.1 304 7 9 - - - - 0.60
[54] - - SiO2 32.9 water 0.1 304 7 9 - - - - 1.32 SS sphere
[54] - - SiO2 32.9 water 0.1 304 7 9 - - - - 1.54 Zry sphere
[112] - - TiO2 21 HCF
141b
0.05 - 8 - - - - <1 - Heating surface washed after
each trial
[125] - - Al2O3 - water 0.05 g/l 334 8 - - - - 1 2.00 Heating surface washed after
each trial
[3] - - Al2O3 20 water 1 371 8 9 - - - 1.4 - heavily agglomerated
NF. If greatly sub cooled NF used there is degradation of heating
wire
[68] - - CuO 30 water 1%wt - 8 9 - - - 1.25 1.50 Atmospheric Pressure
[68] - - CuO 30 water 1%wt - 8 4,6,9 - - - 2.5 3.00 Lowered Pressure
[55] - - Al2O3 47 water 0.001 - 8 9 - - - - 1.70 Saturated CHT
[55] - - Al2O3 47 water 0.1 - 8 9 - - - - 1.70
[55] - - TiO2 23 water 0.1 - 8 9 - - - - 2.00
[72] - - Al2O3 22.6 water 0.08%wt 374 8 9 - - - - 1.50
[72] - - Al2O3 46 water 0.08%wt 374 8 9 - - - - 1.45
[72] - - BiO2 38 water 0.01%wt 374 8 9 - - - - 1.33
Sergis
and
Hardalupas
Nanosca
le
Research
Letters
2011,
6
:391
http://ww
w.nanoscalere
slett.com/co
ntent/6/1/3
91
Page
14
of
Table 7 Experiments focusing on Rheological Studies
Paper Reference
keff/kNF Conduction
keff/kNF Convection/
mixed
NP material
NP size, (nm unless specified)
BF material
F,(vol% Unless specified)
T test,
(K)
Experimental Apparatus
Index No
Mechanis m Index
No
μNF/ μBF
Flow Status
Effects of Gravity
PBHT CHT Notes
[23] - 1.08 TNT 10X100 EG 1 - 1,2,6 1.35 - - - - high shear viscosity recorded here
[23] - 1.15 TNT 10X100 EG 1.75 - 1,2,6 1.75 - - -
-[93] - - Fe2O3
-PEO dispersant
30 water 3 299 - 2 1.015 - - - - high shear viscosity recorded here,
averaged values
[93] - - Fe2O3
-PVP dispersant
30 water 3 299 - 2 1.07 - - -
-[83,85] - - Al2O3 36 water 3 290 3 - 1.3 - - - - the effect of rising temperature
reduces the effective viscosity. However, the values for augmented temperature for viscosity are not recorded here as
they are a result of unstable and damaged NF due to the surfactant
change of composition
[83,85] - - Al2O3 36 water 6 290 3 - 2 - - -
-[83,85] - - Al2O3 36 water 10 290 3 - 3.1 - - -
-[83,85] - - Al2O3 47 water 1 290 3 - 1.4 - - -
-[83,85] - - Al2O3 47 water 4 290 3 - 3 - - -
-[83,85] - - Al2O3 47 water 9 290 3 - 5.3 - - -
-[83,85] - - CuO 29 water 1 290 3 - 1.35 - - -
-[83,85] - - CuO 29 water 4 290 3 - 2.5 - - -
-[83,85] - - CuO 29 water 9 290 3 - 4 - - -
-Sergis
and
Hardalupas
Nanosca
le
Research
Letters
2011,
6
:391
http://ww
w.nanoscalere
slett.com/co
ntent/6/1/3
91
Page
15
of
Table 8 Various experiments not falling into the previous categories
Paper Reference
No
keff/kNF Convection
keff/kNF Convection/
mixed
NP material
NP size, (nm unless specified)
BF material
F,(vol% unless specified)
T test,
(K)
Experimental Apparatus
Index No
Mechanism Index No
μNF/
μBF Flow Status
Effects of Gravity
PBHT CHT Notes
[53] 1.4 - CNC 15 water 4.2 wt% 299 2 - 1.11 - - - -
-[22] 1.05 - SiO2 10 water 16 - - -
-[22] 1.08 - SiO2 15 water 16 - - -
-[22] 1.16 - SiO2 30 water 16 - - -
-[49] >1 >1 - - - 3,6,12 >1 - - - - theoretical
investigation
[121] - >1 Al2O3 42.5 water - - - 1,13 - - - -
-[126] - 1.60 SiC 170 water 3.7 320 1 1,13 >1 2 - - - lower viscosity rather
than using Al2O3
[45] - 1.01 Al2O3 150 EG 0.5 294 - 1 - - - theoretical
investigation
[45] - 1.03 Al2O3 150 EG 0.5 300 - 1 - - - -
-[45] - 1.03 Al2O3 150 EG 0.5 309 - 1 - - - -
-[45] - 1.05 Al2O3 150 EG 0.5 324 - 1 - - - -
-[45] - 1.06 Al2O3 150 EG 2 300 - 1 - - - -
-[45] - 1.11 Al2O3 11 EG 1 294 - 1 - - - -
-[45] - 1.12 Al2O3 150 EG 3 300 - 1 - - - -
-[45] - 1.13 Al2O3 11 EG 1 309 - 1 - - - -
-[45] - 1.16 Al2O3 11 EG 1 324 - 1 - - - -
-[45] - 1.17 Al2O3 60 EG 2 300 - 1 - - - -
-[45] - 1.35 Al2O3 60 EG 5 300 - 1 - - - -
-[58] - 1.10 Al2O3 80 water 2 - - 1 - - - -
-[58] - 1.15 Cu 100 water 2 - - 1 - - - -
-[58] - 1.55 Cu 100 water 5 - - 1 - - - -
-[86] - >1 Al2O3 20 water 2 - 5 1,9 - - - >1 - averaged values used.
Thermosiphon experiment
[88] - >1 CuO 30 water 4 329 5 - >1 2 - - -
-[102] - - Al 60 Ethanol 2 310 5 - >1 - >1 -
-[89] 1.039539 >1 CuO 30 water 2 - 5 - 1.3 2 - - -
-[89] 1.059308 >1 Al2O3 20 water 2.9 - 5 - 2.9 2 - - -
-[89] 1.059308 >1 CuO 40 water 3 - 5 - - 2 - - -
-[89] 1.059308 >1 TiO2 - water 2.4 - 5 - 2 2 - - -
-[89] 1.067545 >1 Al2O3 11 water 4 - 5 - - 2 - - -
-[89] 1.102142 >1 CuO 30 water 4 - 5 - 2 2 - - -
-[89] 1.186161 >1 CuO 30 water 8 - 5 - 5.6 2 - - -
-Sergis
and
Hardalupas
Nanosca
le
Research
Letters
2011,
6
:391
http://ww
w.nanoscalere
slett.com/co
ntent/6/1/3
91
Page
16
of
different heat input conditions. The simple experiments provided more insight into the actual physics of heat transfer in nanofluids whilst the more complex experi-ments usually gave information concerning the practical usage of particular nanofluid compositions and types for certain applications, with little or no referral to the employed theories for heat transfer.
Analytical-computational methods involve the formu-lation of semi-empirical correformu-lations in order to predict the behaviour of nanofluids. The most common analyti-cal methods are based on the renovated Maxwellian [8], Equation 2, or renovated Hamiltonian-Crosser equation models [9], Equation 3, to be able to predict the effec-tive heat conduction in a nanofluid. Additional compo-nents are usually added to the equations to take into account the Brownian motion heat transfer mechanism.
keff =
kpe+ 2kBF+ 2(kpe−kBF)(1 +β)3
kpe+ 2kBF−(kpe−kBF)(1 +β)3
kBF (2)
keff =
1 + nfeA
1−feA
kBF (3)
Equations 2 and 3 rely on the molecular layering the-ory, i.e. the presence of nanolayers with reduced thermal resistance covering the surface of each nanoparticle. The renovated Hamiltonian-Crosser model equation is assumed to be more accurate, as the shape of the solid nanoparticles is taken into account (sphericity), while
the renovated Maxwellian model only assumes spherical particles and works well for nanoparticle diameters that are less than 10 nm [8].
For the other heat transfer modes (apart of heat con-duction), the formulation of further equations to include additional parameters (e.g. density changes, buoyancy forces, gravitational forces, etc.), has its foundations on Equations 2 and 3.
The critical issue with numerical simulations and semi-empirical correlations is that the majority of researchers predetermined, to some degree, the physical mechanisms underlying behind the anomalous heat transfer characteristics in nanofluids. For example, some semi-empirical correlations are based on fitting experi-mental measurements determined for specific applica-tions. As a result, with the physical understanding of the heat transfer mode mechanisms yet unknown, it becomes trivial to solemnly rely on such simulations and equations to hold valid for a general range of nano-fluid compositions, types and application (e.g. as cool-ants in various heat exchanger designs).
Heat transfer characteristics [1-128]
In the following section, the heat transfer characteristics of nanofluids are considered. Information was collected from the literature and processed to reveal the thermal performance of nanofluids for different heat transfer modes (purely conductive, convective/mixed, pool boil-ing and CHF). Information, regardboil-ing the mechanisms that various researchers employed to describe the anom-alous heat transfer, was also collected to allow the eva-luation of the most statistically occurring patterns for each heat transfer mode.
Finally, a cross-correlation of the findings between the different levels of analysis (explained in“Methodology of statistical analysis”section) was also considered to evalu-ate the observations and reveal any possible trends link-ing the thermal performance characteristics of nanofluids with their by part properties (i.e. consistency and application). Furthermore, the focused samples of level 3 of the analysis provided further information about the parameters controlling the thermal perfor-mance characteristics of nanofluids.
General observations: level 1 analysis
Level 1 of the analysis considers the entire sample record collected from the literature. It aims to present a general idea of the thermal performance of nanofluids for different heat transfer modes.
Heat transfer characteristics
[image:17.595.57.291.110.234.2]a. Heat transfer enhancement studies purely via con-duction (130 observations)Strong evidence of thermal conductivity enhancement exists, as indicated by the his-togram of the findings of Figure 2. An enhancement
Table 9 Most common Nanoparticle materials along with their indicative price ($) per 100 g
Material Indicative Price ($/100 g)
Al (Aluminium) 380
Al2O3(Aluminium Oxide) 70
Cu (Copper) 500
CuO (Copper Oxide) 75
Au (Gold) 5,500
Ag (Silver) 400
[image:17.595.57.291.638.731.2]SiO2(Silica Dioxide) 70 TiO2(Titanium Oxide) 80 Carbon Nanotubes 930-12,500
Table 10 The four most probable Nanofluids found in the literature
Type of Nanofluid Used
Sample Percentage
Number of Corresponding Observations
Al2O3- Water 33.9 85 Al2O3- Ethylene
Glycol (EG)
8.8 22
CuO - Water 6.8 17
TiO2- Water 6.8 17
Total 56.3 141
Sergis and HardalupasNanoscale Research Letters2011,6:391 http://www.nanoscalereslett.com/content/6/1/391
lying between 5 and 9% was observed for 30% of the sample. The variation around the 5-9% enhancement range is large. However, the majority of the remaining observations are in the 1-4% and 10-24% enhancement ranges, representing around 45% of the sample. The remaining data (around 25% of the sample) indicate enhancement above 29% and some even larger than
84%. Therefore, there is a need for additional under-standing of the origin of the resulting enhancement of heat transfer due to conduction.
b. Heat transfer enhancement studies via convection/ mixed heat transfer mode (91 observations) Strong evidence of heat transfer enhancement by nanofluids for convective or mixed heat transfer mode is indicated in 0.0% 5.0% 10.0% 15.0% 20.0% 25.0% 30.0% 35.0% 40.0% Al 2O 3-w at er Al 2O 3-E G CuO-w ate r Ti O 2-w at er A g-w ater
Not Stated Au-T
ol ue ne C u-w ater C uO-EG:w ater MW NT -W ater SiO2-w ater A l2O 3-H F E7100 Cu-E G A l2O3-EG:w ater A u-T ry pa n B lue SiO2 -E G:w ater Z nO-EG:w ater CNT -E O CuO-E G D iam on d(C ) -w at er Fe2 O3 -w ater T iO 2-H F C 134a TN T-E G Al 2O 3-E O A l2O 3-H F C 134a Al 2O 3-T ry pa n B lu e Al -E G Al -E O Al -E th an ol A l-w ater Bi O 2-w at er CNC-w ate r C u2O-w ater Fe-E G JS C lay -w ater SiC-w ater Sn O2-w ater Ti O 2-E G Ti O 3-w at er Z rO2-w ater Pop u lat ion Prop ort ion % (ou t
of 249 ob
servat
ion
s)
[image:18.595.58.540.87.613.2]Types of Nanofluids used
Figure 1Nanofluid type distribution.
Sergis and HardalupasNanoscale Research Letters2011,6:391 http://www.nanoscalereslett.com/content/6/1/391
the histogram of Figure 3. Most data indicate a convec-tive heat transfer coefficient enhancement between 10 and 19% (18% of the sample). However, the spread of the enhancement results is very large. The majority of the results (around 45% of the sample) indicated unspecified enhancement. There is also weak statistical indication of nanofluids causing deterioration of the heat transfer
coefficient (11% of the sample) and an even smaller per-centage of the sample indicating no enhancement at all (3% of the sample). Therefore, the statistical analysis for convective heat transfer is less consistent than for con-duction, which supports the need for more research. c. PBHT enhancement studies (22 observations) Strong evidence of enhancement of heat transfer due to
0% 5% 10% 15% 20% 25% 30% 35%
P
opula
ti
on
Prop
ort
ion
%
(ou
t
of 130 ob
se
rvat
ion
s)
[image:19.595.55.539.87.618.2]Enhancement % Figure 2Probability function of enhancement of heat transfer due to conduction.
Sergis and HardalupasNanoscale Research Letters2011,6:391 http://www.nanoscalereslett.com/content/6/1/391
pool boiling is indicated in the histogram of Figure 4. Most data reporting specific values show an improve-ment of the PBHT coefficient between 40 and 44% (9% of the sample). However, the majority of the results (45% of the sample) indicate an unspecified enhancement,
while there is an indication of deterioration with moder-ate statistical importance (23% of the sample) and a weak statistical percentage of the considered sample indicating no enhancement at all (5% of the sample). However, the number of publications for PBHT is low and, as a 0%
5% 10% 15% 20% 25% 30% 35% 40% 45% 50%
Pop
u
lati
on
Prop
orti
on
%
(ou
t
of 91 ob
servati
on
s)
[image:20.595.56.540.84.638.2]Enhancement %
Figure 3Probability function of enhancement of heat transfer due to convection/mixed.
Sergis and HardalupasNanoscale Research Letters2011,6:391 http://www.nanoscalereslett.com/content/6/1/391
consequence, the findings have lower confidence level. In addition, the complexity of the physics of PBHT can cause large variation in the observed enhancement and the lack of understanding does not allow the assessment of optimised operation with PBHT.
d. CHF enhancement studies (23 observations) Strong evidence of enhancement ofCHFin boiling applications is indicated in the histogram of Figure 5. Most observations
show an improvement of the CHF coefficient lying between 100 and 200% (35% of the sample). There is a weak statistical percentage of the considered population indicating deterioration (4% of the sample). However, the spread of the results is large and the confidence level of the findings is low. Since several publications have reported very large enhancement of CHT, it is important to under-stand the origin of CHT enhancement in nanofluids.
0% 5% 10% 15% 20% 25% 30% 35% 40% 45% 50%
Pop
u
la
ti
on
Prop
orti
on
%
(ou
t
of 22 ob
servati
on
s)
[image:21.595.58.541.85.605.2]Enhancement % Figure 4Probability function of enhancement of heat transfer due to pool boiling.
Sergis and HardalupasNanoscale Research Letters2011,6:391 http://www.nanoscalereslett.com/content/6/1/391
e. Proposed physical mechanisms for the anomalies of heat transferAn outline of all the proposed mechanisms for each type of heat transfer study is presented. These mechanisms (or a combination of more than one mechan-ism) are used by researchers in the literature to explain
the augmentation of the heat transfer coefficient in nano-fluids. The proposed mechanisms are briefly explained first before the findings of the statistical analysis are pre-sented. The findings are considered jointly for conduction and convection and for pool boiling and CHF.
0% 5% 10% 15% 20% 25% 30% 35% 40% 45% 50%
Pop
u
lati
on
Prop
orti
on
%
(ou
t
of 22 ob
se
rvati
on
s)
[image:22.595.55.541.85.637.2]Enhancement %
Figure 5Probability function of enhancement of heat transfer due to CHF.
Sergis and HardalupasNanoscale Research Letters2011,6:391 http://www.nanoscalereslett.com/content/6/1/391
Conduction/convection/mixed mode heat transfer stu-dies (85 observations)The proposed mechanisms for the enhancement of heat transfer in conduction, convec-tion or for mixed condiconvec-tions in the literature are described below. Example references of papers contain-ing the explanation of the theory are also provided.
Brownian motion
Many researchers believe that there is an apparent enhancement of heat transfer due to Brownian motion of nanoparticles. Their speculations rely on the fact that nanoparticles provide larger surface area for molecular collisions. The higher momentum of nanoparticles (higher mass concentrations compared to the host fluid molecules) are believed to carry and transfer thermal energy more efficiently at greater distances inside the basefluid before they release it in a colder region of the fluid (small packets of energy) [42].
Interfacial layer theory (Kapitza resistance)
The Kapitza resistance is a thermal boundary resis-tance arising from thermal energy carrier scattering at an interface (scattering of phonons and electrons). The type of carrier scattered will depend on the materials governing the interfaces. In liquid-solid interfaces (e.g. nanoparticle-base fluid interfaces), the boundary resis-tance is believed to decrease hence the overall thermal resistance of the system (e.g. a nanofluid in this case) is believed to reduce [70].
Aggregation and diffusion
This mechanism suggests that there is a formation of a linear assembly of nanoparticle chains upon their sus-pension in the host fluid. The occurrence of this chain assembly is speculated to provide a faster path for heat transfer through the nanofluid (faster heat diffusion) [65].
Electrical double layer (EDL) theory
This mechanism proposes an alteration of the strength of intermolecular interaction forces that in effect change the mean free path of the nanoparticles and hence aug-menting the heat transfer of molecules [48].
Flattening of velocity profile due to viscosity
This mechanism proposes that the viscosity change of nanofluids leads to a more uniform velocity profile for flows in pipes and ducts than the expected parabolic velocity profile (Poiseuille flow). The increased near wall velocity is believed to provide an increase in the convec-tive heat transfer coefficient observed in these applica-tions [106].
Near field radiation
Some researchers believe that there is infrared radia-tion emission and absorpradia-tion augmentaradia-tion at the nanoscales (near field radiation). This enhances heat transfer between the heating surface and the nanopar-ticles, the basefluid molecules and the nanoparticles and between the nanoparticles themselves by a factor
of 2-3 compared to the far field radiation estimates [37].
Thermophoretic forces
Thermophoretic forces on nanoparticles arise from the presence of temperature gradients in the fluid causing the concentration of nanoparticles to change around heating and cooling sides relative to the mean value. The consequence of this nanoparticle redistribution is the alteration of the heat transfer coefficient accordingly [121].
Shear thinning behaviour of flows
Some researchers believe that nanofluids exhibit non-Newtonian characteristics with shear thinning beha-viour. The viscosity is believed to reduce at the solid boundaries of a flowing nanofluid, because the shear rate of the nanofluids increases along the walls. This promotes increased heat transfer between the wall and the liquid because the thermal boundary layer width is reduced. It also provides a beneficial lubrication effect [30].
Phonon transfer
A few researchers suggested that nanofluids have an increased heat transfer rate due to specialised phonon and electron interaction and scattering at the nanoscales (ballistic heat transport) [64].
Thermal conductivity enhancement alone
Some researchers have accounted for the increase of the thermal conductivity alone (without providing more information) to account for the observed enhancement of heat transfer [40].
Figure 6 presents the histogram of the proposed mechanisms to explain the anomalous heat transfer for conduction, convection and mixed cases in the litera-ture. The observations from Figure 6 are summarised below and there are three most commonly proposed mechanisms:
a. Brownian motion (33% of the sample)
b. Interfacial layer theory (Kapitza resistance) (22.4% of the sample)
c. A combination of the Brownian motion and the aggregation and diffusion theories (11% of the sample).
PBHT and CHF enhancement studies (40 observa-tions)The proposed mechanisms for the enhancement of PBHT and CHF in the literature are described below.
Deposition of nanoparticles on heating surface The vast majority of researchers assume that, for this heat transfer mode, the use of nanofluids leads to a modification of the heating surface. The alteration pro-motes higher frequency of bubble departure with smal-ler bubble size. At the same time, there is an increased wettability that inhibits the dry patch development on the heating element, leading to increased CHF [57]. Sergis and HardalupasNanoscale Research Letters2011,6:391
http://www.nanoscalereslett.com/content/6/1/391
0.0% 5.0% 10.0% 15.0% 20.0% 25.0% 30.0% 35.0% B ro w ni an Mo tio n In terf acial L ay er T heory (Kapitza R es is tan ce) B ro w ni an M ot io n, A ggr ega ti on and D iffusi on B row ni an Motion ,T herm oph ores is Forces She ar T hi nni ng B eha vi ou r of Fl ow s B ro w ni an M ot io n, E D L T herm al Co nd uc tiv ity En ha ncem en t (alo ne ) B ro w ni an Mo tio n, In terf acial L ay er T heo ry (Kap itza Resistan ce),P ho no n T ran sf er B ro w ni an M ot io n, She ar T hi nni ng B eha vi ou r o f Fl ow s, A ggr eg at io n an d D iffusi on A ggr ega ti on a nd D iffusi on B ro w ni an Mo tio n, In terf acial L ay er T heo ry (Kap itza Resistan ce) B row ni an Motion ,In terf acial L ay er T heory (Kapitza R es is tan ce),A gg reg atio n an d Dif fu si on B ro w ni an Mo tio n, Flatten in g of Velo city P ro file du e to Visco city In terf acial L ay er T heory (Kapitza R es is tan ce),A gg re gation an d D if fu si on ,N ear F iel d R adi at io n Pop u la ti on Prop orti on % (ou t
of 85 ob
servati
on
[image:24.595.59.540.85.628.2]s)
Figure 6Probability function of proposed mechanisms to explain anomalous heat transfer (conduction/convection/mixed mode heat transfer studies).
Sergis and HardalupasNanoscale Research Letters2011,6:391 http://www.nanoscalereslett.com/content/6/1/391
Passive/active mode of heat transfer
The passive mode mechanism suggests that nanoparti-cles provide additional nucleation sides for vapour bub-ble formation and boiling. The active mode mechanism suggests that nanoparticles provide appropriate surface area for converting infrared Radiation into heat. These two modes are suspected to increase the overall heat transfer coefficient of nanofluids [115].
Long range structural disjoining pressure
Confinement of nanoparticles in the meniscus area, supplying liquid to the formation of the vapour bubble at the dry patch, is believed to promote an increased wettability and inhibition of the dry patch development [119]. This leads to increased CHF.
Electrical double layer (EDL) theory
This mechanism was also proposed to explain conduc-tion/convection heat transfer enhancement. It is based on a change of the strength of intermolecular interac-tion forces that modifies the mean free path of the nanoparticles [48].
Thermal conductivity enhancement alone
This mechanism was also proposed to explain conduc-tion/convection heat transfer enhancement. It makes use of the increase of the thermal conductivity alone (with-out providing more information) to account for the observed enhancement of heat transfer [40].
Figure 7 presents the histogram of the proposed mechanisms to explain the anomalous heat transfer for pool boiling and CHF in the literature. The observations from Figure 7 are summarised below and there are two most commonly proposed mechanisms:
a. Alteration of the heating surface due to the deposition of nanoparticles (75% of the sample) b. Passive/active heat transfer mode theory (10% of the sample)
In summary, a general overview of the thermal perfor-mance for each heat transfer mode was presented. It is evident that the vast majority of publications in the lit-erature indicated that nanoparticles are found to aug-ment the heat transfer coefficient of a given basefluid for every mode of heat transfer.
The most popular mechanisms for explaining the anomalous heat transfer were also presented. All of the proposed mechanisms have not been verified experi-mentally and as a result these proposals still remain notions of what is theoretically employed by researchers to explain the phenomena.
Evaluation of trends of specific nanofluids: level 2 analysis
Level 2 of the statistical analysis contains a narrowed down sample of publications. The criterion for selecting
the publications of the secondary group of level 2 was the nanofluid material composition. It was decided to select the nanofluid material consistencies that were most commonly used in the literature. This enables the in-depth comparison between observations recorded from different research groups found in the literature, hence allowing the definition of possible trends linking the thermal performance characteristics of nanofluids with their by part properties (such as consistency, tem-perature of nanofluid, etc). The formation of the sec-ondary group also provides correlation information between the two analysis levels (namely levels 1 and 2) that assists the evaluation of the statistical analysis findings.
Nanofluid types considered (249 observations)
A histogram of nanofluid types employed in the litera-ture was presented in Figure 1 and was considered again here to discover which types have been studied most and, hence, allow the creation of secondary focus groups. The selected sample was narrowed to the fol-lowing nanofluids: Al2O3-water, Al2O3-ethylene glycol (EG), CuO-water and TiO3-water (see Table 10). The processing of the above level 2 analysis sample indicated that the number of publications for the latter two types of nanofluids was too small to obtain conclusions with reasonable statistical significance. Hence, it was decided to consider only the results for the former two nano-fluids (i.e. the Al2O3-water and Al2O3-EG).
Heat transfer characteristics
The statistical analysis 2 of the thermal performance was performed for each heat transfer mode, when the sam-ple was large enough (above 10 observations) to justify the statistical findings. Histograms of this analysis are not presented here, but the findings are summarised below.
a. Heat transfer enhancement via conduction Al2O3 -water nanofluids (41 observations)
Strong evidence of thermal conductivity enhancement is present. Heat transfer enhancement was observed mainly between 5 and 9% (34% of the sample). The var-iation around the 5-9% enhancement regime was small with the majority of the remaining observations in the enhancement range of 10-14% (32% of the sample).
Al2O3-EG nanofluids (11 observations)
Strong evidence of thermal conductivity enhancement is present. Heat transfer enhancement lying between 5 and 9% was similarly observed (36% of the sample). The variation around the 5-9% enhancement range was again small with the majority of the remaining observations in the 10-14% range (27% of the sample).
The findings for the two nanofluids are complimen-tary and in agreement with the findings for all types of nanofluids as obtained from the analysis of level 1 and presented in Figure 2.
Sergis and HardalupasNanoscale Research Letters2011,6:391 http://www.nanoscalereslett.com/content/6/1/391
0.0% 10.0% 20.0% 30.0% 40.0% 50.0% 60.0% 70.0% 80.0%
Dep
os
itio
n o
f NP
s o
n Heatin
g
Su
rf
ace
P
assiv
e/A
ctiv
e m
od
e
of
HT
Lo
ng Ra
nge
St
ru
ct
ur
al
D
isj
oi
ni
ng
P
re
ssur
e
A
ggr
ega
ti
on
and
D
iffusi
on,
T
he
rm
al
Co
nd
uc
ti
vi
ty
E
nha
nc
em
ent
(
al
one
)
B
ro
w
ni
an
Mo
tio
n,
Dep
os
itio
n o
f NP
s
on
Heatin
g Su
rf
ace
EDL
,A
gg
reg
atio
n
an
d Dif
fu
sio
n,Dep
os
itio
n
of
NP
s
on
Heatin
g
Su
rf
ace
Pop
u
lati
on
Prop
orti
on
%
(ou
t
of 40 ob
se
rvati
on
[image:26.595.57.539.88.634.2]s)
Figure 7Probability function of proposed mechanisms to explain anomalous heat transfer (pool boiling heat transfer and CHF heat transfer studies).
Sergis and HardalupasNanoscale Research Letters2011,6:391 http://www.nanoscalereslett.com/content/6/1/391
b. Heat transfer enhancement studies via convection/ mixed heat transfer mode (91 observations) Al2O3 -water nanofluids (36 observations)
There is strong evidence of heat transfer enhancement with most publications indicating an unspecified value of enhancement (39% of the sample).
Al2O3-EG nanofluids (11 observations)
Strong evidence of heat transfer enhancement is pre-sent. Most observations indicate an enhancement between 1-4% and 10-14% (27% of the sample for each range). The spread is small with all results indicating an enhancement around the 1-19% enhancement range.
It should be noted that the findings for the two nano-fluids is in agreement with the findings of analysis level 1, as presented in Figure 3.
Proposed physical mechanism for anomalous heat transfer
a. Conduction/convection/mixed mode heat transfer studies Al2O3-water nanofluids (29 observations)
a. Brownian motion (28% of the sample)
b. Brownian motion combined with the aggregation and diffusion theory (28% of the sample)
c. Interfacial layer theory (Kapitza resistance) (17% of the sample)
Al2O3-EG nanofluids (13 observations)
a. Brownian motion (85% of the sample)
b. Interfacial layer theory (Kapitza resistance) (15% of the sample).
The most popular proposed mechanism is the Brow-nian motion of the nanoparticles. This is in agreement with the findings of level 1 analysis presented in Figure 6. Some differences exist for the second and third most popular mechanisms, but both are the same as for the level 1 analysis.
b. PBHT and CHF (12 observations) The sample for the Al2O3-EG nanofluids was too small to give a cred-ible statistical result. Hence, only the Al2O3-water nano-fluid sample is presented. The most popular proposed mechanisms are:
a. Alteration of the heating surface due to deposition of nanoparticles (83.3% of the sample)
b. Brownian motion combined with the alteration of the heating surface due to deposition of nanoparti-cles (8.33% of the sample)
c. Deposition and aggregation theory combined with the diffusion and thermal conductivity (alone) (8.33% of the sample).
The alteration of the heating surface by the deposition of nanoparticles is the most popular proposed
mechanism for the explanation of enhanced PBHT and CHF. This is in agreement with the findings of Level 1 analysis presented in Figure 7.
Scatter diagrams based on level 2 analysis: indication of trendsLevel 2 analysis allowed the formation of var-ious scatter diagrams and two of the most representative diagrams are selected and can be seen in Figures 8 and 9. Figure 8 presents the effect of nanoparticle concentra-tion and size on conducting heat transfer for Al2O3 -water nanofluids. Figure 9 shows the effect of nanoparti-cle concentration and size on the viscosity of the mix-ture for Al2O3-water nanofluids. The scatter diagram analysis provided vital information on the links between nanofluids parameters and their thermal performance. The following trends were derived:
a. The level of enhancement for the purely conduc-tive case indicated an increasing trend with increas-ing nanofluid temperature and nanoparticle concentration, while there is a slight hint of the enhancement increasing with nanoparticle size (see Figure 8).
b. The effective viscosity of the mixture is enhanced and the findings show an increasing trend with decreasing fluid temperature, increasing volumetric concentration. There is also a slight hint of an effec-tive viscosity increase with decreasing nanoparticle size (see Figure 9).
c. The level of enhancement for the convection/ mixed heat transfer mode indicated an increasing trend with increasing temperature, volumetric con-centration and decreasing nanoparticle size.
Unfortunately, this trend can only be deduced by tak-ing account the entire sample of scatter diagrams pro-duced hence there is not a single representative diagram to display supporting it (contrary to the conductive and viscosity enhancement trends considered).
The trends appear to hold true up to the level where the nanofluid defining qualities (regarding particle sus-pension and chemical consistency properties as listed in Characteristics of nanofluids section) are still satisfied and the nanoparticle concentrations remain in between the boundaries set in the methodology of observation collection (0.0001-10 vol.%). It should be noted that the observed trends cannot be quantified to evaluate the contribution of each by part property of the nanofluids. The observed trends will be discussed in the next subsection.
Unfortunately, the sample size was not large enough to extract trends regarding PBHT and CHF. Moreover, due to sample size limitation it was also impossible to determine nanoparticle material effects on thermal per-formance characteristics.
Sergis and HardalupasNanoscale Research Letters2011,6:391 http://www.nanoscalereslett.com/content/6/1/391
Discussion of findings from level 2 analysis The ther-mal performance assessment study of the second level agrees to a large degree with the findings of the first level. The cross correlation between the two levels ensures that the narrowed sample still falls into the reliability limits of the study.
The heat transfer enhancement studies for the Al2O3 -water/EG generally indicated strong enhancement for
the conduction and convection/mixed modes. More spe-cifically, for the conduction heat transfer enhancement, the two nanofluids performed the same. For the convec-tion/mixed heat transfer mode, the results for the two nanofluids do not correlate to the same level of enhancement.
For the statistically most popular proposed mechanism to explain the anomalous heat transfer. Both types of 1.00
1.05 1.10 1.15 1.20 1.25 1.30
0.00 50.00 100.00 150.00 200.00 250.00
E
n
h
an
cem
en
t
Nanoparticle Size/ nm
1.00 2.00 3.00 4.00 5.00 10.00
[image:28.595.59.537.86.586.2]ĭ
Figure 8Sample of one of the scatter diagrams used to extract the trends. The diagram depicts various results of conductive heat transfer enhancement for the Al2O3-water type nanofluid at various concentrations (F) and at a temperature range of 290-310 K.
Sergis and HardalupasNanoscale Research Letters2011,6:391 http://www.nanoscalereslett.com/content/6/1/391
nanofluids agree on the Brownian motion of nanoparti-cles being most popular mechanism to explain the phe-nomena while small deviations appear regarding the secondary and third most popular mechanisms.
In the light of this evidence, it can be concluded that the narrowing of the sample to perform the second level of the analysis can still be accounted creditable, as it generally agrees with the findings from the overall
sample of level 1. The findings regarding the thermal performance indicate that the basefluid material has little influence on the heat transfer enhancement in the conduction mode. On the contrary, the basefluid material seems to affect the performance for the con-vection/mixed heat transfer mode as discrepancies on the performance studies for the two materials were observed.
0.00 1.00 2.00 3.00 4.00 5.00 6.00
0.00 20.00 40.00 60.00 80.00 100.00 120.00 140.00 160.00 180.00
Enhancement
Nanoparticle Size/ nm
1.00
1.80
2.00
3.00
4.00
5.00
6.00
9.00
10.00
[image:29.595.60.538.87.587.2]ĭ
Figure 9Sample of one of the scatter diagrams used to extract the trends. The diagram depicts various results of viscosity enhancement for the Al2O3-water type nanofluid at various concentrations (F) and at a temperature range of 290-310 K.
Sergis and HardalupasNanoscale Research Letters2011,6:391 http://www.nanoscalereslett.com/content/6/1/391