R E S E A R C H
Open Access
Cardiovascular magnetic resonance
compatible physical model of the left
ventricle for multi-modality characterization
of wall motion and hemodynamics
Ikechukwu U. Okafor
1†, Arvind Santhanakrishnan
2†, Brandon D. Chaffins
3, Lucia Mirabella
3, John N. Oshinski
3,4and Ajit P. Yoganathan
1,3*Abstract
Background:The development of clinically applicable fluid-structure interaction (FSI) models of the left heart is inherently challenging when usingin vivocardiovascular magnetic resonance (CMR) data for validation, due to the lack of a well-controlled system where detailed measurements of the ventricular wall motion and flow field are availablea priori. The purpose of this study was to (a) develop a clinically relevant, CMR-compatible left heart physical model; and (b) compare the left ventricular (LV) volume reconstructions and hemodynamic data obtained using CMR to laboratory-based experimental modalities.
Methods:The LV was constructed from optically clear flexible silicone rubber. The geometry was based off a healthy patient’s LV geometry during peak systole. The LV phantom was attached to a left heart simulator consisting of an aorta, atrium, and systemic resistance and compliance elements. Experiments were conducted for heart rate of 70 bpm. Wall motion measurements were obtained using high speed stereo-photogrammetry (SP) and cine-CMR, while flow field measurements were obtained using digital particle image velocimetry (DPIV) and phase-contrast magnetic resonance (PC-CMR).
Results:The model reproduced physiologically accurate hemodynamics (aortic pressure = 120/80 mmHg; cardiac output = 3.5 L/min). DPIV and PC-CMR results of the center plane flow within the ventricle matched, both qualitatively and quantitatively, with flow from the atrium into the LV having a velocity of about 1.15 m/s for both modalities. The normalized LV volume through the cardiac cycle computed from CMR data matched closely to that from SP. The mean difference between CMR and SP was 5.5 ± 3.7 %.
Conclusions:The model presented here can thus be used for the purposes of: (a) acquiring CMR data for validation of FSI simulations, (b) determining accuracy of cine-CMR reconstruction methods, and (c) conducting investigations of the effects of altering anatomical variables on LV function under normal and disease conditions.
Keywords:Cardiovascular magnetic resonance, Left ventricle phantom, MR segmentation, MR reconstruction, MR validation, Particle image velocimetry, Stereo-photogrammetry, FSI validation
* Correspondence:ajit.yoganathan@bme.gatech.edu
†Equal contributors
1School of Chemical & Biomolecular Engineering, Georgia Institute of Technology, Atlanta, GA, USA
3Wallace H. Coulter Department of Biomedical Engineering, Georgia Institute of Technology and Emory University, Atlanta, GA, USA
Full list of author information is available at the end of the article
Background
Heart failure is a significant problem in the western world and is present in over 2 % of the adult population over the age of 65 [1]. Left Ventricle (LV) structural abnormalities (e.g., dilated cardiomyopathy [2]), valvular pathologies (e.g., aortic stenosis), abnormalities in electrical conduction (e.g., LV dyssynchrony), and hypertension can act as some of the causative agents of heart failure. Challenges with timely diag-nosis of heart failure exist when using traditional clinical metrics, as is the case in diastolic heart failure with preserved ejection fraction [3]. Detailed studies examining the complex mechanical interactions between the various anatomical structures (left atrium, LV, aorta, and corresponding valves) on the pumping function are thus needed at the isolated structural levels and collective organ level. Such investiga-tions can aid in improving clinical outcomes by identifying more accurate diagnostic measures for earlier intervention, as well as in optimizing treatment optionsa priori.
From a physiological standpoint, several recent studies using clinical data [2, 4–11],in vitromodels [12–18], and computational simulations [16, 19–27] have pointed to the importance of examining intra-ventricular fluid dynamics for potential use as a diagnostic metric of cardiac health. In-tricately coupled to the intra-ventricular fluid flow are the wall motion of the LV and valvular kinematics, which can be affected across multiple pathological conditions observed in heart failure patients [2, 9]. From a clinical perspective, the use of non-invasive medical imaging techniques (including cardiovascular magnetic resonance (CMR) [4, 6, 8, 11] and echocardiography [2, 7, 9, 10]) monitor and detect of abnormalities in ventricular wall mo-tion, valve operamo-tion, and intra-ventricular flow patterns. The data obtained from these non-invasive techniques can also be used in computational models [21, 23, 24, 28] in order to provide patient specific treatment options.
The main obstacles to obtaining high-resolution in vivo medical imaging data from volunteers and patients are high operational costs and the length of the scan time [29]. It must be noted that the accuracy of cine CMR reconstruc-tion (which is affected by the spatial and temporal resolureconstruc-tion of the acquisition) is of foremost importance when provided as input data for FSI methods. As a result, the techniques used in the reconstruction of cine CMR and phase-contrast CMR (PC-CMR) data for LV wall motion and flow fields, re-spectively, need to be validated. In this regard, the use ofin vitroplatforms can provide a more straightforward, control-lable means of obtaining high-resolution experimental data to use in the testing, development, and validation of imaging-based cardiac FSI and CFD models [30, 31].
The research efforts presented in this paper specifically address the need for versatile in vitroexperimental model of the LV that can be used to obtain data across multiple modalities available across bench-top and clinical practice, so as to compare the relative accuracies of the
modalities and for eventual use in providing data for validation of FSI models of the left heart. The specific goals of the study presented herein were to: (a) develop an in vitro left heart simulator using a flexible-walled LV physical model that is CMR compatible, and (b) compare the LV volume reconstructions from cine steady-state free precession (SSFP) to laboratory values obtained from high-speed stereo-photogrammetry (SP) and (c) compare the LV hemodynamics from PC-CMR to laboratory values obtained from particle image velo-cimetry (DPIV) and flow probes (FP). These sets of in-formation will allow for the downstream application of thein vitromodel in providing CMR data for validation of FSI simulations as well as in comparing the relative accuracies of reconstruction methods used to process anatomical CMR images.
Methods
LV physical model
Design and construction
The left ventricular geometry was generated in Solid-worksTM (Dassault Systèmes Solidworks Corporation, Waltham, MA, USA) by constructing a series of concen-tric ellipses that were fit to LV endocardial borders traced on 5 cine steady-state free procession (SSFP), short axis slices at peak systolic phase of the cardiac cycle acquired in a healthy subject’s (Fig. 1). A 125° cut was made at the base of the ventricle such that the mitral and aortic annu-lar planes matchedin vivoconditions [32]. The design was sent to a third party company (VenAir, Terrassa, Spain) for tool building and casting. Silicone, with a shore hard-ness of 42A and a thickhard-ness of 0.159 cm, was used as the material for the ventricle casting. This hardness was chosen to provide the flexibility and durability needed for pumping function, while simultaneously to allow optical access for flow visualization inside the ventricle. The pa-tient data collected for the construction of the LV was ap-proved by the institutional review board (IRB# H09236).
Flow loop setup
motion in turn generates pulsatile fluid flow into and out of the ventricle through the valves. Absolute pressures were measured at the atrial, ventricular, and aortic posi-tions using pressure transducers (Utah Medical Products Inc., Midvale, UT). Volumetric flow rates into and out of the ventricle were measured using ultrasonic flow probes (Transonic Systems Inc., Ithaca, NY). However, it should be noted that during the CMR experiments, the flow probes were replaced with rigid pipes of the same length and internal diameter of the probes. The ventricular wall motion was studied under physiologic hemodynamic con-ditions (120/80 mmHg systemic pressure, 3.5 L/min aver-age cardiac output at a heart rate of 70 beats/min).
Stereo photogrammetry
Experimental setup of high-speed cameras
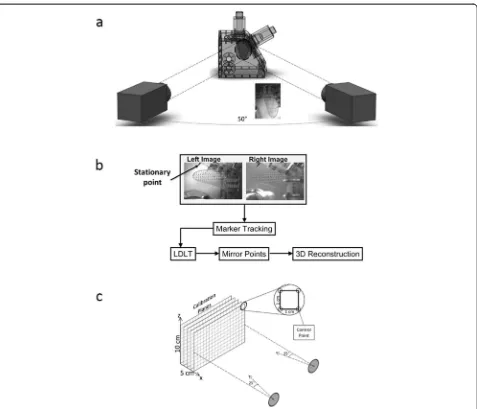
To assess wall motion in the laboratory, dual camera stereo-photogrammetry was performed using two
high-speed monochromatic cameras (Model A504K, Basler Vision Technologies, Exton, PA; 1280 × 1024 pixels) with Nikon macro lenses (60 mm, f2.8; Nikon, Melville, NY). A grid of circular markers, with a 4 mm by 4 mm discretization, was printed on one side of the outer sur-face of the ventricle. Each of the markers was approxi-mately 2 mm in diameter, Fig. 3(a). During experiments, the cameras were externally triggered at the same time as the pulse duplicator system to synchronize the cam-era images with the hemodynamic (pressures and flow rates) acquisition. 214 time points were acquired during a cardiac cycle for a total of 15 cycles. The 15 cycles of data for each tracked marker point were ensemble aver-aged to give one cycle.
Calibration
[image:3.595.63.538.90.474.2]method (LDLT) [33]. For the calibration, the acrylic cham-ber that housed the LV was filled with the same 36 % by volume water-glycerin solution. As shown in Fig. 3(c), a sheet with a 1 cm grid was placed inside the chamber and traversed in the x-direction until the volume occupied by the ventricle was covered. The cameras were positioned such that all control points in the volume occupied by the ventricle could be captured.
Reconstruction of volume
A pin (see Fig. 3(b) served as a stationary point in the field of view of both cameras, around which the reconstructed points were mirrored. This allowed for the generation of the LV volume under the assumption that the LV contrac-tion and relaxacontrac-tion was symmetric along the long axis of the left-ventricular outflow tract center plane. A surface was then fit to the points at each time point using Geoma-gic 3D Software (Geosystems, Rockhill SC). The surfaces were then imported into Paraview (Kitware, Clifton Park NY) where the volumes were extracted.
Digital Particle Image Velocimetry (DPIV)
Experimental setup
To assess hemodynamics in the laboratory, DPIV was used to quantitatively visualize the flow patterns through
a long axis plane of the ventricle corresponding to a 2-chamber long-axis view. Figure 4 shows the schematic of the DPIV set up. The BMHV used in the mitral pos-ition was located upstream of the mitral annulus, com-pared to the placement at the level of the mitral annulus in experiments using other experimental modalities. This change in mitral valve location for DPIV experi-ments was done to examine the flow through the mitral orifice without including the leaflets. This allowed us to compare to in vivo flow fields from previous studies without being affected by the flow through the “ three-jet”orifice characteristic of the SJM Regent BMHV de-sign. This change in mitral valve placement was the only difference in the setup of the LV model between DPIV and all other experimental modalities used in this study. The area of the valveless mitral annulus was 3.0 cm2. The fluid inside the ventricle was seeded with neutrally buoyant fluorescent particles (PMMA with RhB dye, 1–20 lm, Dantec Dynamics; Denmark) and was illumi-nated using a dual pulsed, 1 mm thick, laser light sheet (Nd:YAG lasers, 17 mJ/pulse, 532 nm, ESI Inc.; Portland, OR). The particles were imaged using a Nikon Micro-Nikkor 60 mm lens attached to a CCD camera (Imager Pro X 2 M, LaVision, Germany, Imager Pro, 1600 × 1200 pixels).
[image:4.595.58.543.89.366.2]Fig. 4Experimental setup of camera, laser and optics used for conducting DPIV measurements on the LV physical model. The laser beam was routed to a plano-convex lens for focusing purpose, followed by a cylindrical lens for generating a light sheet. An arrangement of three mirrors was used for routing the laser beam through the lenses and reflecting the light sheet onto the LV physical model.
[image:5.595.61.538.86.495.2] [image:5.595.62.539.530.694.2]Phase-locked DPIV images were acquired for 34 time points in the cardiac cycle, each spaced by 25 ms. The mean flow field for each phase point in the cardiac cycle was computed via ensemble averaging of 200 instantan-eous DPIV image pairs acquired from 200 cardiac cycles. The time spacing between image pairs (dt) was in the range of 800–1200μs across all the phase points in the cardiac cycle, where the phase-specific dt value was se-lected to allow 5–8 pixels of particle displacement.
Processing
The images were preprocessed in DaVis 7.2 (LaVision, Germany) by performing a sliding background subtrac-tion of a scale length of 5 pixels. Particle cross correl-ation was performed on the images using dual-pass interrogation with decreasing window size (64 × 64 to 32 × 32 pixels; 50 % overlap). Vectors were deleted if peak ratio, Q, was less than 1.2; interpolation was per-formed to fill up all empty spaces.
CMR
Cine-SSFP for LV motion
The heart model was examined on a 3 T Siemens scanner to evaluate LV wall motion. Contiguous short axis images slices were acquired using a cine balanced steady-state free precession (SSFP) sequence. A six-element phase array body coil along with elements from the spine coil built into the table. The acquisition sequence was retrospect-ively ECG-gated using an external TTL pulse sent to an ECG-pulse conversion box which triggered the CMR
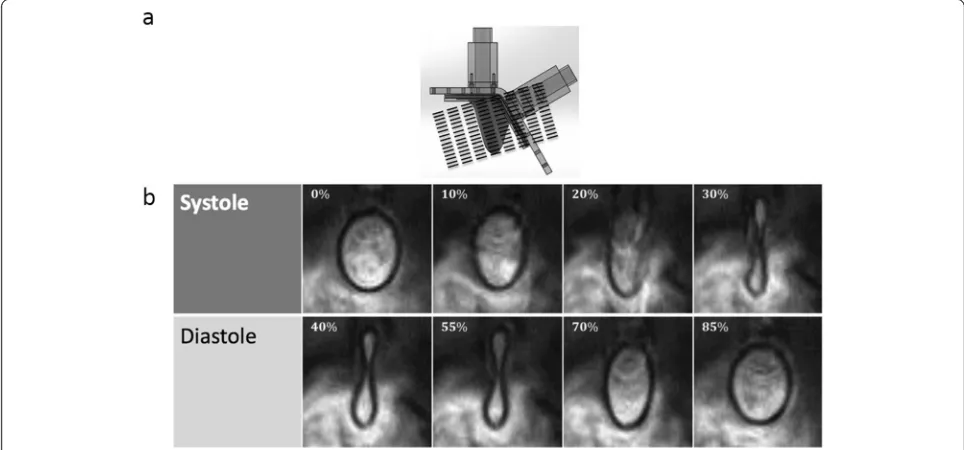
scanner through the ECG gating module. An acceleration factor of 2 was used using the GRAPPA technique. The SSFP cine images were acquired with an in-plane reso-lution of 1.2 by 1.2 mm, a slice thickness of 6 mm, and a reconstructed temporal resolution of 7 ms (128 frames/ cycle). Two signal averages were acquired resulting in an acquisition time of 3:28 seconds per slice for the PC-CMR sequence. TE (echo time) = 3.3 milliseconds. Two seg-ments were acquired per cardiac phase per heartbeat, yielding an effect TR (temporal resolution) of 24 millisec-onds. To cover the entire LV, 15 slices were acquired with no gap. Figure 5a shows the orientation at which the slices were acquired.
Image segmentation
Using a region based active contour model developed by Wang et al. [34], the LV geometry at every phase was segmented from the short axis cine MR images. Point clouds were extracted from the binary images generated from segmentation and surface fit to them and smoothed using the ‘relax’feature on Geomagic 3D Software (Geo-systems, Rockhill SC). The internal volumes of the LV were calculated in MATLAB (MathWorks, Natick MA) by multiplying the areas of the binary images with the corresponding slice thickness.
Phase contrast magnetic resonance (PC-CMR)
Mitral and aortic valve flows were acquired using 2D PC-CMR sequence, encoding a single velocity direction (through plane). An acquisition using in plane velocity
[image:6.595.56.538.460.685.2](2 directions) was performed in order to extract the 2D velocity field of the left ventricular outflow tract (LVOT) plane. The imaging planes that were acquired is shown in Fig. 6. The PC-CMR sequence used was a retrospectively ECG-gated gradient echo sequence with a slice thickness of 6 mm and the velocity encoding was 150 cm/s. 20 phases were acquired through the cardiac cycle at each position. A spline interpolation was performed using the inbuilt MATLAB (MathWorks, Natick MA) function in order to match the discretization of the PC-CMR data with that of the flow probes.
Volume reconstruction comparison
PC-CMR and flow probes are similar modalities in that they provide flow (volume/time) information across the mitral and aortic valves as a function of time. The
volume within the LV at each time instant was thus cal-culated using Equation 1 below:
V tð Þ ¼ Vchangeþconstant ¼
Zt
0
dV dt
LV
dt¼
Zt
0
dV dt
AV
−dV dt
M V
" #
dt
ð1Þ
where LV, AV, MV, and t are the left ventricle, aortic valve, mitral valve, and time of cardiac cycle, respect-ively. The value of ‘constant’is the end systolic volume of the LV, which was obtained from either the CMR or SP experiments.
For the SP and CMR modalities, the reconstructions directly provide the instantaneous volumes at each time instant. The volumes were normalized by their respective local maxima such that a one-to-one comparison between modalities could be conducted. In this study, normalized volume was denoted as V tð Þ. The normalized volumes through the LV from SP and CMR were compared to equivalent values obtained using flow probes and PC-CMR, via calculation of the absolute value of the relative difference inV tð Þ between modalities.
Results
Ventricular wall motion
Figure 5 shows the CMR images obtained at multiple time points during the cardiac cycle. At some time points (total of 7) during the early diastolic and peak systolic period of the cardiac cycle, there was blurring of the LV wall in the images; hence, segmentation was not possible. The rest of the phases (~95 %) were recon-structed to produce 3D volumes of the ventricle through time. The maximum and minimum volumes of the LV through this method were found to be 65 and 31 mL re-spectively, giving an ejection fraction of 52.3 %.
Due to the high temporal frequency of stereo-photogrammetry, none of the phases acquired experi-enced the same blurring issue as was found with CMR. Only half of the ventricle wall was imaged and centerline symmetry was assumed such that the marker points were mirrored across a stationary pin located at the line of symmetry to generate the 3D volume. The maximum and minimum volumes of the LV through the SP method were found to be 62 and 33 mL respectively, giving an ejection fraction of 46.8 %.
Intra-ventricular flow field
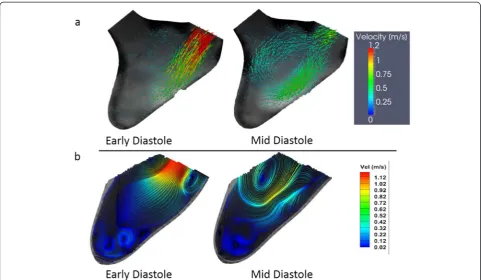
DPIV was performed on the central long-axis plane of the LV. Figure 7 shows the velocity field from PC-CMR (a) and DPIV (b) of two representative time points dur-ing diastole (early and mid-diastole in the cardiac cycle). In both DPIV and PC-CMR velocity fields there was a single central jet is shown from the atrium into the LV Fig. 6Locations of the planes (relative to the LV physical model)
[image:7.595.56.291.292.664.2]with a velocity of about 1.15 m/s. In the DPIV velocity field reconstruction, two counter rotating vortices are observed in the flow field, advecting ahead of the trailing jet. The far field velocity magnitudes are comparatively lower due to lack of mixing with the apical flow, which was expected as the time point is in early vortex ring propagation stage [10, 20]. In PC-CMR velocity field reconstruction, the magnitudes of velocities observed are similar to DPIV both in the early and mid-diastolic phase of the cardiac cycle (Fig. 7). The overall flow structure observed was similar between two modalities; however, the two counter rotating vortices formed dur-ing diastole were not well resolved in PC-CMR. This could be due to the relative coarser resolution of PC-CMR. The resolution of DPIV was much greater, hence, it is able to resolve much finer flow structures.
Hemodynamics
Figure 8 compares the flow curves obtained during stereo-photogrammetry experiments via flow probes to those obtained during PC-CMR experiments. The flow curves obtained from the flow probes were averaged over 15 cardiac cycles. From the PC-CMR experiments, at the aortic plane, the peak aortic flow rate obtained was 20 L/min and the peak mitral flow rate was 17.5 L/ min. The overall magnitudes of the flow rates between the FP and PC-CMR were similar, with the cardiac
outputs for both modalities averaging at 3.5 L/min. The PC-CMR flow curves showed slight mitral and aortic regurgitation.
Volume comparison: CMR and stereo-photogrammetry
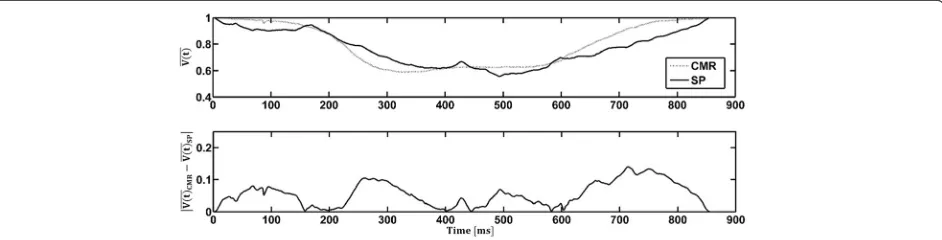
Flow probes and PC-CMR were used to acquire flow measurements into and out of the LV. The volume of the ventricle as a function of time was calculated from each of these modalities and was compared to the values obtained from SP and CMR respectively (Fig. 9). It was found that the average discrepancy (across the cardiac cycle) between SP and the flow probes was 5.9 ± 4.1 % while that between CMR and PC-CMR was found to be 8 ± 6 %. Figure 10 compares the normalized volume of the LV calculated from CMR and SP. The qualitative trends through the cardiac cycle were similar. The mean discrepancy between CMR and SP was 5.5 ± 3.7 % while the largest discrepancy throughout the entire cardiac cycle was approximately 14 %, occurring during peak diastole and peak systole.
Discussion
[image:8.595.57.539.88.368.2]acquired using modalities available at the laboratory level, and (b) acquiring ventricular wall motion using CMR se-quences for use as initial conditions in LV FSI models, in order to validate the predictive accuracy of the simulations through comparison with CMR-based flow field data.
Though a considerable number of experimental studies have usedin vitroLV models [12–18, 35], no study to date has used such a platform to provide a one-to-one link be-tween data obtained using laboratory-level experimental modalities (which are of higher fidelity and accuracy) and Fig. 8Mitral and aortic flow rates obtained via FP during the stereo-photogrammetry (SP) as well as the flow curves from PC-CMR acquisition on the LV physical model.
Fig. 9Comparison of the normalized volumeðV tð ÞÞthrough the LV, as a function of the cardiac cycle time, between (a) cardiac magnetic resonanceð ÞVðtCMRÞand phase contrast cardiac magnetic resonanceðV tð ÞPCMRÞ;and (b) stereo-photogrammetryðV tð ÞSPÞand inline flow probes
ðV tð Þ
[image:9.595.55.540.88.300.2] [image:9.595.56.538.421.692.2]CMR. Furthermore, no study has examined validation of reconstruction methods used to characterize LV wall mo-tion from CMR data. These two aspects are specifically important when consideringin vitroplatforms for validat-ing LV FSI models that use CMR data as an input for sim-ulations. The study presented in this paper presents the first step in these important directions, with the ultimate objective of translating computational models of the left heart to use in clinical practice and patient-specific plan-ning of therapeutic and surgical interventions.
We have shown that the novel CMR-compatible LV physical model developed in this paper is able to closely simulate the physiological hemodynamic environment of the LV. By adjusting the systemic resistance and compli-ance elements in the flow loop, we have demonstrated the capability of the LV physical model to match physio-logical flow rates through the MV and AV, and aortic and ventricular pressures. The intra-ventricular flow field observed within the LV physical model using planar DPIV showed the formation of a counter-rotating vortex ring structure with a trailing jet. This flow pattern quali-tatively matches with previous in vivo results based on flow fields obtained from CMR [4, 6, 8, 11] and echocar-diographic [7, 9, 10] data in healthy volunteers.
The motion of markers embedded on the LV model was tracked using SP and 3D wall motion was recon-structed for the entire cardiac cycle, and this representa-tion was compared to CMR-data based reconstrucrepresenta-tion of ventricular wall motion. The normalized volume of the LV was used as the metric of comparison between SP, CMR, bulk hemodynamic data obtained from the flow probes and PC-CMR modalities. The comparisons demonstrated good agreement between the multiple mo-dalities (less than 9 % average difference in normalized volume between SP and CMR) in characterizing the wall motion, thus validating the CMR motion reconstruction method employed in this study.
To understand the reasons for mismatch between SP and CMR reconstruction results, it is instructive to
consider the different sources of error between SP and CMR motion reconstruction. SP relies on tracking the pixel location of markers and constructing point clouds of the geometry in time. The calibration method used for SP can affect the accuracy of the linear mapping between object-space coordinates and image-plane coordinates. The LDLT method, which discretizes the control volume of the calibration space into smaller volumes [33, 36], was used in this study to minimize nonlinearities in the refracted point coordinates due to imaging through mul-tiple fluid media (air-acrylic-water/glycerin). However, any mismatch between the positions of the SP calibration acrylic tank and the LV chamber can result in calibration errors. We ensured that this mismatch was minimized during SP experiments via placing the calibration tank and LV chamber within identical constraining brackets.
For the case of anatomical CMR measurements, blurring of the LV model wall close to the start of diastole as well as peak systole was observed, mainly due to insufficient tem-poral resolution. We employed a modified intensity-based edge detection algorithm [34] for segmentation of anatom-ical images, and these methods typanatom-ically encounter diffi-culty in following the tracked boundary accurately due to heterogeneities in intensity values near the edge. As a re-sult, this resulted in ambiguity in identifying the border during segmentation of some of the cardiac phases where blurring was clearly observed. These factors can contribute to the mismatch of CMR-based volume values when com-pared to SP and flow probe based calculations. The mean error between the values of normalized volume determined using CMR and SP modalities was 5.5 ± 3.7 %, thus demonstrating a reasonable matching considering all the above sources of error. The largest errors between these two modalities were on the order of ~13 %. This was most likely due to the fact that only 20 phases/cycle of PC-CMR data was used to reconstruct the volume into and out of the LV.
[image:10.595.66.537.90.210.2]the CMR-compatible in vitro platform allows for con-ducting controlled studies to compare accuracies of the various post-processing methods used to reconstruct anatomical motion from CMR-data. Such a validation is critical for determining the accuracies of CMR recon-struction methods [28], which in turn are used to pro-vide wall motion input data for computational models [16, 21, 24, 37]. Simultaneously, this model provides CMR scientists with a flexible platform to develop and test various CMR sequences to improve spatiotemporal resolution, while optimizing for the minimal time re-quired for scans.
A number of limitations should be considered while interpreting the results of this study. Though the hemodynamic environment of the simulator was tuned to mimic physiological values, the actual wall motion of the LV model and LV stiffness were not matched to exactly mimic in vivoLV wall motion. The anterior and inferior walls of the LV model contracted to a greater extent as compared to the lateral and septal walls. These uneven contractions lead to greater acceleration of the anterior and posterior walls to an extent that CMR protocol used was not able to capture the wall at its highest velocity, resulting in blurred images. These limi-tations are chiefly attributed to the elastomeric material used for the model design. However, the comparisons between modalities presented here are relative to each other, and therefore will not be impacted by any concerns of imprecise matching to physiological LV wall motion. Future studies will focus on material optimization for obtaining more physiologically realistic wall motion. The biphasic flow of LV filling was not modeled in order to simplify the motion of the LV wall. Similarly, because this was a comparative study, the results reported in this work will not be impacted by this limitation. Only 20 phases/ cycle were obtained for the PC-CMR acquisition. This relatively low temporal resolution could be another source of the larger discrepancies when this modality was com-pared to its counterparts. Finally, this work was not intended for the extensive comparisons between flow fields derived from PC-CMR and DPIV; the comparisons presented here was only used to show that PC-CMR was able to capture the bulk flow structures within the LV.
Conclusions
In conclusion, the CMR-compatible in vitro model de-veloped in this study allows for systematic comparison between laboratory and clinical imaging modalities. It has been used to compare the normalized volume be-tween the CMR and SP modality. This model can also be used as a test-bed for the optimization and validation of new CMR sequences. Additionally, the versatility of the LV model is further enhanced due to its modular design. It is possible to use this model to characterize
hemodynamic consequences due to the alteration of anatomical variables (valvular and ventricular: for ex-ample, LV wall stiffness, aortic/mitral valve insufficiency or stenosis, etc.). Also, the use of a programmable piston pump to drive ventricular wall motion allows for varying heart rates and heart rate regularities to be set. All these variables enable the LV model provide a physical under-standing of structural heart disease and valvular/patho-logical conditions affecting cardiac function, in order to identify novel diagnostic indices and potential target variables to monitor during treatment.
Competing interests
The authors declare that they have no competing interests.
Authors’contribution
IO: Participated in the design and construction of the LV model. Participated in CMR acquisition and data analysis. Performed stereo photogrammetry experiments and data analysis. Involved in the interpretation of all data. Involved in writing of manuscript. AS: Participated in the design and construction of the LV model. Participated in CMR acquisition and data analysis. Performed stereo photogrammetry experiments and data analysis. Involved in the interpretation of all data. Involved in writing of manuscript. BC: Participated in the design and construction of the LV model. Participated in CMR acquisition and data acquisition. Performed stereo photogrammetry experiments and data analysis. Critically revised manuscript. Gave final approval for manuscript publishing. LM: Participated in CMR acquisition and data analysis. Interpreted CMR data. Critically revised manuscript. Gave final approval for manuscript publishing. JO: Involved in conception of experimental idea and design. Performed in CMR acquisition. Involved in the interpretation of all data. Critically revised manuscript. Gave final approval for manuscript publishing. AY: Involved in conception of experimental idea and design. Involved in the interpretation of all data. Critically revised manuscript. Gave final approval for manuscript publishing. All authors read and approved the final manuscript.
Authors’information
This work was conducted at the CFM Lab Georgia Tech & Emory, while the authors (Arvind Santhanakrishnan and Lucia Mirabella) were post-doctoral fellows.
Acknowledgements
This study was funded by a grant from the National Heart, Lung and Blood Institute (RO1HL07262). The authors would like to thank Stephanie Clement-Guinaudeau (Department of Radiology, Emory University School of Medicine) and Michael Larche (Center for Systems Imaging, Wesley Woods Health Center, Emory University School of Medicine) for their technical assistance with the CMR experiments. The authors would also like to thank Procter & Gamble for providing the glycerin and VenAir (Terrassa, Spain) for the casting of the LV models used in this study.
Author details
1School of Chemical & Biomolecular Engineering, Georgia Institute of Technology, Atlanta, GA, USA.2School of Mechanical & Aerospace Engineering, Oklahoma State University, Stillwater, OK, USA.3Wallace H. Coulter Department of Biomedical Engineering, Georgia Institute of Technology and Emory University, Atlanta, GA, USA.4Department of Radiology and Imaging Sciences, School of Medicine, Emory University, Atlanta, GA, USA.
Received: 24 January 2015 Accepted: 10 June 2015
References
1. McMurray JJ V, Pfeffer MA. Heart failure. Lancet [Internet]. 2005;365:1877–89. doi:10.1016/S0140-6736(05)66621-4.
quantification of left ventricular blood vorticity pattern. J Am Soc Echocardiogr [Internet]. 2010;23:86–94. doi:10.1016/j.echo.2009.09.007. 3. Gaasch WH, Zile MR. Left ventricular diastolic dysfunction and diastolic heart
failure. Annu Rev Med [Internet]. 2004;55:373–94. doi:10.1146/annurev.med. 55.091902.104417.
4. Bolger AF, Heiberg E, Karlsson M, Wigstr L, Watt W, Medicine C. Transit of Blood Flow Through the Human Left Ventricle Mapped by Cardiovascular Magnetic. 2007:741–747. doi:10.1080/10976640701544530.
5. Carlhäll CJ, Bolger A. Passing strange: flow in the failing ventricle. Circ Heart Fail [Internet]. 2010;3:326–31. doi:10.1161/CIRCHEARTFAILURE.109.911867. 6. Eriksson J, Dyverfeldt P, Engvall J, Bolger AF, Ebbers T, Carlhäll CJ.
Quantification of presystolic blood flow organization and energetics in the human left ventricle. Am J Physiol Heart Circ Physiol [Internet].
2011;300:H2135–41. doi:10.1152/ajpheart.00993.2010.
7. Hong G-R, Pedrizzetti G, Tonti G, et al. Characterization and quantification of vortex flow in the human left ventricle by contrast echocardiography using vector particle image velocimetry. JACC Cardiovasc Imaging [Internet]. 2008;1:705–17. doi:10.1016/j.jcmg.2008.06.008.
8. Kim WY, Walker PG, Pedersen EM, Poulsen JK, Oyre S, Houlind K, et al. Left ventricular blood flow patterns in normal subjects: A quantitative analysis by three-dimensional magnetic resonance velocity mapping. J Am Coll Cardiol [Internet]. 1995;26:224–38. doi:10.1016/0735-1097(95)00141-L. 9. Poh KK, Lee LC, Shen L, Chong E, Tan YL, Chai P, et al. Left ventricular fluid
dynamics in heart failure: echocardiographic measurement and utilities of vortex formation time. Eur Heart J Cardiovasc Imaging [Internet]. 2012;13:385–93. doi:10.1093/ejechocard/jer288.
10. Rodevand O, Bjornerheim R, Edvardsen T, Smiseth O. a, Ihlen H. Diastolic flow pattern in the normal left ventricle. J Am Soc Echocardiogr [Internet]. 1999;12:500–7.
11. Wigström L, Ebbers T, Fyrenius A, Karlsson M, Engvall J, Wranne B, et al. Particle trace visualization of intracardiac flow using time-resolved 3D phase contrast MRI. Magn Reson Med [Internet]. 1999;41:793–9. doi:10.1002/ (SICI)1522-2594(199904)41:4<793::AID-MRM19>3.0.CO;2-2.
12. Cenedese A, Del Prete Z, Miozzi M, Querzoli G. A laboratory investigation of the flow in the left ventricle of a human heart with prosthetic, tilting-disk valves. Exp Fluids [Internet]. 2005;39:322–35. doi:10.1007/s00348-005-1006-4. 13. Domenichini F, Querzoli G. Cenedese a, Pedrizzetti G. Combined experimental and numerical analysis of the flow structure into the left ventricle. J Biomech [Internet]. 2007;40:1988–94. doi:10.1016/j.jbiomech.2006.09.024.
14. Gharib M, Rambod E, Kheradvar A, Sahn DJ, Dabiri JO. Optimal vortex formation as an index of cardiac health. Proc Natl Acad Sci U S A [Internet]. 2006;103:6305–8. doi:10.1073/pnas.0600520103.
15. Kheradvar A, Gharib M. On mitral valve dynamics and its connection to early diastolic flow. Ann Biomed Eng [Internet]. 2009;37:1–13. doi:10.1007/s10439-008-9588-7.
16. Krittian S, Schenkel T, Janoske U, Oertel H. Partitioned fluid–solid coupling for cardiovascular blood flow: validation study of pressure-driven fluid-domain deformation. Ann Biomed Eng [Internet]. 2010;38:2676–89. doi:10.1007/ s10439-010-0024-4.
17. Pierrakos O, Vlachos PP. The effect of vortex formation on left ventricular filling and mitral valve efficiency. J Biomech Eng [Internet]. 2006;128:527–39. doi:10.1115/1.2205863.
18. Querzoli G, Fortini S, Cenedese A. Effect of the prosthetic mitral valve on vortex dynamics and turbulence of the left ventricular flow. Phys Fluids [Internet]. 2010;22:041901. doi:10.1063/1.3371720.
19. Cheng Y, Oertel H, Schenkel T. Fluid–structure Coupled CFD Simulation of the Left Ventricular Flow During Filling Phase. Ann Biomed Eng [Internet]. 2005;33:567–76. doi:10.1007/s10439-005-4388-9.
20. Domenichini F, Pedrizzetti G, Baccani B. Three-dimensional filling flow into a model left ventricle. J Fluid Mech [Internet]. 2005;539:179. doi:10.1017/ S0022112005005550.
21. Le TB, Sotiropoulos F. On the three-dimensional vortical structure of early diastolic flow in a patient-specific left ventricle. Eur J Mech B Fluids [Internet]. 2012;35:20–4. doi:10.1016/j.euromechflu.2012.01.013.
22. Long Q, Merrifield R, Yang GZ, Xu XY, Kilner PJ, Firmin DN. The Influence of Inflow Boundary Conditions on Intra Left Ventricle Flow Predictions. J Biomech Eng [Internet]. 2003;125:922. doi:10.1115/1.1635404. 23. Mihalef V, Ionasec RI, Sharma P, Georgescu B, Voigt I, Suehling M, et al.
Patient-specific modelling of whole heart anatomy, dynamics and haemodynamics from four-dimensional cardiac CT images. Interface Focus [Internet]. 2011;1:286–96. doi:10.1098/rsfs.2010.0036.
24. Schenkel T, Malve M, Reik M, Markl M, Jung B, Oertel H. MRI-based CFD analysis of flow in a human left ventricle: methodology and application to a healthy heart. Ann Biomed Eng [Internet]. 2009;37:503–15. doi:10.1007/ s10439-008-9627-4.
25. Verdonck PR, Vierendeels JA. Computational Science—ICCS 2002: Fluid–structure Interaction Modelling of Left Ventricular Filling. (Sloot PMA, Hoekstra AG, Tan CJK, Dongarra JJ, editors.). Berlin, Heidelberg: Springer Berlin Heidelberg; 2002. doi:doi:10.1007/3-540-47789-6.
26. Zheng X, Seo JH, Vedula V, Abraham T, Mittal R. Computational modeling and analysis of intracardiac flows in simple models of the left ventricle. Eur J Mech - B/Fluids [Internet]. 2012;35:31–9. doi:10.1016/j.euromechflu.2012.03.002. 27. Watanabe H, Sugiura S, Kafuku H, Hisada T. Multiphysics simulation of left
ventricular filling dynamics using fluid–structure interaction finite element method. Biophys J [Internet]. 2004;87:2074–85. doi:10.1529/biophysj.103.035840. 28. Moore J. a, Steinman D a, Ethier CR. Computational blood flow modelling: errors associated with reconstructing finite element models from magnetic resonance images. J Biomech [Internet]. 1998;31:179–84.
29. Dunlay SM, Shah ND, Shi Q, Morlan B, VanHouten H, Long KH, et al. Lifetime costs of medical care after heart failure diagnosis. Circ Cardiovasc Qual Outcomes [Internet]. 2011;4:68–75. doi:10.1161/CIRCOUTCOMES.110.957225. 30. Kung EO, Les AS, Figueroa CA, Medina F, Arcaute K, Wicker RB, et al. In vitro validation of finite element analysis of blood flow in deformable models. Ann Biomed Eng [Internet]. 2011;39:1947–60. doi:10.1007/s10439-011-0284-7. 31. Taylor CA, Steinman DA. Image-based modeling of blood flow and vessel
wall dynamics: applications, methods and future directions: Sixth International Bio-Fluid Mechanics Symposium and Workshop, March 28–30, 2008 Pasadena, California. Ann Biomed Eng [Internet]. 2010;38:1188–203. doi:10.1007/s10439-010-9901-0.
32. Veronesi F, Corsi C, Sugeng L, Mor-Avi V, Caiani EG, Weinert L, et al. A study of functional anatomy of aortic-mitral valve coupling using 3D matrix transesophageal echocardiography. Circ Cardiovasc Imaging [Internet]. 2009;2:24–31. doi:10.1161/CIRCIMAGING.108.785907.
33. Kwon YSL. Applicability of 4 localized-calibration methods in underwater motion analysis. In: Proceedings of XVIII International Symposium on Biomechanics in Sports. 2000. p. 48–55.
34. Wang L, Li C, Sun Q, Xia D, Kao C-Y. Active contours driven by local and global intensity fitting energy with application to brain MR image segmentation. Comput Med Imaging Graph [Internet]. 2009;33:520–31. doi:10.1016/j.compmedimag.2009.04.010.
35. Dieringer MA, Hentschel J, de Quadros T, von Knobelsdorff-Brenkenhoff F, Hoffmann W, Niendorf T, et al. Design, construction, and evaluation of a dynamic MR compatible cardiac left ventricle model. Med Phys. 2012;39:4800. doi:10.1118/1.4736954.
36. Kwon Y, Y J M, J S L. Application of the DLT method to the underwater motion analysis. J. Sport Biomech. 1995;5:49–54.
37. Krittian S, Janoske U, Oertel H, Böhlke T. Partitioned fluid–solid coupling for cardiovascular blood flow: left-ventricular fluid mechanics. Ann Biomed Eng [Internet]. 2010;38:1426–41. doi:10.1007/s10439-009-9895-7.
Submit your next manuscript to BioMed Central and take full advantage of:
• Convenient online submission
• Thorough peer review
• No space constraints or color figure charges
• Immediate publication on acceptance
• Inclusion in PubMed, CAS, Scopus and Google Scholar
• Research which is freely available for redistribution