BIROn - Birkbeck Institutional Research Online
Hough, Mike and Bradford, B. and Jackson, J. and Roberts, J.V. (2013)
Attitudes to sentencing and trust in justice: exploring trends from the crime
survey for England and Wales. Ministry of Justice Analytical Series. London,
UK: Ministry of Justice. ISBN 9781840995923.
Downloaded from:
Usage Guidelines:
Revision to Attitudes to Sentencing and Trust in Justice: Exploring Trends from the Crime Survey for England and Wales
Perceptions of the fairness of criminal justice – Table 4.2 page 33
There were seven measures of public confidence in the fairness of the CJS in the 2010/11 Crime Survey for England and Wales (CSEW). One of these seven measures (‘the CJS is too soft on those accused of committing a crime’) had been omitted from Table 4.2 which provides the 2010/11 data on these measures.
For this revised version of the report an additional row has been inserted into Table 4.2, this provides 2010/11 CSEW data on the perception that the CJS ‘is too soft on those accused of committing a crime’.
Any enquiries about this revision and wider enquiries about this report should be directed to the Surveys team of the Ministry of Justice at:
MoJAnalyticalServices@justice.gsi.gov.uk
Attitudes to Sentencing and Trust
in Justice
Exploring Trends from the Crime Survey
for England and Wales
Mike Hough (Birkbeck, University of London)
Ben Bradford (University of Oxford)
Jonathan Jackson (London School of Economics)
Julian V Roberts (University of Oxford)
Analytical Services exists to improve policy making, decision taking and practice by
the Ministry of Justice. It does this by providing robust, timely and relevant data and
advice drawn from research and analysis undertaken by the department’s analysts
and by the wider research community.
Disclaimer
The views expressed are those of the authors and are not necessarily shared by the Ministry
of Justice (nor do they represent Government policy).
First published 2013
© Crown copyright 2013
You may re-use this information (excluding logos) free of charge in any format or medium,
under the terms of the Open Government Licence. To view this licence, visit
http://www.nationalarchives.gov.uk/doc/open-government-licence/ or email:
psi@nationalarchives.gsi.gov.uk
Where we have identified any third party copyright material you will need to
obtain permission from the copyright holders concerned.
Any enquiries regarding this publication should be sent to us at
mojanalyticalservices@justice.gsi.gov.uk
This publication is available for download at
http://www.justice.gov.uk/publications/research-and-analysis/moj
Acknowledgements
The authors would like to thank Tracey Budd, Laura Freeman and Krista Jansson for their
help and advice over the course of the project, and two anonymous peer reviewers for their
Contents
List of tables
List of figures
1. Summary 1
1.1 Key points 1
1.2 Knowledge and attitudes towards crime and sentencing 2
1.3 Confidence and trust in justice 3
1.4 Trust in justice and its drivers 4
1.5 Implications for policy 5
2. Introduction 8
2.1 Project objectives and methods 8
2.2 Defining trust and confidence in criminal justice 11
2.3 Procedural justice theory 12
2.4 The structure of this report 14
3. Sentencing: public knowledge and attitudes 15
3.1 Summary 15
3.2 Chapter overview 15
3.3 Previous findings on knowledge of trends in crime and punishment 16
3.4 Public knowledge of sentencing patterns 19
3.5 Public attitudes to sentencing 22
4. Public trust and confidence in justice: Current levels and recent trends 28
4.1 Summary 28
4.2 Chapter overview 28
4.3 Public trust and confidence in criminal justice: effectiveness and fairness 29
4.4 Perceptions of the effectiveness of the criminal justice system 30
4.5 Perceptions of fairness of the criminal justice system 32
4.6 Focus on the Police 34
5. Trust and confidence in the criminal justice system: dimensions and predictors38
5.1 Summary 38
5.2 Chapter overview 39
5.3 Dimensions of Trust 39
5.5 Modelling confidence in the police and criminal justice system 41
5.6 Consequences of trust and confidence 48
5.7 Britain in a European context 50
6. Conclusions 53
6.1 Key findings 53
6.2 Implications for policy: public cooperation and compliance with the law 56
6.3 Some practical suggestions for policy and practice 57
References 60
Appendix A 75
Methodological Annex 75
Appendix B 79
List of tables
Table 3.1: Public perceptions of crime trends, nationally and locally, 2010/11 18
Table 3.2 Sources of information about crime trends, nationally and locally 18
Table 3.3: Estimates of the average custody rate for domestic burglary, 2010/11 20
Table 3.4: Estimates of the custody rate for rape, 2010/11 20
Table 3.5 Estimates of the average custodial sentence for rape, 2010/11 21
Table 3.6 Attitudes toward sentence severity (2008/09 to 2010/11) 23
Table 3.7 Public sentencing preferences, theft by an adult, 2010/11 26
Table 4.1 Public confidence in effectiveness of criminal justice, 2010/11 31
Table 4.2: Perceptions of the fairness of criminal justice, 2010/11 33
Table 4.3 Public confidence in the police, 2010/11 35
Table 5.1: Predictors of confidence in the police and Criminal Justice System 46
List of figures
Figure 3.1 Perceptions of sentences as ‘much too lenient’, 2002/03 to 2010/11 23
Figure 4.1 Confidence in the criminal justice system, 2001/02 to 2010/11 30
Figure 4.2 Trends in public confidence in criminal justice, 2008/09 to 2010/11 32
Figure 4.3: Trends in fairness of the CJS, 2008/09 to 2010/11 33
Figure 4.4 Confidence in the treatment of victims and witnesses, 2001/02 to 2007/08 34
Figure 4.5 Public perceptions of police performance, 2008/09 to 2010/11 36
Figure 4.6 Trust and confidence in the police, 1984 to 2010/11 37
Figure 5.1: Schematic overview of the findings from the CSEW and ESS 49
Figure 5.2 Trust in police procedural fairness 51
1.
Summary
This report examines attitudes to, and perceptions of, sentencing and the CJS in England
and Wales, drawing mainly on the 2010/11 Crime Survey for England and Wales (CSEW).1
The analysis focuses on perceptions of trust and confidence in justice, as well as presenting
findings on knowledge about sentencing and crime trends and attitudes toward sentencing.
In order to address issues of public cooperation and institutional legitimacy, the report also
draws upon UK data from Round 5 of the European Social Survey (ESS).
1.1
Key points
Attitudes to sentencing have changed little since 1996. Most people thought that the courts were too lenient, although responses were varied; most peopleunderestimated the severity of current sentencing practices and were relatively
lenient when expressing a sentencing preference for a specific (hypothetical)
case.
Views about the effectiveness of the criminal justice system (CJS) appeared to be fairly stable. After long-term falls in trust and confidence, this trend changed in2003 to one of stability, and even a slight increase in public confidence in the
police.
People made clear distinctions between their judgements about the fairness of the CJS and its effectiveness. Levels of trust in fairness in the CJS were higherthan levels of trust in effectiveness in the CJS.
There were demographic and geographic variations in trust in the criminal justice system; but factors unmeasured by the CSEW, such as characteristics related tobroader mind set and personality, may play a larger role.
Access to information, whether reflected in levels of education or in newspaper readership, appeared to shape attitudes to justice.
Contact with the police was an important predictor of both trust in the police and trust in the rest of the CJS. In relation to trust in the CJS as a whole thisrelationship was entirely asymmetrical (with negative contacts appearing to
damage trust, but positive contacts having no effect); in relation to trust in the
1
police it was more symmetrical (positive contacts were associated with somewhat
higher levels of trust).
Trust in the justice system is important in part because it shapes the perceived legitimacy of the system as well as people’s willingness to cooperate with legalauthorities. According to ESS UK data, the legitimacy of the police was more
important than the legitimacy of the courts in explaining variation in cooperation.
Feeling an obligation to obey the police and feeling aligned with the moral values
of the police were the most important predictors of expressed willingness to
cooperate with the police and criminal courts. Feeling aligned with the moral
values of the courts was a statistically less powerful predictor. Believing that the
courts are too lenient was associated with a greater willingness to cooperate with
legal authorities rather than a lesser willingness to cooperate with legal
authorities.
Analysis of ESS data suggested that the UK did better than some European countries in terms of levels of public trust, but worse than others, such as theNordic countries.
1.2
Knowledge and attitudes towards crime and sentencing
Public punitiveness may be defined as the tendency to demand from the criminal justice
system harsh punishment for convicted offenders. Punitiveness manifests itself in several
ways – through calls for tougher sentencing in general, criticism of the courts for being
lenient, and in support for specific policies which emphasise punishment over other criminal
justice objectives (such as rehabilitation). Two principal research strategies have evolved to
measure and explore public punitiveness: single questions tapping into general attitudes to
sentencing;2 and more complex (vignette-based) questions relating to a specific case.
A rounded appreciation of public attitudes requires both approaches.
As with previous sweeps of the CSEW, the latest findings suggest that public knowledge
about crime and sentencing remained poor in the 2010/11 survey: significant proportions of
the public held an inaccurate view of national crime trends and most people underestimated
the severity of current sentencing practices. Most people believed that the courts were too
lenient.
2
The most important predictors of public knowledge of custody rates were: gender, education,
socio-economic class, and newspaper readership.
Characteristics associated with attitudes toward sentencing were: being born in the UK (more
punitive, on average); Asian Muslim (less punitive, on average); tabloid readership (more
punitive, on average); broadsheet readership (less punitive, on average); poor health (more
punitive, on average); and perceptions of recent crime trends (with more negative attitudes
associated with perceptions of rising crime).
Factors associated with imposing more punitive sentences when confronted with case
scenarios were: gender (men were more punitive); socio-economic class (non-professionals
were more punitive); education (those without degrees were more punitive); newspaper
readership (broadsheet readers were less punitive); and crime perceptions (people believing
crime is going up in the UK as a whole were more punitive).
1.3
Confidence and trust in justice
Studies of public opinion about the criminal justice system have sometimes distinguished
between ‘trust’ and ‘confidence’, with the former defined in an active and relational sense
(individuals ‘place’ or ‘invest’ trust in an institution or organisation) and the latter defined as a
passive orientation (individuals ‘have’ confidence in an institution or organisation). In both
cases it is important to differentiate between effectiveness and fairness.
In this report the terms ‘trust’ and ‘confidence’ are used almost interchangeably to refer to a
set of public beliefs, expectations and orientations toward different criminal justice agencies.
For the current purpose, the conceptual distinction between trust and confidence seems
slight. To be confident that the police are effective – for example – seems on the face of it to
be very similar to judgement that the police can be trusted to be effective (i.e. that they are
Levels of public trust and confidence in the criminal justice system varied greatly, depending
upon the specific function of criminal justice. People expressed much more confidence in the
fairness of the CJS than in its effectiveness.3 Around six respondents in ten trusted the
fairness of the system; less than half had confidence in its effectiveness.
Levels of confidence in the effectiveness and fairness of the CJS have remained relatively
stable over the past few years, though there has been some improvement in levels of trust in
effectiveness, particularly the effectiveness of the police, and indeed in ‘overall’ levels of
confidence in the police (i.e. that the police are doing a good or bad job). This may reflect an
increasing awareness that crime is no longer rising locally4 – although, as noted previously,
the majority still think that crime is rising nationally.
When asked about the effectiveness of specific branches of the CJS, the police attracted the
highest and prisons attracted the lowest levels of confidence. Overall levels of confidence in
the police – as measured by ratings of how good a job they do – have risen since 2003/04.
The discrepancy in levels of trust for different functions of criminal justice is neither new nor
restricted to the public in England and Wales.
1.4
Trust in justice and its drivers
There were a number of different dimensions underlying trust and confidence in the police
and CJS. In relation to the police, people distinguished between the fairness of the police,
the interests or motives of officers, the reliability of the police (particularly in dealing with
minor crime) and the community engagement of the police. In relation to trust in the rest of
the CJS, people distinguished between the effectiveness of the courts, the effectiveness of
the prisons, and the fairness of the system as a whole.
Gender, age, contact experience and victimisation were consistent predictors of opinions of
both the police and the CJS. Other variables were only intermittently important predictors.
Contact with the police (both personal and in terms of perceiving police activity), and
victimisation emerged as the most consistent predictors of trust and confidence in both the
3
police and the CJS. Controlling for a large number of factors, contact with the police
consistently predicted overall trust in the CJS. However, here the association was entirely
asymmetrical, with negative contacts having a strong predictive power and positive ones
having very little.5 Knowledge about the CJS (as represented by estimates of the proportion
of convicted rapists sent to prison) was also a consistent predictor of confidence in the CJS.
The following groups were also more likely to be confident in the CJS:
women;
younger and older people (compared to those in middle age);
people in good health, with those in poor health less confident; and,
people living in lower crime areas.UK findings from the fifth round of the ESS showed that trust in fairness of the police and
courts was more important than trust in effectiveness in predicting intended willingness to
cooperate with legal authorities.6 According to the ESS, the perceived legitimacy of the
police was more important than the legitimacy of the courts in explaining variation in
expressed willingness to cooperate with the CJS.
1.5
Implications for policy
Issues of trust and confidence in justice are important for a number of reasons. Trust in
justice is an important determinant of public preparedness to cooperate with justice officials –
whether in reporting crime to the police, acting as witnesses or serving as jurors (European
Social Survey, 2012; Jackson et al., 2012a). High levels of trust in justice also result in higher
levels of public compliance with the law (Jackson et al., 2012b).
Procedural justice theory provides a useful explanatory framework for understanding the
findings presented in this report. The central concept in procedural justice theory is
legitimacy, and the driving proposition is that effective justice systems are those that secure
normative commitment to the law – a sense that abiding by the law and cooperating with
legal authorities is the right thing to do – by building public trust in justice, and thus a public
sense that the institutions of justice carry legitimacy.
4
A recent study by Sindall et al. (2012) found that perceptions of change in crime rates were, over time, associated with changing levels of confidence in the police. These were effects at the neighbourhood level: they were the result of aggregating people’s opinions via weighted neighbourhood averages.
5
The association between contact with police officers and confidence in the police was, however, more symmetrical.
6
Therefore, the reason why trust in justice helps to promote cooperation and compliance is
related to people’s perceptions of the legitimacy of the justice. Public trust in justice helps to
build the legitimacy of the institutions of justice, which in turn results in cooperation and
compliance.7
What are the best strategies for building or consolidating legitimacy in the eyes of the public?
How officials treat individuals – for example whether police officers wield their power and
authority in fair and respectful ways – seems central in communicating the trustworthiness of
the criminal justice system to members of the public. Trust in the effectiveness of the police
and the justice system plays a smaller role than trust in fairness, and with regard to fairness,
it seems that processes are as important as outcomes – that is, people pay particular
attention to the presence or absence of fair procedures, and to the quality of treatment
received from justice officials. Fair and respectful handling of people, treating them with
dignity, and listening to what they have to say, all emerge as significant predictors of
legitimacy, and thus preparedness to cooperate with legal authorities and comply with the
law. In other words, procedural fairness may not only be valued in its own right, but it may
actually be a precondition for an effective justice system.
Implementing principles of procedural justice is not cost-free, but neither is it necessarily
resource-intensive. It is worth taking into account budgetary constraints and the potential for
organisational strain, as the system rises to the challenge of "doing more with less". With
threats to the volume of available services, securing some counterbalance in terms of
improved quality may be a very wise investment. As for the targeting of strategies designed
to bolster the legitimacy of the system, trust in justice is most needed in socially and
economically marginalised communities where crime rates are highest, and where offending
and victimisation overlap.8 The demands made on the police in such areas are often
non-criminal – or lie on the margins of non-criminality – but the handling of each of these incidents
remain “teachable moments” about the trustworthiness and legitimacy of the police.9
Misperceptions of both crime and sentencing first documented in the mid-1990s remain
considerable problems. There will continue to be obstacles to addressing public
misperceptions and improving trust (with a key obstacle being the problem of achieving
7
In the UK see: European Social Survey (2012); Jackson et al., (2012a, 2012b); Bradford (in press); and Tankebe (in press). In the US see: Sunshine and Tyler (2003a); Tyler (2006a, 2006b); and Papachristos et al.,
(2012). In Australia see: Murphy (2004); Murphy et al. (2009); Elliott et al., 2011; and Murphy and Cherney
(2012).
8
Sampson and Bartusch (1998).
9
sufficient "reach") as long as mainstream media are the dominant shapers of public opinion
about crime and justice.
In conclusion, it is worth flagging a risk inherent in policy based on principles of procedural
justice. The legitimacy of systems of justice is partly about perceptions and partly about
reality. In a society where perceptions of institutions are shaped by a growing range of
media, there is a risk that strategies to improve the legitimacy of the justice system becomes
little more than a public relations exercise – securing the right media messages, and
ensuring that staff remain “on message” in their contact with the public. Such strategies of
appearance management may yield some short-term results, but there are inherent risks in
this approach given that it is about trust-building. This is because when gaps between
appearance and reality surface the costs to legitimacy can be very high indeed. In other
2.
Introduction
Public opinion and sentencing – encompassing knowledge of and attitudes towards
sentencing and sentencers – has long been an important field of criminological inquiry (e.g.
Walker and Hough, 1988; Hough and Roberts, 2012; Roberts, 1992; Wood and Gannon,
2009). More recently, public trust and confidence in the criminal justice system has emerged
as a significant focus of research and policy. Policy makers in all western nations have
sought to improve public understanding of sentencing, as well as confidence in sentencers
and the sentencing process. They are increasingly making greater efforts to improve
confidence in the system as a whole as well as in its constituent parts – particularly the
police.
In this report we draw upon analyses of the 2010/11 sweep of the Crime Survey for England
and Wales (hereafter CSEW, formerly known as the British Crime Survey10) to examine
attitudes to, and perceptions of, sentencing and the CJS. We also draw upon UK data from
Round 5 of the European Social Survey (ESS), allowing us to address the importance of trust
in the justice system in driving legitimacy and cooperation with the police and criminal
courts.11
2.1
Project objectives and methods
The project had four objectives:
To document current levels of public knowledge of sentencing, attitudes to sentencing, and trust in criminal justice, and to place those levels in a historicalcontext drawing upon the CSEW (thus updating Smith, 2010);
To document the relationship between trust in justice and attitudes to sentencing and public punitiveness;
To identify the individual and neighbourhood factors that predict attitudes and levels of trust in criminal justice; and,10
The British Crime Survey (BCS) is now known as the Crime Survey for England and Wales to better reflect its geographical coverage. While the survey did previously cover the whole of Great Britain it ceased to include Scotland in its sample in the late 1980s. A separate survey – the Scottish Crime and Justice Survey – covers Scotland. The name change took effect on the 1 April 2012, the date responsibility for the survey transferred to the Office for National Statistics.
11
To understand how public trust in justice and attitudes to sentencing affect levels of public engagement and willingness to cooperate with the criminal justicesystem, drawing upon ESS data.
Questions Addressed in the Report
In order to achieve these objectives we addressed a number of questions:
What are the key factors associated with attitudes to sentencing?
What dimensions of trust in justice does the CSEW measure?
What is the relationship between trust in justice and attitudes to sentencing and future engagement with and cooperation with the CJS?
What is the relative importance of factors in trust in justice such as:
Are socio-demographic characteristics important?
What is the importance of experience of justice (for example victimisation and contact with the police)?
What is the importance of levels of information/knowledge about crime and sentencing trends?
Are area/neighbourhood level factors important?
What are the links between contact with the police, trust in justice, perceived legitimacy of the police and criminal courts, and cooperation with the justicesystem?
Where does the UK stand in a European comparison of public trust and institutional legitimacy?Sources of Information
1. Previous literature
The report draws upon a review of the literature exploring public attitudes to crime and
punishment from the first sentencing module on the CSEW conducted in 1996 to the present,
using data from interviews conducted in 2010/11. In addition, findings from the more recent
wider literature upon public confidence in criminal justice and on attitudes to sentencing are
reviewed, in order to provide context for the CSEW trends.
2. Survey data analysis
The CSEW is the largest victimisation survey of its kind in the world (for further information
on the history and scope of the survey, see Hough et al., 2007; Hough and Maxfield, 2007;
and Maguire, 2012). The survey started in 1982 and was conducted intermittently until 2001;
nationally representative survey of individuals living in private households; interviews are
conducted face to face in the respondent’s home, with a randomly selected member of each
household.
The survey explores a range of questions related to experiences of crime and criminal justice
and measures the volume, nature and consequences of criminal victimisation against adults
(aged 16 or over) across England and Wales; an additional questionnaire is used to collect
information on crimes committed against young people between the ages of ten and fifteen.
The 2010/11 sweep of the survey reported findings from 46,754 adult interviews conducted
in that year, with a response rate of 75 per cent.12 Unless otherwise stated in the text, the
analysis in this report is based on the 2010/11 dataset. Data from the 5th round of the ESS
was also used.13
Analytical Methods Used
This report adopts a number of overlapping analytic strategies to address the questions
raised at the beginning of this chapter:
Descriptive statistics to provide information about the current levels of public knowledge, attitudes and confidence in sentencing and criminal justice.
Multivariate analyses to examine the relationships between confidence in the CJS and sentencing and factors associated with these (e.g. socio-demographiccharacteristics, experiences and attitudes).
Factor analyses to assess the underlying dimensions that the trust and confidence questions are measuring.
Multi-level modelling to examine the factors that predict levels of trust and confidence in the CJS in England and Wales.
Linear regression modelling of ESS data to outline some of the potential effects of low trust in the criminal justice system.See Appendix A for further technical information on these methods.
12
Further information about the CSEW and access to previous publications drawing upon the survey can be found at
http://www.ons.gov.uk/ons/guide-method/surveys/list-of-surveys/survey.html?survey=Crime+Survey+for+England+and+Wales
13
The scope of the analysis
This report continues a tradition of research into public trust and confidence in criminal
justice and sentencing which has drawn upon the CSEW. The CSEW has always carried
questions related to trust and confidence, and has done so in increasing depth since 1996.
(For earlier reviews see Smith, 2010, 2007; Hough and Roberts, 2004a). In 2010, Smith
reviewed trust and confidence trends from the CSEW over the period 2002/03 to 2007/08;
this report updates and extends those analyses. The present report documents current
trends in trust and confidence and incorporates perceptions of criminal justice, experience of
victimisation and other potential influences upon public opinion. The report explores several
related domains, including public knowledge of sentencing trends; attitudes to sentencing;
public confidence and trust in sentencing and the criminal justice system; and perceptions of
the legitimacy of the CJS and its individual components. In addition, a theoretical context for
the findings is also provided, using the conceptual framework of procedural justice theory.
2.2
Defining trust and confidence in criminal justice
Distinctions are sometimes made between ‘trust’ and ‘confidence’ in the justice system – for
example trust is defined in an active and relational sense (individuals ‘place’ or ‘invest’ trust
in an institution or organisation) and confidence is defined as a passive orientation
(individuals ‘have’ confidence in an institution or organisation). In practice the terms are often
used interchangeably in the literature – both at the conceptual and operational levels.
Conceptually, researchers have assumed that expressing trust in an institution is quite
similar to expressing confidence in the institution – or its ability to discharge its critical
functions (cf. Jackson and Bradford, 2010). Operationally, researchers in most Western
nations have repeatedly asked members of the public to rate how much trust or confidence
they have in various branches of criminal justice or criminal justice professionals (see Hough
and Roberts, 2004, for a review).
What is ‘trust and confidence’?
‘Trust and confidence’ has become an accepted phrase to represent public opinions of the
police and the criminal justice system as a whole. Treating trust and confidence as
essentially interchangeable terms, we follow Hardin (2002) and other recent work (e.g.
Hough et al., 2010; Jackson and Bradford, 2010; European Social Survey, 2012) in defining
trust in the police and the CJS as: the belief among members of the public that the CJS has
the appropriate intentions toward them and is competent in the tasks assigned to it (and for
that trust in the CJS extends beyond an instrumental assessment of its ability to fulfil its basic
tasks efficiently and effectively.
This approach has two important implications. First, it implies a need to consider trust (and
confidence) not as a single concept but as something multifaceted, with at least two distinct
components underlying it (an idea that is already reflected in the design of the CSEW, see
Smith 2007). Second, it implies that there is a need for a broader way of understanding how
people might weigh up these different components when thinking about the CJS. The report
draws on Tyler’s procedural justice theory to provide such an understanding.
2.3
Procedural justice theory
14Penal and criminal policy has always reflected tensions between different models of crime
control. The key features of the simpler ‘crime control’ models are that:
people make rational decisions about whether to break the law;
a deterrence approach is the main aim of criminal justice;
offenders – and thus crime rates – are responsive primarily to the risk ofpunishment. People will be deterred if they believe that legal punishment is swift,
severe and certain;
increasing the severity of sentencing and extending the reach of enforcement strategies are therefore seen as sensible responses to crime; and,
offenders’ rights to due process are seen as a constraint on effective crime control.Yet, more subtle models of crime control recognise that formal criminal justice is only one of
many systems of social control, most of which have a significant normative dimension.
Criminology has tended to give insufficient attention to questions about why people comply
with the law, and too much attention to questions about why offenders violate the law (cf.
Bottoms, 2002). This imbalance is important, because questions about law-breaking tend to
yield answers framed within the boundaries of simple crime control models. They tend to
imply approaches to crime control that are designed to secure instrumental compliance –
that is, where people’s reasons for law-breaking are based on self-interested calculation.
Questions about compliance, by contrast, yield answers that recognise the interplay between
formal and informal systems of social control, and in particular the normative dimensions in
14
people’s orientation to the law. Normative compliance with the law occurs when people feel a
moral or ethical obligation or commitment to do so.
Procedural justice theories propose specific relationships between:
the treatment people receive at the hand of criminal justice officials;
the resultant trust that people have in institutions of justice;
the legitimacy people confer, as a consequence of this trust, on institutions of justice including the police and the criminal courts;
the authority that these institutions can then command; and,
public preparedness to obey the police, comply with the law and cooperate with the justice system.Perceived legitimacy exists when the public regard the authorities as having earned an
entitlement to command, creating an obligation to obey on the part of the public and a sense
among the public that the police are morally justified in exercising power (chiefly because
they endorse the moral values of the police). If people willingly obey systems of authority that
command legitimacy, questions about the ‘drivers’ of legitimacy become of central policy
importance.
There is a growing body of research in support of procedural justice theories. Originally this
work was largely confined to the United States (e.g. Tyler and Huo, 2002; Tyler, 2007,
2011a), but it now includes a number of international studies (e.g. Murphy, 2004, 2005;
Hinds and Murphy 2007; Bradford et al., in press; Hough et al., 2013). Contrasting
instrumental and normative models of compliance, Tyler (2011b) argues that normative
compliance is economically more viable and more stable over time than instrumental
compliance, which carries a growingly unaffordable social and fiscal cost.
Using surveys of the general public, Tyler (e.g. Sunshine and Tyler, 2003b) has
demonstrated that public perceptions of the fairness of the justice system in the United
States are more significant in shaping its legitimacy than perceptions that it is effective.
Similar findings have been reported from surveys conducted in England and Wales (Jackson
et al., 2012a, 2012b). An important distinction here is between a sense of justice based on
process and one based on outcome. Tyler’s findings suggest that procedural justice – that is,
fair and respectful treatment that ‘follows the rules’ – is more important to people than
obtaining outcomes that that they regard either as fair or favourable to themselves. In other
the outcome. According to Tyler’s policing model (Sunshine and Tyler, 2003), legitimacy then
generates compliance with the law, first because people grant the justice system the right to
dictate appropriate ways to behave; and second, if individuals see the police as lacking
‘moral fibre’ – most importantly by behaving in manifestly unfair ways – that can make the
public cynical about the law.
2.4
The structure of this report
Before exploring procedural justice and public opinion, it is important to understand the
public’s levels of knowledge and general attitudes to sentencing; both provide the backdrop
for a consideration of broader issues. Chapter 3 summarises trends in public knowledge of
crime and punishment trends, as well as attitudes to sentencing. Chapter 4 explores levels
of trust in criminal justice, drawing upon a ‘global’ measure of trust and confidence and also
levels of trust and confidence in specific functions of the justice system. Chapter 5 first
examines the nature of the ‘constructs’ that underlie attitudes that relate to trust in justice; it
then documents the ‘drivers’ of public trust and confidence in criminal justice, and the
empirical consequences of low levels of public trust and confidence; before finally locating
the UK in a European-wide comparison. The empirical findings are situated within a
theoretical model of procedural justice. Chapter 6 discusses the implications of these
findings. Appendix A provides further details of analytic strategies. Appendix B provides a
3.
Sentencing: public knowledge and attitudes
3.1
Summary
Knowledge levels of crime and justice indicators remain poor – most of the public believed that national crime trends have become worse in recent years whencrime statistics show that this was not the case. Most people underestimated the
severity of sentencing and thought that the courts were too lenient; however they
were relatively lenient when expressing a sentencing preference for a specific
(hypothetical) case.
These misperceptions and attitudes existed across diverse subgroups of the population.
People who were most likely to hold incorrect perceptions of crime trends were: women; non-Muslim Asians; non-professionals; and people who did not readnewspapers. The most important predictors of public knowledge of custody rates
for rape were: gender, ethnicity, socio-economic class, and newspaper
readership.
The most important predictors of a perception that the courts were too lenient were: being born in the UK (more likely to perceive the courts as too lenient, onaverage); Asian Muslim (less); tabloid readership (more); broadsheet readership
(less); poor health (more); and perceptions of recent crime trends.
The following variables were associated with more punitive sentences being imposed in response to case scenarios: gender (men more punitive);socio-economic class (non-professionals more punitive); education (those without
degrees more punitive); newspaper readerships (broadsheet readers less
punitive); greater concern about disorder; and believing crime is going up in the
UK as a whole.
3.2
Chapter overview
Before considering findings relating to procedural justice it is important to understand the
context for public judgements. This includes both public knowledge of crime and sentencing
trends, and public attitudes towards sentencing generally, as well as sentencing preferences
in specific (hypothetical) cases. There are also policy-relevant considerations at play as it is
important for policy makers to understand public knowledge about crime rates and
After summarising the principal findings from prior research, the chapter presents findings
from the 2010/11 CSEW. Levels of knowledge about trends in crime and punishment are
significantly related to levels of punitiveness; accordingly, it is important to understand how
much the public know about these issues in order to explain variation in attitudes. The focus
is on public attitudes to the sentencing of adults, although many of the trends reported here
have also been found when researchers have asked questions about young offenders (e.g.
Hough and Roberts, 2004; Mattinson and Mirrlees-Black, 2000; Tufts and Roberts, 2002;
Ministry of Justice, 2013).
3.3
Previous findings on knowledge of trends in crime and
punishment
15Most people know little about the statutory framework of sentencing, the nature of sentencers
in England and Wales, the range of sentencing options, or actual sentencing practices
(Hough and Roberts, 2012). This is understandable, given that the sentencing process is one
of the most complex stages of the criminal justice system. The following findings emerge
from surveys of the public16 conducted over the past 20 years:
Public estimates of the imprisonment rates for specific offences are significantly lower than the actual rates (e.g. Doob and Roberts, 1983; Hough and Roberts,1999; Mattinson and Mirrlees-Black, 2000; and Walker, Hough and Lewis, 1988).
The public also under-estimates sentence lengths for specific offences (Hough
and Roberts, 1998).
Public awareness of the sentencing process and sentencing options is limited. When respondents to the CSEW were asked to identify sentences available tojudges other than imprisonment, only probation was identified by more than one
third of the sample (Hough and Roberts, 1998; Home Office, 2001). More
recently, research has demonstrated that most people fail to appreciate the role
that lay magistrates play in the sentencing process (Roberts et al., 2012). For
example, many people believed that lay magistrates were in fact legally qualified.
15
More research has been conducted into public attitudes to sentencing in this country than any other (see Hough and Roberts, 1999; Roberts and Hough, 2005; Van de Walle and Raine, 2008; Wood and Gannon 2009; and Hough and Roberts, 2012). There is also a substantial scholarly literature drawing upon a range of methodologies, both quantitative and qualitative (for discussion of alternative methodologies see Gelb, 2008; Roberts et al., 2011; Tendayi, Viki and Bohner, 2009).
16
Previous research findings
Crime in England and Wales as measured both by police recorded crime statistics and by the
CSEW has been falling or steady for the last fifteen years; but in any year over this period,
between two thirds and three quarters of the population still believed that nationally crime
was rising (e.g. Hough and Roberts, 1998; Mattinson and Mirrlees-Black, 2000). When crime
was peaking in England and Wales in the mid 1990s, 75 per cent of the population thought
that there was more crime than two years previously; in 2002/03, after several years of falling
crime, still 73 per cent thought that there was more crime (Simmons et al., 2002; Nicholas
and Walker, 2004).
Prior sweeps of the CSEW suggest that perceptions of local crime trends may be more
accurate, reflecting direct experience rather than news media exposure. Less than one third
of the 2009/10 sample believed that crime in their local area had increased
(Parfrement-Hopkins and Green, 2011). The 2009/10 recorded crime statistics17 revealed no statistically
significant changes in national crime rates; the trend in overall CSEW crime (i.e. crimes
reported to the survey) since 2004/05 had been flat.
2010/11 CSEW findings
The 2010/11 CSEW posed two questions about crime trends:
What do you think has happened to crime in the country as a whole over the pastfew years?
What do you think has happened to crime in your local area over the past fewyears?
Respondents were given the response options shown in Table 3.1; the correct answer to the
first question is “stayed about the same”. The misperceptions documented in earlier sweeps
of the CSEW remain: perceptions of crime trends are clearly less positive with respect to the
national level. Two fifths of the sample (40%) expressed the opinion that crime across the
country had “gone up a lot” over the last few years; less than one respondent in ten held this
opinion about local crime trends.
17
Table 3.1: Public perceptions of crime trends, nationally and locally, 2010/11
Country as a whole Respondent’s Local Area
Gone up a lot 40% 9%
Gone up a little 34% 29%
Stayed about the same 19% 53%
Gone down a little 6% 8%
Gone down a lot <1% 1%
Unweighted n (=100%) 34,735 34,284
Questions: “What do you think has happened to crime in the country as a whole [in your local area] over the past few years?”, Source: CSEW.
One explanation for the discrepancy in perceptions of crime trends at the local and national
levels is that the latter are shaped by media coverage of high profile cases; these may lead
people to draw adverse conclusions about crime trends nationally. On the other hand, when
thinking about local area trends people probably draw upon their own experience, and since
most areas of the country, according to the CSEW, have experienced stable or falling crime
rates for most offences in recent years, this is most likely to be reflected in responses seen in
Table 3.1. This interpretation is supported by responses to a supplementary question which
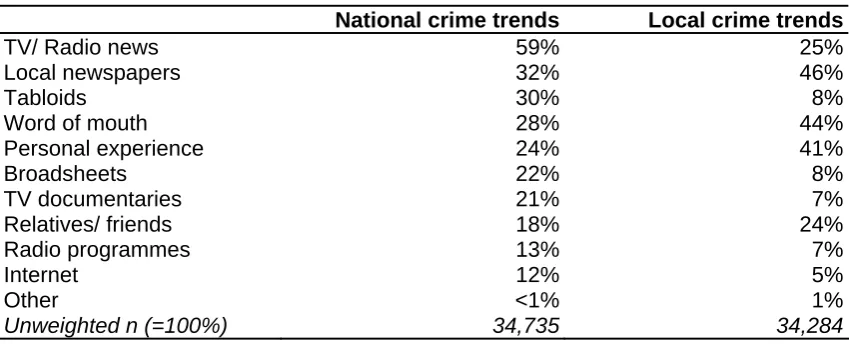
sheds light on public sources of information about crime trends. Respondents were asked
the following question: “Which of the following sources would you say has given you the
impression..[about crime trends]?”. Respondents were significantly more likely to cite the
media as the source of information for their view of national crime trends (see Table 3.2). TV
and radio news were cited by approximately six out of ten respondents with regards to
[image:26.595.72.497.504.676.2]national crime patterns, but 25 per cent with respect to local crime.
Table 3.2 Sources of information about crime trends, nationally and locally
National crime trends Local crime trends
TV/ Radio news 59% 25%
Local newspapers 32% 46%
Tabloids 30% 8%
Word of mouth 28% 44%
Personal experience 24% 41%
Broadsheets 22% 8%
TV documentaries 21% 7%
Relatives/ friends 18% 24%
Radio programmes 13% 7%
Internet 12% 5%
Other <1% 1%
Unweighted n (=100%) 34,735 34,284
3.4
Public knowledge of sentencing patterns
Previous research findings
The general research strategy has been to ask people to estimate the custody rate, or the
average sentence for specific crime types, and to compare these public responses to actual
sentencing patterns.18 For example, in 2007/08, almost all (97%) of convicted rapists were
sentenced to custody. However, a third of the CSEW sample estimated that less than half of
all offenders convicted of rape were imprisoned; another third estimated between 50 per cent
and 80 per cent (Smith, 2010). Comparable misperceptions were found for burglary (see also
Mattinson and Mirrlees-Black, 2000).19
2010/11 CSEW findings
The 2010/11 sweep of the CSEW asked: “Out of every 100 men aged 21 or over who are
tried and found guilty of house burglary how many are sent to prison?”. Subsequent
questions were then asked for estimates of the custody rate and the average sentence
imposed on “men aged 21 or more who are tried and found guilty of rape”.
(i) Domestic Burglary
Sentencing statistics published by the Ministry of Justice for 2011 show that of all males
aged 21 or over convicted of burglary, 71 per cent were sentenced to immediate custody.
This aggregate statistic does not distinguish between offenders who plead guilty and those
convicted after trial. Since offenders who plead not guilty are more likely to be sent to
prison,20 the correct answer to the question would probably be around 80 per cent.
Accordingly, any response between 70 per cent to 90 per cent may be considered to be
accurate – and responses below 60 per cent as large under-estimates of the actual custody
rate.21 Most respondents (86%) fell into the category of a large under-estimate of the custody
rate; only 8 per cent provided a roughly accurate estimate of the custody rate for this profile
of offender (Table 3.3).
18
For findings from other countries see Roberts and Hough (2005).
19
A decade earlier, in the first analysis of public knowledge of sentencing trends drawing upon the CSEW Hough and Roberts (1998) found that 58% of respondents provided an estimate of the custody rate for rape which was much too low (i.e., more than 30% lower than the actual rate).
20
Ministry of Justice (2011).
21
Table 3.3: Estimates of the average custody rate for domestic burglary, 2010/11
Estimate % of Respondents
Over-estimate of custody rate (> 90%) 2%
Roughly accurate estimate of custody rate (70% - 90%) 8%
Small under-estimate of custody rate (60% - < 70%) 4%
Large under-estimate of custody rate (< 60%) 86%
Unweighted n (=100%) 5,737
Question: “I’d like you to think about the kinds of sentence that are imposed for burglary. Out of every 100 men aged 21 or over who are tried and found guilty of house burglary how many are sent to prison?”, Source: CSEW.
(ii) Rape
The 2011 sentencing statistics published by the Ministry of Justice show that as in previous
years almost all (99%) of convicted rapists are sent to prison. A large under-estimate of
the custody rate for this offence could be defined as percentages of 60 per cent or less.
A second group may be defined as a small under-estimate of the custody rate (between 60%
and 85%). Finally, estimates between 85 per cent and 100 per cent can be considered
roughly accurate. Approximately half the sample (48%) largely under-estimated the custody
rate for rape (Table 3.4).
Table 3.4: Estimates of the custody rate for rape, 2010/11
Estimate % of Respondents
Roughly accurate estimate of custody rate (85% - 100%) 29%
Small under-estimate of custody rate (> 60% - < 85%) 23%
Large under-estimate of custody rate (60% or less) 48%
Unweighted n (=100%) 5,713
Question: “Now turning to rape. Out of every 100 men aged 21 or over who are tried and found guilty of rape, how many do you think are sent to prison?”, Source: CSEW.
CSEW respondents were also asked to estimate the average sentence imposed on
offenders convicted of rape: “Thinking of men aged 21 or over who are convicted of rape,
what do you think is the average length of sentence they get?”22 Sentencing statistics23 for
males convicted of rape of a female in 2011 show an average sentence length of 8.5 years.
This statistic includes all offenders; defendants aged 18–20 receive shorter sentences than
adults 21 or over24 and therefore the true statistic for the description provided in the survey
would be higher; 9 years is used as the comparator in the analyses.
22
To ensure that respondents are thinking of the sentence imposed in court rather than the time actually served in prison, the CSEW interviewer makes this clear. Unlike the previous question on the custody rate for rape, the sentence length question does not specify that the offender pleaded not guilty but was convicted after trial.
23
Available at: http://www.justice.gov.uk/statistics/criminal-justice/criminal-justice-statistics.
24
The sample’s average sentence length was 5.4 years, significantly lower than the average
sentence imposed on this profile of offender.25 Table 3.5 groups respondents into four
categories: those who were roughly accurate in their estimates of the average sentence for
rape; those who over-estimated the average sentence; those who provided a small
under-estimate, and finally those who made large underestimates of the sentence length. Around
one in six (15%) respondents provided an estimate that may be regarded as roughly
accurate. Most respondents under-estimated the average sentence imposed: just over half
(55%) estimated the average sentence to be under five years, when the true average is
[image:29.595.74.511.276.360.2]almost ten years (see Table 3.5).
Table 3.5 Estimates of the average custodial sentence for rape, 2010/11
Estimate % of Respondents
Over-estimate of average sentence (> 10 years) 5%
Roughly accurate estimate of average sentence (7 - 10 years) 15% Small under-estimate of average sentence (> 5 - < 7 years) 25%
Large under-estimate of average sentence (< 5 years) 55%
Unweighted n (=100%) 5,688
Question: “Thinking of men aged 21 or over who are convicted of rape, what do you think is the average length of sentence they get?”, Source: CSEW.
Predicting variations in the estimated custody rate for rape
To complement the analysis reported above, linear regression modelling was used to further
explore the question asking respondents to estimate the custody rate for rape. This
technique allows identification of variables with independent associations with estimates of
the custody rate when other variables are controlled for. A wide range of socio-demographic
and other variables were included (see Chapter 5 for examples of the explanatory variables
tested and Appendix A for further detail on the methodology, full results are shown in
Supplementary Table B3.1). Note that this model predicted the proportion of convicted
rapists respondents thought to be sent to prison; the correct rate is close to 100 per cent, so
this question can, in one respect, be seen as a measure of knowledge about sentencing
practice.
25
Significant predictors of estimates of the custody rate for rape included: gender (women
giving lower estimates than men); socio-economic class (those in the higher professional
groups gave higher average estimates than others); education (more education being
associated with higher estimates); and readership of some types of newspapers (readers of
broadsheet newspapers were likely to give slightly higher estimates). However, this model
explained relatively little of the variation in respondents’ custody rate estimates (around 6%),
suggesting that the most important factors influencing people’s judgements about custody
rates are likely to be represented by variables not currently included in the CSEW.
3.5
Public attitudes to sentencing
Two principal research strategies have evolved to measure and explore public punitiveness:
single questions tapping general attitudes to sentencing, and more complex questions
relating to a specific case. A rounded appreciation of public attitudes requires both
approaches.
Previous research findings
Attitudes to sentencing are largely based on misperceptions of sentencing practices – most
people have a negative view of courts because they believe courts impose more lenient
sentences than is in fact the case. The most frequently posed question is: “Are the courts too
harsh, too lenient or about right?”. This question may be taken as an index of public
punitiveness, albeit one with limitations. The principal limitations are (i) when responding,
most people may think of the worst crimes and offenders; (ii) a survey does not allow people
sufficient time to consider the “evidence” on the question – they may respond with media
stories of sentencing which tend to be unrepresentative. The utility of the question is that it
has been repeatedly posed. The wording has varied slightly over the years, but the response
has been the same; the percentage of the public expressing this view has changed little over
the past 25 years.26 Thus 79 per cent of the 1996 CSEW sample believed sentencing was
too lenient (Hough and Roberts, 1998). Other recent surveys have found the same pattern of
findings (Dawes et al., 2011; Roberts et al. 2012).
26
2010/11 CSEW findings
Table 3.6 provides data from the previous three years (2008/09 to 2010/11). Three-quarters
of the sample endorsed the view that sentences are too lenient, with respondents holding
this view similarly divided between “a little too lenient” and “much too lenient”. Comparing
trends over a longer time period shows that public attitudes to sentencing practices – have
changed little over a nine year span. Figure 3.1 summarises trends in responses from
2002/03 to 2010/11 and reveals little variation in the proportion of respondents expressing
[image:31.595.72.511.260.357.2]the view that sentences are much too lenient.
Table 3.6 Attitudes toward sentence severity (2008/09 to 2010/11)
2010/11 2009/10 2008/09
Much too tough <1% 1% 1%
A little too tough 2% 2% 2%
About right 24% 22% 21%
A little too lenient 36% 35% 35%
Much too lenient 38% 40% 41%
Unweighted n (=100%) 5,596 5,389 5,572
[image:31.595.75.509.435.622.2]Question: see text, Source: CSEW
Figure 3.1 Perceptions of sentences as ‘much too lenient’, 2002/03 to 2010/11
Source: CSEW
Demographic Variation
There was little demographic variation in the percentage of respondents who perceived the
courts to be too harsh, too lenient or about right. When variation did arise it was in
unpredictable ways. For example, middle-aged respondents were more likely than both older
and younger respondents to think that sentences were too lenient. Supplementary Table
Punitivity index based on the CSEW
Responses to two questions were combined to create an index of punitiveness. The two
questions used were: the question described above (perception of whether courts are too
harsh, too lenient or about right), and a second question that asked respondents to agree or
disagree27 with the following statement: “The criminal justice system is too soft on those
accused of committing a crime”. The index was created by simply taking the mean of these
two questions. A linear regression model predicting scores on this punitivity index was
estimated (see Appendix A and Supplementary Table B3.3) to identify factors that
influence levels of public punitiveness, with the aim of generating additional insight into the
correlates and predictors of punitiveness.28
The model confirms the rather limited role of demographic and other variables available in
the CSEW in predicting punitiveness. Despite including a large number of explanatory
variables, the model explained only around 16 per cent of the variation in punitivity as
measured by these two general questions. However, many explanatory variables were
significant in the model. Punitivity first increased with age then decreased. Women were
somewhat less punitive than men, while people with degrees were less punitive than those
without. Those employed full time tended to be less punitive than others, as were single
people. Compared with people who did not read newspapers, readers of tabloid style papers
were on average more punitive, while readers of broadsheets were less. Having been born in
the UK, access to a car, and being in poor health, were other characteristics associated with
higher levels of punitiveness.
Of greater interest is the relationship between punitiveness and variables representing
experiences of and attitudes towards crime and justice issues, a number of which emerged
as significant predictors in the model. Victims, and those who perceived more disorder in
their local area and/or increasing crime at the national level, were more punitive. However,
it is important to note that the effect sizes (regression coefficients) within the model are
generally very modest. The effect size can be thought of as an indicator of the importance of
a particular variable in accounting for responses to specific questions. If a variable generates
a very small effect size this usually indicates that it is not a particularly important predictor
of punitiveness, whatever the statistical significance of the relationship between the two.
27
Response options were: “strongly agree”; “tend to agree”; “strongly disagree”; “tend to disagree”; while “don’t know” responses were excluded when constructing the scale.
28
In summary, the reasons why some people respond more punitively than others seem likely
to relate primarily to variables which were not measured in the CSEW.
Public sentencing preferences in response to case scenarios
An alternate method of measuring punitiveness involves asking people to impose sentences
in response to typical crimes. This method provides the opportunity to compare the severity
of sentences derived from the public with actual sentencing trends. The first example of this
approach derives from 1996 when a sub-sample of the CSEW was asked to sentence a
23-year-old burglar with previous convictions who broke into an old man’s home and stole
electrical goods. Approximately half the sample (54%) favoured imprisonment, with an
average sentence length of twelve months (Hough and Roberts, 1998). The case on which
the vignette was modelled had actually attracted a sentence of three years, reduced on
appeal to two; suggesting that the public are less punitive when asked about a specific case
than when asked a general question about sentencing. This finding has been replicated a
number of times (e.g. Doob and Roberts, 1984; Hough and Roberts, 1998; Mitchell and
Roberts, 2011).
Two scenarios used in recent sweeps of the CSEW permit us to explore punitiveness in
response to specific cases. CSEW respondents were asked to sentence an offender
convicted of theft. Two scenarios were used involving adult offenders, one with and one
without a prior, relevant conviction: (1) “I would like you to think about what action might be
taken against a 30 year old man who owns up to minor offence such as the theft of clothing
worth £30 from a small independent shop. He has never been in trouble with the police
before.”
After choosing a sanction in response to this case, respondents were then asked: (2) “If the
man has been in trouble before for a similar minor offence, which of the actions on the card
do you personally think should be taken against the offender?”.
Table 3.7 provides a breakdown of public responses from the 2010/11 CSEW. As can be
seen, there is almost no support for custody with respect to the first offender; however,
almost one third favoured the use of custody when they learned that the offender had a prior
conviction for theft. This shift to custody in response to the presence of a related prior
conviction is consistent with previous research which has demonstrated the importance of a
criminal record as an aggravating factor in the eyes of the public (e.g. Hough et al., 2009;
Table 3.7 Public sentencing preferences, theft by an adult, 2010/11
Offender with no prior convictions
Offender with prior conviction for theft
Caution/ warning 37% 2%
Conditional discharge 9% 5%
Fine 26% 22%
Community sentence 26% 42%
Custody 2% 29%
Unweighted n (=100%) 11,666 11,648
Questions: see text; Source: CSEW
Socio-demographic and experiential variation in sentence preference
Regression modelling was used to further explore respondents’ sentencing preferences to
understand which socio-demographic and other variables were independently associated
with punitive sentencing in the two scenarios. Two binary logistic regression models were
estimated, covering both of the scenarios described above (further details in Appendix A
and full results in Supplementary Table B3.4).29 For the first offence the following groups
were less punitive: women; people from BME groups; people with degrees or higher
educational qualifications; newspaper readers; those who thought crime in the UK nationally
was going down; and those who had had contact with the CJS. People who perceived that
disorder was a problem in their local area tended to be more punitive.
For the scenario in which the defendant had a prior conviction, where nearly one third of
respondents preferred custody (Table 3.7) the following groups tended to prefer less punitive
sentences than this: women; people with degrees; readers of broadsheet newspapers; single
people and those who visited pubs; those who thought crime was lower in their local area
than nationally; those who thought UK crime levels were falling; and people who had had
some contact with the CJS. By contrast, the following groups tended to be more likely to
prefer custody: those from a Black African background; those from lower socio-economic
groups; those in poor health; those who thought disorder was a problem locally; and those
who felt crime was increasing nationally.
29
This chapter has shown that – despite changes in crime levels and in sentencing practice –
attitudes to crime and justice in 2010/11 were remarkably consistent with earlier findings. The
majority of the public continues to believe that crime is rising nationally and most people
underestimate the actual severity of the courts at sentencing. Taken together these findings
help to explain the negative public attitudes to the courts, and the belief that sentencers are
too lenient. There are now some signs, however, that people are starting to notice falls in
crime, as around a third of the 2010/11 sample thought that crime in their area was rising. If
crime levels remain steady – or continue to fall – more people may notice this, and in time,
4.
Public trust and confidence in justice: Current
levels and recent trends
4.1
Summary
Levels of public confidence in the criminal justice system vary greatly, depending upon the specific function of criminal justice. People express much lessconfidence in the effectiveness of the CJS than in its fairness.
This discrepancy in levels of trust for different functions of criminal justice is neither new nor restricted to the public in England and Wales.
When asked about the effectiveness of the CJS as a whole, a majority of the public lack confidence. When asked about the effectiveness of specific branchesof the CJS, the police attract the highest and prisons attract the lowest levels of
confidence; levels of confidence in the courts were also low.
Levels of confidence in the effectiveness and fairness of the CJS have increased slightly over the past few years, albeit that the longer term picture is largelystable.
Overall levels of confidence in the police have increased in recent years.
Levels of confidence in the fairness of the CJS are relatively high. With the exception of the question about the balance between victims and offenders, allother components of fairness attracted more positive than negative ratings from
the public.
4.2
Chapter overview
This chapter draws upon the 2010/11 sweep of the CSEW to update and extend findings
from previous sweeps of the survey (e.g. Smith, 2007, 2010; Van de Walle, 2008; Hough and
Roberts, 2004) The chapter covers global measures of confidence (the criminal justice
system as a whole) as well as confidence in specific functions of criminal justice (such as
reducing re-offending; rehabilitating offenders, achieving the correct balance between the
rights of victims and offenders).30 It also covers confidence in the fairness of the CJS.
30