BIROn - Birkbeck Institutional Research Online
Nasir, M.H.A and Genovese, A and Acquaye, A and Koh, S.C.I. and Yamoah,
Fred (2017) Comparing linear and circular supply chains: a case study from
the construction industry. International Journal of Production Economics 183
(B), pp. 443-457. ISSN 0925-5273.
Downloaded from:
Usage Guidelines:
Please refer to usage guidelines at or alternatively
This is an author produced version of Comparing linear and circular supply chains:A case study from the construction industry.
White Rose Research Online URL for this paper: http://eprints.whiterose.ac.uk/101293/
Article:
Haneef Abdul Nasir, M., Genovese, A. orcid.org/0000-0002-5652-4634, Acquaye, A.A. et al. (2 more authors) (2017) Comparing linear and circular supply chains:A case study from the construction industry. International Journal of Production Economics, 183 (B). pp. 443-457. ISSN 0925-5273
https://doi.org/10.1016/j.ijpe.2016.06.008
Article available under the terms of the CC-BY-NC-ND licence (https://creativecommons.org/licenses/by-nc-nd/4.0/)
promoting access to White Rose research papers
Author’s Accepted Manuscript
Comparing linear and circular supply chains:A case
study from the construction industry
Mohammed
Haneef
Abdul
Nasir,
Andrea
Genovese, Adolf A. Acquaye, S.C.L. Koh, Fred
Yamoah
PII:
S0925-5273(16)30113-X
DOI:
http://dx.doi.org/10.1016/j.ijpe.2016.06.008
Reference:
PROECO6436
To appear in:
Intern. Journal of Production Economics
Received date: 1 October 2015
Revised date:
25 March 2016
Accepted date: 7 June 2016
Cite this article as: Mohammed Haneef Abdul Nasir, Andrea Genovese, Adolf A.
Acquaye, S.C.L. Koh and Fred Yamoah, Comparing linear and circular supply
chains:A case study from the construction industry,
Intern. Journal of Production
Economics,
http://dx.doi.org/10.1016/j.ijpe.2016.06.008
This is a PDF file of an unedited manuscript that has been accepted for
publication. As a service to our customers we are providing this early version of
the manuscript. The manuscript will undergo copyediting, typesetting, and
review of the resulting galley proof before it is published in its final citable form.
Please note that during the production process errors may be discovered which
could affect the content, and all legal disclaimers that apply to the journal pertain.
1
Comparing linear and circular supply chains:A case study from the construction industry
Mohammed Haneef Abdul Nasir1, Andrea Genovese1, Adolf A. Acquaye2, S.C.L. Koh1, Fred
Yamoah3
1University of Sheffield, Management School
2University of Kent – Business School
3University of Hertfordshire – Business School
Abstract
In the last decades, green and sustainable supply chain management practices have been
developed in efforts to try and reduce the negative consequences of production and
consumption processes on the environment. In parallel to this, the circular economy discourse
has been propagated in the industrial ecology and production economic literature and lately in
business and practice. The ideals of the circular economy principles suggests that the frontiers
of environmental sustainability can be pushed by emphasising the idea of transforming products
in such a way that there are workable relationships between ecological systems and economic
growth.
By arguing for these ideals to be integrated into green supply chain management theory and
practice, the paper uses a case study from the construction industry to demonstrate the
environmental gains in terms of carbon emissions that can be achieved through some circular
that an integration of circular economy principles within sustainable supply chain management
can provide clear advantages from an environmental point view despite some external supply
chain influences and scenarios.
Further to this, emerging supply chain management challenges and market dynamics are also
highlighted and discussed.
3
1. Introduction
Over the past few decades, individual and corporate entities have become increasingly aware of
the greater roles they need to play in preserving natural resources. It has also been established
that economic and production systems cannot be separated from the environment, with
contemporary ecological economic theory emphasising the increasing impacts of human
activities on the natural environment (Harte 1995).
Within this context, in the last decades, sustainable supply chain management theories have been
emerging (inter alia: Walton et al. 1998; Seuring and Müller 2008; Sarkis et al. 2011), suggesting
that the requirement to take a holistic view of the whole product supply chain is a fundamental
step for establishing sustainable production systems.
Interestingly, the concepts of green and sustainable supply chain management have been
developed in parallel to the circular economy discourse, which has been propagated in the
industrial ecology literature and practice for a long time (Ehrenfeld, 1995). In fact, sustainable
supply chain management seeks to integrate environmental concerns into organisations by
minimizing materials’ flows or by reducing unintended negative consequences of production and
consumption processes (Sarkis et al., 2011). On the other hand, as described by McDonough and
Braungart (2002), circular economy pushes the frontiers of environmental sustainability by
emphasising the idea of implementing production systems in which materials are used over and
over again, in such a way to achieve workable relationships between ecological systems and
economic growth (McDonough and Braungart, 2000; Francas and Minner, 2009).
Finding ways to align sustainable supply chain strategies to circular economy principles, and
understanding full environmental and economic implications for this has therefore become
important if the boundaries of environmental sustainability are to be pushed, especially in
energy and materials intensive industries.
In order to investigate and discuss these issues, a case study from the construction industry is
sector is directly responsible for a relevant quota of global solid waste generation, high-energy
consumption, resource depletion (Ortiz et al., 2009). Specifically, this research will encompass
the supply chains of two different types of insulation materials (a crucial component in the
industry), by comparing a product resulting from a circular supply chain (in which waste is
utilised as a raw material) to a product deriving from a traditional linear production system (in
which virgin resources are utilised as input).
By using Life-Cycle Analysis, the main aim of this study is to assess the environmental impacts
associated with the two supply chains, also understanding additional dynamics and implications
that could arise by the implementation of circular production systems.
To this aim, the study will be divided into four main parts. Firstly, a literature review will be
presented, illustrating the principles of green supply chain management, circular economy, and
generalities about frameworks for evaluating the environmental performance of supply chains.
Section 3 presents methodological notes about the employed LCA approach; also, generalities
about the case study are provided. Section 4 analyses the results of the research. In Section 5, an
analysis of different scenarios is performed, and then some conclusions are drawn.
2. Literature Review
2.1 Green Supply Chain Management
Supply chain management allows the design and management of flows of products, information
and financial resources throughout complex production systems (Sanders, 2012).
Within this context, thanks to the ever-growing consciousness within the society about the
environment, sustainability has become a key priority in the design and operation of supply
chains (Sundarakani et al., 2010). Over the years, there are many variations in the definition and
terminologies used to describe sustainable or green supply chain management; however, in
5
aligned to an utilitarian environmentalist perspective, where the integration of environmental
concerns in organisations are conducted by minimising material flows or by reducing negative
impacts of production and consumption processes (Srivasta, 2008; Sarkis et al., 2011). Within
this context, green supply chain management practices ensure that green and environmental
objectives are aligned with operational supply chain objectives. Early studies on the topic can be
traced as early back as in the work of Ayres and Knees (1969), which addressed issues of
material balancing and the roles of production and consumption in the supply chain. A rising
number of papers, such as those from Linton et al. (2007) and Seuring and Muller (2008),
address the loopholes from previous studies such as that of de Burgos and Lorente (2001) which
deal with environmental performance as an operations management objective, while supply chain
issues are only secondarily addressed. Moreover, recent studies have clearly shown the
interconnection between supply chain strategies and their environmental consequences, hence
underlining the fundamental importance of aligning an organisation’s supply chain with its
environmental targets (Hervani et al., 2005).
The measuring and benchmarking of the company’s environmental performance with respect to
the supply chain remains a challenging proposition. Difficulties may arise due to a number of
factors such as the complexities of the supply chains (Beamon, 1999) as well as non-standardised
data and geographical differences (Hervani et al., 2005; Lake et al., 2015).
2.2 Circular Economy
Circular economy is defined as an economic paradigm where resources are kept in use as long as
possible, with maximum value extracted from them while in use; the paradigm has its conceptual
root in industrial ecology, emphasising the benefits of recycling waste materials and by-products
(Jacobsen, 2006). The principles of circular economy thus extend the boundary of green supply
chain management by devising methodologies to continuously sustain the circulation of
for economic activity (Andersen, 2006; Genovese et al., 2015). This economic paradigm is
opposed to the current linear take-make-dispose resource model that generates significant waste
(Ellen Macarthur Foundation, 2015). At a micro-level, the implementation of circular economy
practices would push for the design of circular or reverse supply chains, enabling products at the
end of their life cycle to enter the supply chain as a production input through recycling,
re-usage or remanufacturing.
Reverse Supply Chain Management has been defined by Guide Jr. and Wassenhove (2002) as a
series of activities that are required in order to retrieve a used product from a customer and
either dispose of it or reuse it. Guide Jr. and Wassenhove (2002) have also inferred that in
general, companies that have been most successful with their reverse supply chains are those that
are able to closely coordinate their reverse with their forward supply chains, creating a
closed-loop system, hence maximising value creation over the entire life cycle of the product. However,
it shall also be noted that reverse supply chains can also be open-loop where materials are
recovered by parties other than the original producers and used in the production of different
products (Gou et al., 2008; Genovese et al., 2015).
The idealistic paradigm of the circular economy might also be its Achilles’ heel; some have
argued that in the European context, mainly dominated by free-market and neo-liberal
ideologies, companies are already capturing most of the economically attractive opportunities to
recycle, remanufacture and reuse. This leads them to claim that reaching higher levels of
circularity may involve an economic cost that Europe cannot cope, especially as companies are
already struggling with high resource price (Ellen Macarthur Foundation, 2015). Hence, policy
interventions are also required alongside innovative business models currently adopted by
7
2.3 Life Cycle Assessment
The use of Life-Cycle Assessment enables the estimation of the cumulative environmental
impacts resulting from all stages in the product life cycle (SAIC, 2006). Management strategies
increasingly include usage of LCA for identifying environmental impacts and inefficiencies in
resource use throughout the lifecycle of a product (Lake et al., 2015).
ISO 14040 and ISO 14044 provide the principles, framework, requirements and guidelines for
undertaking LCA (Rebitzer et al., 2004). Traditional LCA methodology or also known as process
LCA, works by creating a system boundary dictated by the aims of the study and accounts for
individual impact assessments within the system (Genovese et al., 2015). As value judgements
involve several steps - for instance, different choices of boundaries and related truncation errors
(Carlson-Skalak et al., 2000) - different approaches might lead to different results (Matos and
Hall, 2007). This has led to this methodology being described as incomplete, primarily because it
is not possible to account for the theoretically infinite number of inputs of every complex
product supply chains into the LCA system (Acquaye et al., 2011; Genovese et al., 2015).
Nevertheless, LCA remains a useful indicator of the environmental impacts associated with a
product’s life cycle and can be a basis for eco-labelling requested by consumers,
non-governmental organisations (NGOs) and national as well as international authorities (Jensen et
al., 1997). In addition, LCA can be a decision support tool that helps businesses to ensure that
their choices are environmentally sound (Lake et al., 2015).
2.4 The Construction Insulation Materials Industry
The United Kingdom Green Building Council has identified construction as the most
emission-intensive industry, being responsible for around 50 percent of greenhouse gas production in the
country (Dadhich et al., 2015). Fraunhofer ISI (2009) highlighted that more attention should be
given to the environmental impact of the construction industry as the industry is responsible for
From a holistic point of view, the Code for Sustainable Homes (Department for Communities
and Local Government, 2006) states that the construction of buildings should emphasize
optimum energy efficiency and the use of natural, reclaimed and recycled materials.
Insulation of buildings is a major element in providing an economical route to achieving the
requirements of these various regulations, as heating energy can be saved, hence contributing to
conservation of energy resources and lowering air pollution from the combustion of fossil fuels
(Schmidt et al., 2004). In the United Kingdom (UK), the market for insulation materials
(exceeding £1 billion in 2008) forms a significant component of the construction industry
(Murphy and Norton, 2008). With increasing emphasis on sustainable construction and green
building, insulation plays a fundamental role in contributing to the environmental credentials of
any construction projects, from how the insulation products are manufactured and its supply
chain, to the energy saving capability of the products through preventions of heat loss in
buildings.
There are many different types of insulation materials available in the market, each produced
from different resources such as sheep wool, stone wool, glass wool and natural fibre. Regardless
of the types of materials, the levels of thermal insulation required either for new buildings or
refurbishment projects, which are set by building regulations, have to be met. These are mainly
expressed as a U-value, which is a measure of heat loss. Although of the same type (i.e., stone
wool), different brands of insulation may exhibit different thermal insulation performance and
require different amount of material to achieve the required U-value. Therefore, the U-value
often becomes a useful indicator for customers to select their preferred insulation product.
One of the most commonly used insulation material within the construction industry is stone
wool, which is produced using virgin raw materials from volcanic rock such as diabase or basalt,
together with limestone and dolomite (Väntsi and Kärki, 2013); recently, alternative products,
based on the recycling of used materials, have been proposed as an alternative to traditional
9
2.5 Importance of the Study
It is important to understand the environmental implications of utilising sustainable alternatives
in various contexts and applications. The increasing understanding and adoption of
environmental paradigms such as the circular economy requires a holistic assessment approach in
which environmental impacts are brought into one consistent framework, regardless of whether
these impacts have occurred or will occur (Genovese et al., 2015).
The availability of LCA on insulation products will enable well-informed decisions to be made
by key stakeholders in the construction industry, taking into account the full consequences and
benefits of their construction material selection. Producers of insulation products and other
construction materials may also re-evaluate their supply chain and place greater emphasis on the
sustainability of their products and supply chains.
The study will therefore seek to understand the potential impact of switching from conventional
insulation materials to insulation materials produced using recycled sources.
3. Methodology
The main aim of this research is to evaluate and compare the environmental impacts associated
with the supply chain of building insulation products obtained from recycled materials (circular
supply chain) to those associated with traditionally manufactured products (linear supply chain).
Both the products considered in this research generally serve the same function, which is mainly
to contain heat within a building. As established in the literature review, a Life Cycle Assessment
(LCA) provides a good understanding of the environmental impacts of supply chains, enabling
the identification of production paths associated with high energy and resource usage, as well as
pollution and emission of greenhouse gases (Genovese et al., 2015). LCA will form the
3.1 Life Cycle Assessment
The life cycle assessment framework deployed for this study is based on ISO 14040 international
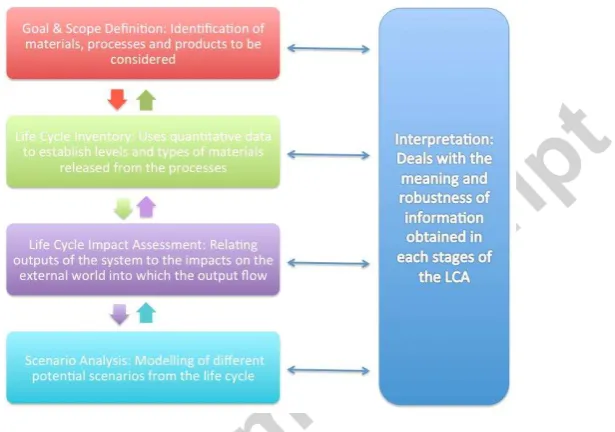
standards (Finkbeiner et al., 2006), where the method for LCA is articulated in four main steps:
Goal and scope definition; Inventory analysis; Impact assessment; Interpretation (Figure 1). In
addition to these steps, scenario analysis is integrated into the framework to model potential
[image:13.595.170.478.236.452.2]impacts of various recommendations.
Figure 1: Adaptation of LCA standards according to ISO14040
The environmental impact can be measured in many different ways depending on the chosen life
cycle impact assessment (LCIA) method (Bousquin et al., 2012). One of the categories within
the method as per the Intergovernmental Panel on Climate Change (IPCC) standard is the global
warming potential over 100 years (GWP100) in kilograms of carbon dioxide equivalent (kgCO2
-eq). This method is adopted for this study due to the availability of data and because it has been
used effectively in a large number of similar studies (Dadhich et al., 2015; Genovese et al., 2015).
It has to be noted that the study deploys cradle-to-gate analysis, where the assessment involves a
partial product life cycle assessment from resource extraction (cradle) until it is packed at the
factory, before it is transported to the customer (gate) (Guinee, 2002). Based on the aims of the
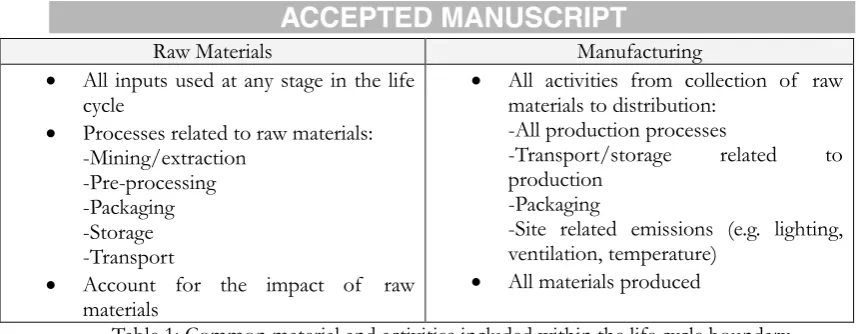
study, the system boundary is determined in order to account for individual impact assessments
11
Raw Materials Manufacturing
All inputs used at any stage in the life
cycle
Processes related to raw materials:
-Mining/extraction -Pre-processing -Packaging -Storage -Transport
Account for the impact of raw
materials
All activities from collection of raw
materials to distribution: -All production processes
-Transport/storage related to
production -Packaging
-Site related emissions (e.g. lighting, ventilation, temperature)
[image:14.595.72.502.53.220.2] All materials produced
Table 1: Common material and activities included within the life cycle boundary
The Functional Unit (FU) of the LCA is a measure of the function of the studied system and
provides a reference to which the inputs and outputs can be related. According to ISO 14040
standards, the FU is defined as ‘the quantified performance of a product system for use as a
reference unit in a life cycle assessment study’. In studies of thermal insulation products, the
thermal resistance R, measured in m2K/W, has been generally accepted as a meaningful and
operational functional unit (Schmidt et al., 2004). The R-value is the measure of resistance to
heat flow through a given thickness of material. Therefore, the higher the R-value, the more
thermal resistance the material has and the better its insulating properties (Schmidt et al., 2004).
In addition, it also gives information about the amount of insulation material that is required to
achieve a certain thermal resistance within the product’s lifetime. This consequently enables the
comparison of two different products. This is arguably a very simplistic method to compare the
performance of two insulating materials when the available information is the thickness of the
material and the thermal conductivity. Heat moves in a number of different methods and the
R-value only takes into account conduction. The U-R-value provides a more robust representation of
the thermal insulation property of an insulation product. The calculation of U-value takes into
account the three major ways in which heat loss occurs: conduction, convection and radiation.
Nevertheless, the R-value is selected as the functional unit due to the availability of information
for analysis and its adequate robustness as a meaningful and operational functional unit (Schmidt
3.2 Supply Chain Mapping
The output of the LCA will be organised and presented in graphs reporting the total carbon
emissions and the breakdown of the emission hotspots. In addition, tables (reporting the supply
chain inputs, input category, related quantities, reference units, emissions intensities per reference
units, total emissions, emissions percentage over total) for both the recycled insulation product
(resulting from the circular supply chain) and stone wool one (resulting from the linear supply
chain) will be presented in the Appendices section, while supply chain maps will visually
represent the interaction between different entities (Dadhich et al, 2015). According to Koh et al.
(2013), a supply chain map can be used to provide clear understanding of the flow of materials
and the environmental impacts along the supply chain. This will then form the basis for
benchmarking the environmental performance of the supply chains for both products and
identify ways to manage the impacts.
The phases from upstream to downstream of the supply chain will be classified in the supply
chain maps and their related emissions (en) amount will be colour-coded within thresholds
shown in Table 2.
Impact Interval Colour-code
Low en≤ 1.00%
Moderate 1.00% ≤ en≤ 5.00%
High 5.00% ≤ en≤ 10.00%
Very high en≥ 10.00%
Table 2: Colour-code for emissions (Dadhich et al., 2015)
3.3 Case study of insulation materials
The case study focuses on the environmental implications and performance of two insulation
products that directly compete with each other in the same market segment. Commercial names
of the products will not be disclosed for confidentiality reasons. The first product, resulting from
13
indicated as P1); the second product – based on stone wool - is a common insulation type in the
construction industry and produced from molten rock (in the following, it will be indicated as
P2).
Data for the supply chain of P1 has been obtained from the UK distributor of the product, and
are complemented with secondary data from Ecoinvent (2010). Similarly, Ecoinvent (2010)
database was utilised to extract data related to the supply chain of P2. Due to the potentially
diverse end-of-life scenarios for both types of insulation products, making direct comparison is
very difficult. Even more so, the expected service life of many insulation products is relatively
long, which is around 50 years (Murphy and Norton, 2008). Thus, the results from the LCA are
considered for the ‘cradle to gate’ part of the supply chain only. This includes the input of raw
material, the production process, and up to but not including the distribution to final customer.
The study also did not include the emissions associated with the installation of the product, its
usage and disposal. The stages within the manufacturing of P1 up until the packaging at plant is
[image:16.595.94.508.418.617.2]shown in the process map in Figure 2.
Figure 2: Supply chain of P1
As a direct comparison, the typical production process of P2 is shown in Figure 3.
[image:16.595.98.500.657.723.2]The electricity source used in the processes for P2 manufacturing is based on the medium
voltage electricity generated and transmitted for industrial use in the United Kingdom; for P1,
the medium voltage electricity mix for France (where the product is primarily manufactured) is
considered.
3.4 Data Collection
As mentioned in the previous section, the carbon emissions implications of the supply chain of
the two types of insulation products being studied are obtained from both primary and
secondary sources. The primary data is collected through direct communication with the
company manufacturing P1 via face-to-face meetings, interviews, company reports and emails,
while secondary data are sourced directly from Ecoinvent (2010) database. Ecoinvent is an online
database with comprehensive Life Cycle Inventory (LCI) datasets (Wiedmann et al., 2011). The
following specific information was provided by for P1:
The quantity of collected clothes for recycling and its proportion in terms of collection
methods.
The distance of transportation and types of transportation used for movement of
materials in the supply chain.
The quantity of energy consumption (electricity and gas) within the supply chain.
Types and quantity of chemicals used in product treatment
The process map of P1 production, from raw material to final product
From Ecoinvent (2010), the cumulative effects of emissions are presented using kilogram of
CO2 equivalents (kgCO2-eq) related to the unit input over a 100-year period. For the stone wool
(P2) insulation product, the quantity of materials for each Functional Unit (FU) is derived from
Ecoinvent (2010) database. As for P1, the data given by the distribution company allows the
15
are multiplied with the emissions intensity per unit obtained from Ecoinvent (2010) and the total
is summed up to give the total emissions of each product’s supply chains.
The quantitative analysis from LCA is complemented by qualitative analysis through an interview
with a P1 company representative. Interviews enable further in-depth details and information to
be secured and supplement the quantitative data available. The interview was conducted
face-to-face while the interview participant was selected from a list of personnel directly involved in the
insulation industry. The main purpose of the interview was to dissect the cost elements of
manufacturing the circular (P1) and linear (P2) and product alternatives, as well as identifying the
market challenges associated with the implementation of circular economy practices in the
insulation materials industry. The majority of the questions asked in the interview were
close-ended questions, set for exact and precise answers. Nevertheless, some open-close-ended questions
were also laid out to gauge the dynamics of the insulation materials market, especially from the
perspective of manufacturers adopting a circular supply chain.
4. Data Analysis
4.1 Preliminary findings
The functional unit for this research was defined according to a proposal from the Council for
European Producers of Materials for Construction (CEPMC, 2000). The product lifespan is
considered to be 50 years, with a R-value of 1 m2K/W. The same unit is used in the criteria for
EU eco-labelling of insulation materials (Schmidt et al., 2004). It has to be noted however, that
stone wool insulation materials come in a variety of brands and produced by different
manufacturers. P1 has a thermal conductivity, , of 0.039 W/mk while the P2 stone wool
insulation product chosen for this study has a thermal conductivity of 0.035 W/mK.
A d R F U
Where:
R is the thermal resistance to be obtained, assumed equal to 1 m2K/W,
is the thermal conductivity, which is 0.039 W/mK for P1 and 0.035 W/mK for P2;
d is the density of the insulation products = 20 kg/m3 for P1, 38 kg/m3 for P2;
A is the area of the insulation material to be considered (assumed equal to1 m2).
The resulting unit in kilograms necessary to provide a thermal resistance of 1 m2K/W for a use
period of 50 years (Schmidt et al., 2004) is therefore shown in Table 3.
Material Thermal conductivity,
(W/mK)
Density (kg/m3)
Functional Unit (kg)
Corresponding insulation thickness (mm) P1
(Circular)
0.039 20 0.78 39
P2 (Linear)
0.035 38 1.33 35
Table 3: The functional unit (in kg) necessary to provide a thermal resistance of 1 m2K/W for a use
period of 50 years (Schmidt et al., 2004)
The preliminary data supplied by the company distributing P1 provided a comprehensive
overview of the entire supply chain of the product, from collection of denim cottons to the
packing process of the finished products. Each year, an average of 11,000 tonnes of clothes are
collected to be processed as inputs for the production of P1. The clothes are collected using
various methods in two types of sacks:
i) Type 1 sacks are made of High Density Polyethylene (HDPE). The manufacturing
companies, distributes 15,000 sacks each day for three times a week, with each sack
weighing 12 grams.
ii) Type 2 sacks are made from HDPE and weighs 18.5 grams each.
17
i) Door-to-door collection – sacks are distributed to individuals and later collected.
ii) Collection in container – individuals deposit the clothes in different containers
located in various locations in France.
iii) Collection among local groups – Annually, 730 tonnes out of the 11,000 tonnes of
clothes used in the production of P1 are collected from local groups.
The main methods of transportation used in transporting materials between the main
production locations are lorries ranging from 3 tonnes up to 24 tonnes. In some cases, small vans
are also utilised, specifically in the collection of clothes as input material. Another mean of
transport utilised in the production of P1 is sea freight, where the bi-composite polyester binder
manufactured in South Korea are transported (for 19,663 km) from Busan port to Le Havre in
France.
The electricity used in the manufacturing process comes from the Électricité de France (EDF)
grid, converted to medium voltage for use in the manufacturing facilities. The electricity
consumption in different stages of the manufacturing process ranges from 0.0018 kWh to
0.3787 kWh for each Functional Unit of insulation material produced.
A summary of the quantitative data collected for the manufacturing processes of P1 and P2,
along with associated environmental impacts, is shown, respectively, in Appendices A and B.
4.2 Supply Chain Mapping
The results of the analysis directly compare the carbon emission implications of producing
insulation material using recycled sources (P1) through a circular open-loop supply chain
compared to the production of stone wool insulation material (P2) through a linear production
system. Results are summarised in Figure 4 while detailed breakdown of the supply chain
Using the methodology discussed in Chapter 3, the analysis shows that the emissions from the
supply chain of stone wool (1.5090 kgCO2-eq) is 64.02% higher than that from the production
of P1 (0.9200 kgCO2-eq). This preliminarily indicates that the emissions of P1 (the insulation
product produced from a circular open-loop supply chain) are significantly lower than that
produced from a linear supply chain. In addition, as P1 is produced mainly from waste cottons,
the emissions that would have been generated from waste disposal are also avoided.
Figure 4: Comparative levels of emissions by P1 and P2 supply chains
The breakdown of CO2-eq emissions for both P1 and P2 is presented in Figure 5.
Figure 5: Breakdown of carbon emissions hotspots in P1 and P2 supply chains
It can be observed from the graph that within both supply chains, chemicals are the main
“hotspots” for both P1 and P2 as there are a number of different chemicals used for product
treatments. For P1, this contributes to 39.71% of the total emissions, which are caused by the
19
insulation materials. As for P2, the proportion of emissions contributed by chemicals is also
significant at 30.12%; with phenol, urea and formaldehyde combining to a total of 27.75%; these
are mainly the components for the binder (Pilato, 2010).
The environmental benefits from adopting circular supply chains can therefore be investigated in
terms of the types of chemicals required for product treatment to produce insulation materials
of identical thermal performances. The total emissions from chemicals required for treatment in
the production of P1 is 0.3653 kgCO2-eq, which is 19.64% lower than the emissions due to the
chemicals used in product treatment for P2. This implies that the use of recycled cotton in the
circular supply chain for P1 enables the input material to be treated with chemicals with lower
environmental impact, compared to the linear supply chain.
Electricity is also a significant hotspot for both products’ supply chains although it is much more
prominent for P2 supply chain at 25.02% while the electricity emissions from P1 supply chain is
75.15% lower than P2 at 0.0938 kgCO2-eq. This is due to the French electricity mix used in the
production of P1. Further discussion on this aspect is provided in Section 5.
Transport is another major hotspot in P1 supply chain, forming 6.35% of the total carbon
emissions. This is significantly higher than P2 where transport constitutes only 2.51 percent of
the total emissions. The main proportion of the carbon emissions from the transport element of
the P1 supply chain is from the clothing collection stage. As stated earlier, for P1, cotton clothing
are collected from all around France using various methods with collection from containers
forming 70.00% of the total annual input of clothes and consequently contributing to 4.01% of
the total emission of P1. The average distance for collection from each container is 180 km,
using 3 tonne lorries at average fill rate of 70%. This is another aspect that will be discussed
further in Section 5.
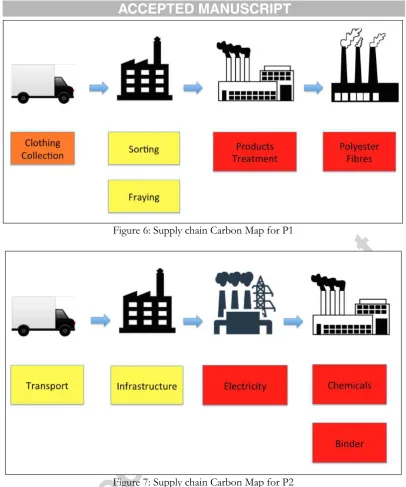
The identification of carbon hotspots enables the impact of each phase of the materials’ supply
Figure 6: Supply chain Carbon Map for P1
Figure 7: Supply chain Carbon Map for P2
The supply chain carbon map of P1 in Figure 6 presents the upstream and downstream carbon
emissions of the product supply chain obtained using process LCA methodology. The main
activities in the supply chain are the collection of clothing for recycling, sorting and fraying of
the clothings, chemical treatment of the product and the manufacturing of the polyester fibres,
which are used as binder for the material. Figure 6 reiterated the finding that product treatment
activities and the manufacturing of bi-composite polyester binder are the main hotspots within
the supply chain. This analysis estimates that product treatment activities contribute to 68.21%
21
for 21.06% of the emissions. It has to be noted, however, that in both of these elements, the
electricity used in the processes is also taken into account.
A slightly different approach was taken for the linear alternative, P2, where the electricity element
is accounted separately. As shown in Figure 7, for P2, product treatment chemicals and binder
material are the major carbon hotspots in the supply chain with each respectively responsible for
30.12% and 17.06% of the supply chain carbon emissions. As it turns out, electricity is another
major carbon hotspot, contributing to 25.02% of the carbon emissions. This is mainly attributed
to the UK electricity grid, which still generates a major proportion of its electricity from
non-renewable sources such as coal and natural gas.
4.3 Interview
An interview was conducted with the Director of the distribution company of P1 in the UK.
The semi-structured interview was conducted face-to-face. The main issues and response from
the interview are presented in Table 4.
Based on the interview, several potential interventions have been identified by the company
distributing P1 in the UK for further reducing the total emissions of the product. One of these
is the change of the bi-composite polyester binder to a biological binder. This effectively
corroborated with the findings of the analysis using supply chain mapping which identified the
manufacturing of the binder as one of the major hotspots in the supply chain. The company
believes that finding a binder that can provide optimum product performance while at the same
time reducing the total carbon emissions from its life cycle will be the key to improving the
environmental credentials of P1.
However, marketing a product manufactured through a circular supply chain presents major
challenges in the industry, as the company believes that customers within the industry are more
concerned with the price and performance of the insulation product, rather than the
challenge in making the price of their product competitive, as in the UK, many conventional
insulation products receive subsidies from the government through several energy efficiency
schemes operated by central and local government. These findings are consistent with results
from Genovese et al. (2015), who stated that, in the current free-market economy, products
resulting from circular supply chains may not be an economical alternative.
Also, it seems that the existing P1 customers already have some understanding and awareness on
sustainable products. However, the company strongly believes that the general public should be
better informed on the environmental credentials of the insulation products that they are using.
This awareness can be cultivated from the provision of greater incentive from the government to
encourage the purchase of products that can reduce the environmental impacts from activities
such as new construction or renovation projects.
Issues Response
Market condition Stone wool is the main product for
conventional insulation. In the green segment, sheep wool has been introduced.
Customers DIY people, home owners. Musicians, for their
acoustic studios. Local authorities. Architects might specify it for customers who want green products. People who have some understanding on what makes something sustainable.
Marketing challenge for P1 People buy on price, full stop. When they buy
insulation, they look for the cheapest. They might look for performance. They might not look for carbon emissions cost.
Raw material There isn’t any problem with it. It is easily
accessible. We want to change the binder to bio binder. We are doing an R&D on that now. The denim cottons are collected in France. They
have collection bins in France. They’re getting
[image:25.595.71.500.352.618.2]it for free.
Table 4: Main themes and response from interview
5. Discussion
In this section, different scenarios are modelled and potential strategies are identified to reduce
the environmental impacts of the insulation materials supply chain. Two main scenarios are
considered for the analysis: The electricity mix, and the configuration of the clothing collection
23
5.1 Scenario 1: The electricity mix
Energy sources are an important driver of environmental impacts that have to be considered
when performing LCA (Bousquin et al., 2012). The analysis presented in Section 4 has revealed a
significant difference in environmental impacts related to the use of electricity between the
production processes of P1 and P2, with emissions related to the use of electricity in the
manufacturing of P1 being 75.15% lower than the ones related to P2. Therefore, a deeper
analysis of the role played by electricity inputs is performed.
In the data presented in Section 4, the scenarios considered in terms of electricity generation are
based on the actual situation for production of both types of insulation products. P1 is
manufactured and packed in France. Therefore, the emissions intensity figures considered for the
electricity generation and transmission in the life cycle of P1 are based on France’s energy mix
(0.0946 kgCO2-eq). Meanwhile, the production facilities of P2 are located in the United
Kingdom, where the emission intensity for electricity is 0.6044 kgCO2-eq. This is 538.90%
percent higher than the emissions figure for France (Ecoinvent, 2010). This significant difference
co-relates with the study by Holdway et al. (2010) shown in Table 5.
Country Average emissions (g CO2/kWh)
United States 605
United Kingdom 543
France 88
Table 5: Average CO2 emissions from electricity generation (Holdway et al., 2010)
This difference in the figures can be interpreted through the proportions of electricity in the
respective countries generated from fossil fuels. It was found that 66% of the electricity in the
US, 62% in the UK and just 5% in France (U.S. Energy Information Administration, 2015;
Department of Energy and Climate Change, 2014; Le réseau de l’intelligence électrique, 2015)
are generated from fossil fuels. In France, 77% of the electricity produced in 2014 was from
solar (Le réseau de l’intelligence électrique, 2015). This explains the very low level of carbon
emissions associated with grid-connected electricity in France.
5.1.1 Different country location of production facilities (different grid electricity mix)
In order to investigate the impact of different scenarios involving the source of energy used in
the production of P1 and P2, electricity inputs from different European countries were
considered. The countries considered for this analysis are the production locations of the five of
the main producers of stone wool insulation products (similar to P2), which together account for
95% of total production in Europe (Ecofys, 2009). The distribution of these plants is shown in
Table 6; it can be seen that the production facilities for top stone wool producers in Europe are
located in 20 European countries. Each country has different electricity mix and the impact of
locating production facilities in these countries will be modelled into this analysis. Although the
entire production and supply chain of P1 is mainly based in France, a similar modelling approach
is adopted to investigate the impacts of having different electricity inputs from power grids of
different countries. The analysis was conducted with the assumption that all other factors such as
power consumption, transportation types, distances, production efficiency and inputs would
remain constant. Only the electricity input to the production facilities of both materials would be
the variable for this analysis; while this assumption may be quite unrealistic (as local supply chain
inputs and their associated environmental impacts may differ significantly in different countries),
it allows getting a first understanding of the influence of the electricity mix on the overall
environmental impacts of products P1 and P2.
Based on the graph in Figures 8, the country with the lowest carbon emissions for the
production of P2-type products (stone wool) is Sweden, followed by France and Belgium. In
Sweden, 35.50% of its electricity mix is from renewable energy sources and 32.50% is from
nuclear generation (International Energy Agency, 2013). This is reflected on the results shown in
25
total emissions from its supply chain by 0.72%. The difference is more significant for P2, as
utilising Sweden’s electricity mix rather than the UK’s, would reduce the total emissions by
19.95%. Interestingly, the graph in Figure 8 also highlighted that the production of P1 is more
electricity intensive than that of stone wool insulation.
The analysis indicated that utilising some country’s electricity mix (such as the ones of Poland,
Czech Republic, Greece and Ireland) may significantly increase the total emissions of the supply
chain of P1, to the extent that it becomes higher than the total emissions of producing stone
wool insulation in that particular country (International Energy Agency, 2013).
The analysis therefore establishes that re-locating production facilities can potentially enable
manufacturers of both products to reduce the carbon emissions from their supply chains.
However, this will require a significant supply chain re-design with substantial capital investment.
The case for changing the electricity mix is even stronger for stone wool manufacturers as the
emissions reduction will be more significant. P1 production facility, on the other hand is already
operating in a country where the electricity mix from the grid is exhibiting very low emissions
intensity, being among the lowest in Europe.
It can also be observed from the graph that if P1 is produced in the UK, its total life cycle
carbon emission would be only 5.52 percent lower than that of stone wool.
These findings reiterate that while circular supply chains may offer obvious insights in terms of
lower levels of virgin resources consumption and waste sent to landfill, advantages in terms of
other environmental indicators (such as carbon emissions) might be carefully evaluated and
optimised through an appropriate design of the supply chain (Das and Posinasetti, 2015).
Country Facilities Country Facilities
Austria 1 Italy 2
Belgium 1 Lithuania 3
Czech Republic 3 Netherlands 2
Denmark 3 Poland 8
Finland 8 Romania 2
France 6 Slovakia 1
Germany 11 Slovenia 2
Greece 1 Spain 4
Ireland 1 United Kingdom 5
Table 6: Number of mineral wool installations per country (Ecofys, 2009)
Figure 8: Total carbon emissions of insulation materials’ supply chains produced in different countries
5.1.2 Micro Renewable Generation Schemes
As insulation material manufacturers have little or no control on the country’s electricity mix,
another potentially feasible approach that can be considered in efforts to reduce carbon
emissions from the electricity is by commissioning micro-renewable generation schemes. Based
on the assumption that the micro-renewable generation scheme caters for 100 percent of the
production facility’s electricity demand, the total carbon emission for production of both P1 and
P2 is calculated. According to the Department of Energy and Climate Change (2011), there are a
range of micro generation technologies available for commercial scale applications. These
27
The scenario is modelled by using emissions intensity values from Ecoinvent (2010) database of
a range of renewable electricity generation schemes. Similar to section 5.1.1, these values are
incorporated in the process LCA, replacing the emissions intensity of medium voltage electricity
obtained from the grid of the country where the products are produced and assuming that all
other elements such as power consumption remain constant. The results of this analysis are
[image:30.595.74.517.234.476.2]shown in the graph in Figure 9.
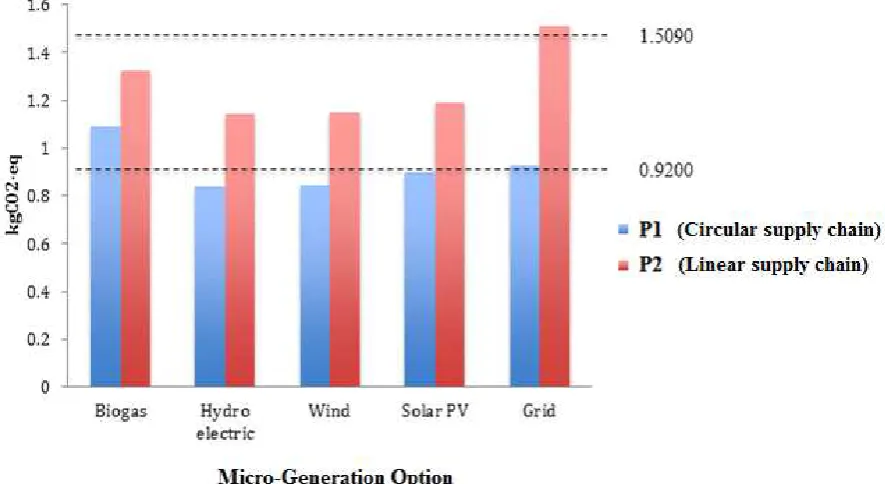
Figure 9: Carbon emissions of supply chains of insulation materials produced with renewable sources
The result of the analysis indicates that switching to renewable energy sources in the production
of both P1 and P2 generally reduces the total carbon emissions from the supply chain. The only
exception is switching to electricity generated using biogas for P1, where the total emissions will
actually increase by 16.08%. This is opposed to P2 case, where switching to biogas will reduce
the total emissions by 18.57% to 1.3233 kg CO2-eq. This is mainly attributed to the UK grid in
which stone wool production facilities are connected to, which exhibits high emissions intensity
The renewable energy scheme that gives the highest amount of reduction in emissions for both
P1 and P2 supply chains is hydro electricity with reductions of 9.02% and 36.72% respectively.
Although the findings imply that hydro electricity generation may help to significantly reduce the
supply chain carbon emissions of both products, the feasibility of commissioning such scheme
at a micro-level needs to be investigated further. Running a hydroelectric generation scheme
involves harnessing the energy from flowing water to generate electricity, which may only be
feasible if the production facilities are located near flowing water sources such as river streams.
Consequently, the impact to the local environment, particularly fish and the river ecosystem need
to be carefully assessed prior to any construction of such schemes.
The next type of renewable generation scheme that can help reduce the lifecycle emissions of
both types of insulation products is wind energy, with potential reductions of 8.27% for P1 and
36.09% for P2, resulting in total emissions of 0.8373 kg CO2-eq and 1.1481 kg CO2-eq
respectively. Micro wind generation schemes are growing in Europe with good progress being
seen in the development of standards for such schemes (Department of Energy and Climate
Change, 2011). The Committee on Climate Change (2011) had identified that wind energy is a
feasible replacement solution to non-reliable energy sources, as a great percentage of
geographical locations in Europe have access to stable and reliable wind sources. Just like any
other renewable generation schemes, the energy generated from wind turbines are intermittent
and might not be able to match peak or off peak demand. Therefore, reliable electricity storage
system should also be put in place. Alternatively, the manufacturing facility may also utilise a mix
of both wind generation scheme and grid connected electricity to address this problem.
The use of solar photovoltaic (PV) schemes is also another example of how the total emissions
from the supply chain can be reduced by utilisation of the renewable sources rather than
depending on grid connected electricity. However, similar issues to both hydroelectric and wind
power generation schemes need to be addressed in order to adopt solar PV as a feasible
29
5.2 Scenario 2: Configuration of clothing collection methods
This analysis will focus solely on P1, as the process involved, which is the collection of clothings,
is only applicable to this circular supply chain. The supply chain map shown in Section 4 implies
that transport, which forms the main element in the clothing collection process, is also a major
carbon hotspot in the supply chain and categorised as a high impact element, which contributes
to 6.31% of the total emissions. A significant proportion of this is attributed to the transport
during clothing collection phase, with 5.69% of the overall emissions, where 3.98% of the total
emission is from collection of clothes in containers. Collections from containers also form 70%
of the total clothing collection. Therefore, this analysis will model different scenarios of clothing
collection in containers to identify the configuration that will be able to reduce the existing
carbon emissions. At present, clothes are collected from containers twice a week using 3 tonne
lorries with a fill rate of 70 percent. This configuration results in 0.0369 kgCO2-eq of emissions
per functional unit. The analysis is conducted by changing the frequency of collection from the
containers from twice a week, to a number of different frequencies. The types of vehicles used
are also adjusted according to the frequency of collection, based on the assumption that the fill
rate for each collection remains at an average of 70 percent.
The result of the analysis is shown in Table 7. The analysis shows that changing the type of
collection vehicle from 3.5T to 7.5T lorry to a bigger 7.5T to 16T lorry without changing the
frequency of collection reduces the total emissions by 2.12 percent. However, noting that the
current average fill rate is 70 percent, switching to a bigger vehicle without changing the
frequency of collection means that the fill rate will be significantly reduced. Although the bigger
capacity lorries exhibits less carbon emission, the economics of using a bigger collection vehicle
needs to be investigated further in terms of its fuel consumption and maintenance.
Frequency Type of Vehicle Total Emissions (kg CO2-eq)
Twice a week (Base) 3.5T – 7.5T lorry 0.9200
Once a week 7.5T – 16T lorry 0.8918
Once in 2 weeks 7.5T – 16T lorry 0.8875
Table 7: Scenario analysis of different clothing collection configuration
The analysis also shows that reducing the frequency of collection from containers will reduce the
total emissions from the life cycle of P1. The result of the analysis shows that reducing the
frequency of collection to once in a week reduces the total emissions by 3.07% compared to the
base scenario and reducing the collection frequency to once in two weeks reduces the total
emissions by 3.53% from the base scenario. This is achieved through reduced total transport
distance, as well as the utilisation of lorries with bigger capacity, which evidently exhibits lower
emissions intensity. Reducing the frequency of collection from containers located all over the
country means that the manufacturer of P1 will need to allocate bigger storage facilities to store
a bigger amount of clothes for a longer period. This will ensure a steady supply of material input
for the next stages of manufacturing of P1.
5.3 Further Opportunities
The potential of adopting a more closed-loop supply chain through the recycling of end-of-life
P1 insulation materials can also be explored. This can initially complement the existing input of
waste cotton material before potentially being developed further to become another major
source of input material. As regards P2 supply chain, some major stone wool insulation
manufacturers are already exploring the potential of adopting a closed-loop circular supply chain
by utilising their own waste insulation material as production inputs for new materials
(Rockwool, 2013; Paroc, 2014). Some of these companies have even developed reverse logistics
mechanisms to propel the concept forward within their organisations.
The availability of such closed-loop processes for both P1 and P2 could significantly modify the
31
6. Conclusions
In the last decades, green and sustainable supply chain management practices have been
developed, trying to reduce negative consequences of production and consumption processes on
the environment. In parallel to this, the circular economy discourse has been propagated in the
industrial ecology literature and practice. Circular economy pushes the frontiers of
environmental sustainability by emphasising the idea of transforming products in such a way that
there are workable relationships between ecological systems and economic growth.
In this paper, through a case study from the construction industry, the performances of
traditional and circular production systems have been compared.
Specifically, the research has compared the environmental impacts of the supply chains of two
different types of insulation materials. The study aimed to identify whether the circular supply
chain of the insulation material P1, which is made from recycled materials, exhibits lower carbon
emissions than P2, which is produced through a traditional linear supply chain from virgin raw
materials. The analysis was conducted using traditional process LCA methodology, utilising a
combination of data provided by the industry and a reliable database, which is utilised by
worldwide practitioners of LCA methodology. This has allowed the calculation and analysis of
the total lifecycle emissions of the products being studied. In addition, supply chain carbon maps
were derived, hence providing a greater visibility of the supply chain. The modelling of different
scenarios enables the identification of potential strategies to reduce the environmental impacts
of the two products.
The results from this research indicated that P1, which is the insulation material produced within
a circular supply chain exhibits lower total carbon emissions within its production life cycle
compared to stone wool insulation material which typically follows a linear supply chain route in
its production life cycle. Supply chain carbon mapping showed that the use of chemicals in the
treatment of both types of insulation products contributed to significant proportions of the
dominate a larger proportion of the total emissions of the circular supply chain compared to the
linear one This is mainly due to the clothing collection phase further upstream of P1 supply
chain, which is transport intensive. Qualitative discussion resulting from an interview with
industry stakeholders however questioned the economic viability of the circular supply chain.
One of the limitations of the research is the reliance on secondary data for the undertaking of
the process LCA exercise. Another limitation in this study lies in the traditional process LCA
methodology itself. As discussed in the literature review, its restricted system boundary is an
issue that needs to be addressed in order to increase the accuracy of the environmental impact
assessment.
In terms of future researches, more environmental indicators should be considered in order to
perform a much more robust comparison between a linear and circular supply chain system.
Apart from the Global Warming Potential (GWP), the measurement of other categories such as
land and water usage and ozone depletion may provide more holistic overviews of the
environmental impact associated with the supply chains. In addition, the bottom-up process
LCA methodology used in this research could be integrated together with the top-down
environmental input-output methodology to develop a hybrid LCA framework (Genovese et al.,
2015). This will effectively resolve the complexity issue associated with LCA as discussed in the
literature review of this research.
Also, attention will be devoted to the cited economic implications, in many cases representing
33
Acknowledgements
The research related to this paper has been partially supported by the project entitled Promoting
Environmentally Sustainable SMEs – PrESS (Project Number:
538851-LLP-2013-UK-ERASMUS-EQR), funded by the Erasmus Lifelong Programme from the European
Commission.
The authors also thank David Garlovsky (from Recovery Insulation Ltd.) and Alexandre Obert
References
Andersen, M. (2006). An introductory note on the environmental economics of the circular
economy. Sustainability Science, 2(1), 133-140.
Ayres, R.U., Kneese, A.V., (1969). Production, consumption and externalities. The American
Economic Review. 59(3), 282-297
Beamon, B.M., (1999). Measuring supply chain performance. International Journal of Operations
and Production Management, 19(3), pp. 275-292
Bousquin, J., Gambeta, E., Esterman, M., Rothenberg, S. (2012). Life Cycle Assessment in the
Print Industry. Journal of Industrial Ecology, 16, S195-S205.
Braungart, M., McDonough, W., Bollinger, A. (2007). Cradle-to-cradle design: creating healthy
emissions - a strategy for eco-effective product and system design. Journal of Cleaner
Production, 15(13-14), 1337-1348.
Carlson-Skalak, S., Leschke, J., Sondeen, M. Gelardi, P. (2000). E Media's Global Zero: Design
for Environment in a Small Firm. Interfaces, 30(3), 66-82.
CEPMC (2000). Guidance for the provision of environmental information on construction
products. Council for European Producers of Materials for Construction, Belgium.
Dadhich, P., Genovese, A., Kumar, N. and Acquaye, A. (2015). Developing sustainable supply
chains in the UK construction industry: A case study. International Journal of Production
Economics, 164, 271-284.
Das, K., Posinasetti, N. R. (2015). Addressing environmental concerns in closed loop supply
chain design and planning. International Journal of Production Economics, 163, 34-47.
de Burgos, J.J., Lorente, J.C., (2001). Environmental performance as an operations objective.
International Journal of Operations & Production Management, 21(12), 1553-1572.
Department for Communities and Local Government (2006). Code for Sustainable Homes: A
step change for sustainable home building practice. Department for Communities and Local
35
Department of Energy and Climate Change, (2011). Microgeneration Strategy. [online] Available
online at:
https://www.gov.uk/government/uploads/system/uploads/attachment_data/file/48114/20
15-microgeneration-strategy.pdf [Accessed 4 Aug. 2015].
Department of Energy and Climate Change, (2014). Digest of United Kingdom Energy
Statistics 2014. Available online at:
https://www.gov.uk/government/uploads/system/uploads/attachment_data/file/338768/
DUKES_2014_internet_content.pdf [Accessed 20 Jul. 2015].
Ecofys (2009). Methodology for the free allocation of emission allowances in the EU ETS post
2012: Sector report for the mineral wool industry. Available online at:
http://ec.europa.eu/clima/policies/ets/cap/allocation/docs/bm_study-lime_en.pdf
[Accessed 27 Jul. 2015].
Ecoinvent (2010). Database ecoinvent data v2.2. Swiss Centre for Lifecycle Inventories.
Ellen Macarthur Foundation (2015). Growth within: A circular economy vision for a competitive
Europe, Available at: http://www.ellenmacarthurfoundation.org/books-and-reports#
[Accessed 20th June 2015].
Ehrenfeld, J. R. (1995). Design for environment: a new framework for strategic decisions.
Environmental Quality Management. 4 (4), 37-51.
Finkbeiner, M., Inaba, A., Tan, R., Christiansen, K., Klüppel, H. J. (2006). The new international
standards for life cycle assessment: ISO 14040 and ISO 14044. The international journal of
life cycle assessment, 11(2), 80-85.
Francas, D., Minner, S. (2009). Manufacturing network configuration in supply chains with
product recovery. Omega, 37(4), pp.757-769.
Fraunhofer ISI, (2009a). Study on the energy savings potentials in EU Member States, Candidate
Innovation Research (Fraunhofer ISI; Coordinator),
Karlsruhe/Grenoble/Rome/Vienna/Wuppertal.
Genovese, A., Acquaye, A., Figueroa, A. and Koh, S. (2015). Sustainable Supply Chain
Management and the transition towards a Circular Economy: Evidence and some
Applications. Omega, doi:10.1016/j.omega.2015.05.015.
Gou, Q., Liang, L., Huang, Z., & Xu, C. (2008). A joint inventory model for an open-loop
reverse supply chain. International Journal of Production Economics,116(1), 28-42.
Guinee, J. (2002). Handbook on life cycle assessment operational guide to the ISO standards.
The International Journal of Life Cycle Assessment, 7(5), 311-313.
Harte, M. J. (1995). Ecology, sustainability, and environment as capital. Ecological Economics, 15
(2), 157-164.
Hervani, A., Helms, M. and Sarkis, J. (2005). Performance measurement for green supply chain
management. Benchmarking: An International Journal, 12(4), 330-353.
Holdway, A., Williams, A., Inderwildi, O. and King, D. (2010). Indirect emissions from electric
vehicles: emissions from electricity generation. Energy & Environmental Science, 3(12),
1825.
International Energy Agency (2013). The framework: energy policy and climate change. Energy
Policies of IEA Countries. Available online at:
http://www.iea.org/textbase/nppdf/free/2013/sweden2013_excerpt.pdf [Accessed 1 Aug.
2015].
Jacobsen, N. (2006). Industrial Symbiosis in Kalundborg, Denmark: A Quantitative Assessment
of Economic and Environmental Aspects. Journal of Industrial Ecology, 10(1-2),
pp.239-255.
Jensen, A.A., Hoffman, L., Moller, B.T., Christiansen, K., Berendsen, S., Elkington, J., van Dijk,
F. (1997). Life Cycle Assessment: A guide to approaches, experiences and information