Jones, Emily J.H. and Venema, K. and Lowy, R. and Earl, R. and Webb,
S.J. (2015) Developmental changes in infant brain activity during naturalistic
social experiences. Developmental Psychobiology 57 (7), pp. 842-853. ISSN
0012-1630.
Downloaded from:
Usage Guidelines:
Please refer to usage guidelines at or alternatively
Developmental Changes in Infant Brain Activity During Naturalistic Social Experiences << This is the accepted version of the following article: Jones, E.J.H., Venema, K.M., Lowy, R., Earl, R.K., & Webb, S.J. (2015). Developmental Changes in Infant Brain Activity During Naturalistic Social Experiences. Developmental Psychobiology; which has been published in final form at [Link to final article]. This version is shared in accordance with a Copyright Transfer Agreement with Wiley>>
Emily J. H. Jones PhD1; Kaitlin Venema BA 2, Rachel Lowy BS3, Rachel K. Earl BA3, Sara Jane
Webb PhD3,4
1. Birkbeck College, University of London
2. Palo Alto University
3. Center on Human Development and Disabilities, University of Washington
4. Department of Psychiatry and Behavioral Science, University of Washington
Corresponding Author:
Emily J. H Jones
Centre for Brain & Cognitive Development
School of Psychology
Henry Wellcome Building
Birkbeck, University of London
London WC1E 7HX
phone: +44 (0)20 7631 6323
Fax: +44 (0) 207 631 6587
Abstract
Between 6 and 12 months, typically developing infants undergo a socio-cognitive
‘revolution’. The Interactive Specialization (IS) theory of brain development predicts that these
behavioral changes will be underpinned by developmental increases in the power and
topographic extent of socially selective cortical responses. To test this hypothesis, we used EEG
to examine developmental changes in cortical selectivity for ecologically valid dynamic social
versus non-social stimuli in a large cohort of 6- and 12-month-old infants. Consistent with the
Interactive Specialization model, results showed that differences in EEG theta activity between
social and non-social stimuli became more pronounced and widespread with age. Differences in
EEG activity were most clearly elicited by a live naturalistic interaction, suggesting that
measuring brain activity in ecologically valid contexts is central to mapping social brain
development in infancy.
Keywords: Interactive Specialization, Infant, EEG, social brain, video deficit effect, alpha power,
Introduction
Between 6 and 12 months, typically developing infants undergo a socio-cognitive
‘revolution’ (Tomasello, 1995). During this period, infants begin to engage in joint attention,
early verbal communication emerges, and infants begin to actively participate in cultural scripts,
rituals and games. Whilst there is substantial understanding of the behavioral changes that occur
in this period, our understanding of the changes in the brain that underlie these behavioral
changes remains limited. Work in this area is important not only for testing theories of typical
social development, but for identifying new ways to study the mechanisms underlying the
emergence of social and communication difficulties in infants who later develop Autism
Spectrum Disorder (ASD, Jones et al., 2014).
Understanding social brain development requires an organizing theoretical framework.
Traditional views of brain development contrast maturational accounts (based on particular brain
regions coming ‘online’ at certain developmental stages, supporting the development of new
abilities) with expertise-based frameworks (in which an infant’s mounting experience with social
stimuli drives the specialization of relevant neural regions). However, both accounts have
limitations in explaining available evidence (Johnson, 2010). Interactive Specialization (IS) is an
alternative new framework for understanding brain development (Johnson, 2010) that has
received significant empirical support, and makes clear and testable predictions. Under this
framework, progressive specialization is driven by competition between brain regions with
different pre-existing neurocomputational biases. New behavioral and cognitive competences
emerge through coordinated changes in the activity of networks of brain regions, rather than the
that will become the ‘social brain’ (Insel & Fernald, 2004). Empirical tests of the IS framework
thus hold the potential to accelerate our understanding of the mechanisms that underlie early
social brain development.
According to the IS framework, during development the responses of particular regions
or networks become increasingly tuned to respond to particular dimensions of social stimuli. For
example, a brain region may initially respond to both upright and inverted faces, but over
developmental time responses may become specific to upright faces. Such tuningof neural
responses to particular social dimensions in the first year of life has been relatively well studied
using event-related potential (ERPs), which represent the averaged time-locked neural response
to a particular stimulus class. Broadly, work with ERPs has supported the prediction that
processing of faces (a key source of social information) become increasingly specialized over the
first year of life. For example, the N290 (a negative-going deflection over occipital electrodes
that peaks 290ms after stimulus onset) begins to show differential responses to upright and
inverted faces between 6 and 12 months of age (de Haan et al., 2002; Halit et al., 2003). The
P400 response to face inversion (a positive-going deflection over occipital electrodes that peaks
around 400ms after stimulus onset) becomes specific to human (versus monkey) faces over the
same age range (de Haan et al., 2002; Halit et al., 2003). Finally, the Nc (a negative-going
deflection over fronto-central electrodes reflecting attentional allocation) responds differently to
fearful and neutral faces at 6 but not 3-months (Hoehl & Striano, 2010). Thus, ERP evidence
supports the proposition that there are age-related increases in the specificity of particular neural
responses to critical facial dimensions over the first year of life.
Other key predictions of the IS theory have been less well studied in the infancy period.
‘non-preferred’ stimuli), the IS theory predicts that there should be a developmental decrease in the amount of cortical tissue that is sensitive to particular stimuli (e.g. responds to faces more than a neutral baseline stimulus; Johnson, 2010, Hypothesis S2a). Empirically, this proposal can
be tested by comparing neural responses to a stimulus with neural responses to an unrelated
baseline condition (such as a fixation cross). Second, as regions become increasingly specialized
there should be a developmental increase in the extent of activation of cortical tissue that is
selective for a particular stimulus type (e.g. responds to faces more than closely matched objects; Hypothesis S2b). Since such hypotheses relate to the spatial extent of activity in networks of brain regions, one way to address these questions is examining the oscillatory rhythms of the
ongoing electroencephalogram (EEG). Oscillatory rhythms in the EEG are typically driven by
the synchronized activity of large networks of neurons. Although EEG has relatively poor spatial
resolution, changes in the selectivity and sensitivity of brain activity should be reflected in the
magnitude and scalp location of changes in oscillatory power.
Spontaneous EEG can be decomposed into different frequency bands, which have been
associated with different functional correlates. There is preliminary evidence that both the theta
(4 to 6Hz) and alpha (6 to 9hz) bands may be sensitive to aspects of social brain activity in
infancy. Theta rhythm (4 to 6Hz) is thought to support species-relevant behaviors (Miller, 1991;
Orekhova et al., 2006); in human infants, theta power is often greater during social interaction
and exploratory activity. For example, theta power increases when 5-month-old infants look at a
face with a neutral expression versus a smiling face during a period of interaction (Bazhenova et
al., 2007), possibly related to the increase in social initiation attempts seen during this period. As
bubbles. Activity in the alpha band (6 to 9Hz) is often considered to reflect cortical ‘idling’. Thus,
alpha suppression is often equated with increased processing in a particular brain region. Alpha
suppression may also reflect the release of inhibition of non-essential activity in association with
the emergence of complex spreading activation processes (Klimesch et al., 2007). Consistent
with this view, observing or executing goal-directed actions elicits suppression of alpha activity
(relative to non-goal-directed actions) over central regions in 8 to 16-month-old infants (e.g.
Nystrom et al., 2010; Southgate et al., 2009, 2010). Further, making eye contact with an adult
before jointly viewing a toy elicits alpha suppression in 9-month-old infants, whilst viewing a
toy in the absence of eye contact does not (Hoehl, Michel, Reid, Parise & Striano, 2014). Taken
together, previous work shows that activity in the theta and alpha bands may be sensitive to core
dimensions of social processing in infancy. However, no studies have used theta and alpha
power to test whether there are developmental increases in the strength and topographic extent of
socially-selective brain activity.
In the present study, we examined the development of socially-selective brain activity in
the first year of life. Specifically, we examined theta and alpha EEG power during the
presentation of naturalistic social and nonsocial stimuli in 6- and 12-month-old infants. This age
range was chosen to allow us to examine brain activity around the time of the ‘socio-cognitive
revolution’ in social behavior. We chose to present naturalistic stimuli (rather than static pictures
of faces or specific social actions) in order to examine social brain function in a context that was
as close as possible to the child’s normative experiences. Thus, we examined brain responses
during both social and non-social movies (Movie format), and during a naturalistic live
interaction (Live Action format) in which infants could pay attention to either social or nonsocial
formats to identify converging evidence of social selectivity across the Movie and Live Action
formats, which would minimize potential confounds of specific stimulus classes. Of note, our
formats were not designed to allow us to ask specific questions about the source of format effects
(e.g. live vs video presentation). Rather, we sought to maximize the ecological validity of the
Live Action condition. We compared it to a highly standardized video-based presentation (Movie
condition) that has been used in several previous studies, including work with populations at
high risk for developing social problems (e.g. Orekhova et al., 2014; Tomalski et al., 2013). This
was designed to allow us to determine how the responses elicited by more standardized
video-based stimuli relate to those obtained in a more natural setting. We asked which of the two
contexts appeared to provide the clearest evidence of social selectivity, because this may be of
use to researchers examining the development of social selectivity in clinical populations. We
predicted that we would observe increased selectivity (greater differences in power between
social and nonsocial stimuli over more scalp regions) at 12 months than at 6 months. We
expected this to be reflected in greater theta power and greater alpha suppression to social versus
nonsocial stimuli, indicating increasing engagement of key brain networks by social stimuli.
Finally, we expected that the Live Action context may provide the clearest evidence of
selectivity, being maximally ecologically valid.
Methods
Participants were 117 6-month-old (51 female) and 106 12-month-old (51 female)
typically developing full-term infants. Of this group, 88 6-month-old (39 female) and 80
Action formats. Parents and their infants were recruited using a University Infant Participant
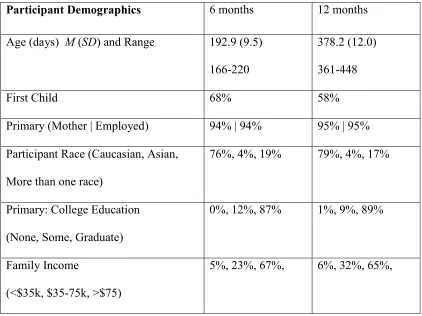
Pool. Table 1 shows demographic and descriptive data for the full sample.
<< INSERT TABLE 1 ABOUT HERE>>>
EEG recording
EEG was recorded in a shielded room from 128-channel Geodesic sensor nets; recorded
online with reference to the vertex; digitization at 500Hz; amplification at 1000x and band-pass
filtering at 0.1 to 100Hz. Children were presented with two movies of 1-minute duration repeated
twice during the session; order of presentation was counterbalanced. Movies were (a) Social:
two women telling nursery rhymes with gestures; (b) Non-Social: child-appropriate dynamic
toys (e.g. balls dropping down a chute). Similar stimuli have been used in previous studies of the
effects of socioeconomic status on brain activity (Tomalski et al., 2013) and connectivity in
infants with older siblings with ASD (Orekhova et al., 2014). After the movies were presented,
children faced an experimenter while she sang for two one-minute periods (Live Action format).
During this period, the experimenter held plain infant toys in her hands (e.g. teething rings);
infants were free to look at either the experimenter’s face (Social) or the toys in her hands
(Non-Social).
EEG processing
EEG data was segmented into 1-second segments. Segments during which infants were
not visually attending to the movie were dropped from analysis; for the Live Action format,
segments were divided (based on offline coding from video) by whether infants were
non-social aspects of the display (e.g. the toys in her hand). Artifact detection of EEG data was
accomplished with both automatic artifact-detection software (NetStation 4.3) and through
hand-editing (EJ). Segments were rejected if the signal amplitude exceeded 250 µV, or if
electro-ocular, movement or muscular artifact occurred. Channels with bad data were interpolated by an
algorithm incorporated within NetStation 4.3 (segments were excluded from analysis if more
than 20% of channels were subject to interpolation, or if there were more than 5 interpolated
channels within a scalp region). Data was then re-referenced to the average reference, and the
resulting segmented data was imported into Matlab.
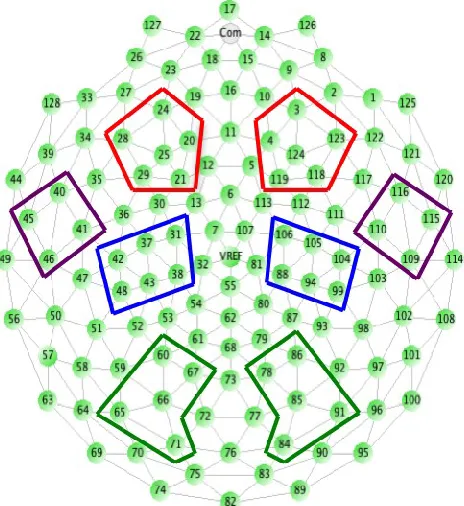
Within Matlab (using in-house algorithms) segments were detrended and subjected to an
FFT, producing power spectra for electrodes grouped within a priori regions (Figure 1). For
each segment, data from electrodes with a power value of more than 3 standard deviations from
the mean of the remaining electrodes in a topographical group in the frequency bands of interest
were dropped. Power values were then averaged across artifact-free segments and electrodes
within topographical groups; natural logs were calculated to reduce skew. Finally, logged power
values were averaged across the theta (3 to 6 Hz) and alpha (6 to 9 Hz) frequency ranges.
Participants were only included in analyses if they provided at least 5 artifact-free trials per
condition (e.g. Live Action Social condition; Live Action Nonsocial condition). This figure was
chosen based on previous work, and from examining scatter plots of the distribution of EEG
power relative to artifact-free trial numbers, which showed that power values from infants with
under 5 trials/condition appeared less reliable (e.g. more variable across nearby electrodes).
Analyses
We used repeated-measures ANOVA with Greenhouse-Geisser corrections to compare
brain activity during the Social and Non-Social Movies, and during episodes of looking to Social
and Non-Social aspects of the Live Action display. Within subject variables for both analyses
included region (frontal, temporal, parietal, occipital), hemisphere (left, right), and stimulus
(Social, Non-Social). Between subject variables were age (6- and 12-months) and sex (male,
female). Within each section, overall power effects are reported first (e.g. region, laterality, age
and sex effects), followed by main effects and interactions with stimulus (Social, Non-Social)
since these were the focus of our a priori hypotheses. We used follow-up ANOVAs to explore
any significant interactions; splitting analyses by region and/or age where indicated.
Results
Visual behavior
Infants looked more at the Nonsocial than the Social Movies (F(1,194) = 9.77, p =0.002)
and more at Nonsocial than Social elements of the Live Action display (F(1,184) = 103.75, p
<0.001). The latter was more pronounced at 12-months (Age by Stimulus interaction; F(1,184) =
19.11, p < 0.001). These differences in visual attention produced differences in the average
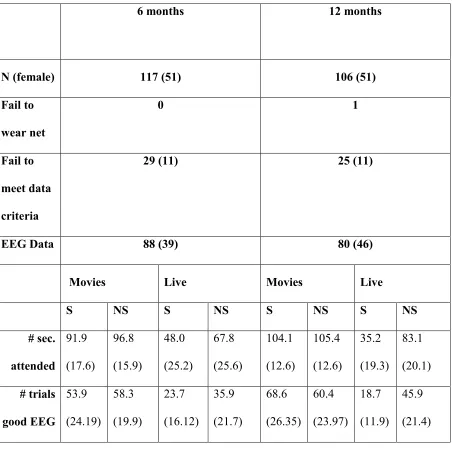
number of artifact-free segments available for each condition (see Table 2). Rather than
artificially removing segments of artifact-free data to match the number of trials per condition,
we conducted preliminary analyses to determine whether trial numbers present a significant
confound to our results. Across both alpha and theta bands, when including trial number as a
covariate in all analyses the pattern of results presented below remained the same. Further, all
artifact-free data in the Social and Nonsocial conditions (n=32 6-month-olds and n=30
12-month-olds for Movies and n=27 6-12-month-olds and n=17 12-12-month-olds for the Live Action).
Thus, differences in the number of artifact-free segments between the Social and Nonsocial
stimuli did not account for differences in EEG power reported below.
<<INSERT TABLE 2 ABOUT HERE>>
EEG Theta Power
Movies: We first examined theta power during periods of visual attention to the Social
and Non-Social movies.
Overall power: Overall theta power was greater at 12-months than 6-months (Age
F(1,164) = 18.7, p < 0.001; Age x Region F(3,492) = 39.22, p < 0.001; Age x Hemisphere
F(1,164) = 8.47, p = 0.004); greater in male than female infants (F(1,164) = 5.35, p = 0.022); greater in left than right hemisphere (F(1,164) = 81.08, p < 0.001; Hemisphere x Region
F(3,492) = 6.95, p < 0.001); and varied significantly by region (F(3,492) = 47.62, p < 0.001). These effects are illustrated in the left and central panels of Figure 2A. Examining scalp regions
separately, age-related increases in theta power were observed over frontal (F(1,164) = 53.45, p
Social versus Non-Social effects: Stimulus effects varied by age (F(1,164) = 5.18, p = 0.02) and scalp region (F(3,492) = 17.62, p < 0.001; see Figure 2A right panel). No significant
differentiation between social and non-social movies was observed over any region at 6-months
(Fs < 2, ps > 0.2). At 12 months, greater theta power to social versus non-social stimuli was seen over occipital (F(1,78) = 18.58, p < 0.001) and frontal regions (F(1,78) = 8.71, p =0.004) . No significant differentiation was observed over temporal and parietal regions at 12 months (Fs < 2, ps > 0.2). Thus, the Movie condition revealed age-related increases in the strength and topographical extent of socially-selective theta activity.
Live Action: We next examined theta power during the Live Action episode, divided into
periods of attention to Social or Non-Social aspects of the display.
Overall power: Overall theta power was greater at 12-months than 6-months (Age
F(1,164) = 10.88, p = 0.001; Age x Region F(3,492) = 20.73, p < 0.001; Age x Hemisphere
F(1,164) = 5.99, p = 0.015); greater in male than female infants (Sex F(1,164) = 8.15, p = 0.005; Sex x Region F(3,492) = 3.71, p = 0.016); greater in left than right hemisphere (Hemi F(1,164) = 46.5, p < 0.001; Hemisphere x Region F(3,492) = 2.99, p=0.035); and varied significantly by region (F(3,492) =177.21, p < 0.001). These effects are illustrated in the left and central panels of Figure 2B. Examining scalp regions separately, age-related increases in theta power were
observed over frontal (F(1,164) = 33.48, p < 0.001), parietal (F(1,164) = 12.91, p = 0.001) and temporal (F(1,164) =5.45, p =0.021) but not occipital (F(1,164) = 1.09, p =0.30) regions. Sex differences in theta power were significant over all regions (Fs > 3, ps < 0.05) but strongest over temporal and parietal regions (η2 =0.058, 0.067) and weakest over the occipital region (η2 =
frontally (η2 =0.23) and weaker occipitally (η2= 0.03). Hemisphere effects were also significant
at both ages (Fs > 8, ps < 0.001) but stronger at 12 months (η2 =0.39) than 6 months (η2 =0.09). These patterns of theta modulation by age, gender, laterality and region during the Live Action
format are very similar to those observed during the Movie format.
Social versus Nonsocial effects: Theta power was generally greater during social versus non-social attention (F(1,164) = 20.32, p < 0.001), but stimulus effects were greater at 12-months
than 6-months (F(1,164) = 8.66, p = 0.004), greater over the right than left hemisphere (F(1,164) = 4.05, p = 0.046) and varied by scalp region (F(1,164) = 19.36, p < 0.001), and age and scalp region (F(1,164) = 3.03, p =0.046). These effects are illustrated in Figure 2B. Greater theta
power during social versus non-social attention was seen over frontal regions in both age groups,
though effects were strongest in the older infants (6-months η2 = 0.06; 12-months η2 = 0.32). In
addition, in 12-month-olds only, significant effects of stimulus were observed over parietal
(F(1,78) = 25.50, p < 0.001) and occipital regions (F(1,78) = 24.02, p < 0.001). There was no differentiation between social and non-social stimuli over temporal regions at either age (Fs < 1.5, ps > 0.3). Thus, the Live Action condition also revealed age-related increases in the strength and topographical extent of socially-selective theta activity.
Summary: In both Movie and Live Action formats, we observed increases in the power
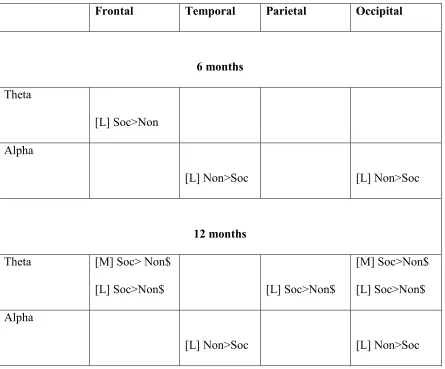
and topographical extent of socially selective theta responses between 6 and 12 months (see
Figure 2 and Table 3). Further, greater levels of socially-selective theta power in the Live Action
context correlated with better communication skills at 12 months. Thus, these results support the
prediction derived from the IS framework that there will be developmental increases in the
We did not make direct statistical comparisons between the Live Action and Movie
stimuli because they differed on multiple dimensions, including order of presentation (Movie
stimuli were always presented before Live Stimuli), format (live versus screen-based
presentation) and sequential (Movie) versus interspersed (Live) social and non-social segments.
However, it is interesting to note that inspection of Figure 2 suggests that the Live Action format
elicited more socially selective brain activity than the Movies in both age groups (see Figure 2
right panel). Specifically, socially-selective frontal theta responses were observed in the Live
Action but not Movie format for 6-month-olds. At 12-months, socially selective frontal theta
responses were detected in both the Live Action and Movie formats, but were more widespread
in the Live Action context. Our current design did not allow us to determine which difference
between the Live Action and Movie-based stimuli was the most critical in driving these effects.
However, researchers seeking to examine social brain activity in (for example) high-risk
populations may find it useful to note that following our Live Action design may be likely to
elicit stronger evidence of social selectivity in typically developing infants.
<< INSERT FIGURE 2 ABOUT HERE>>
EEG Alpha Power: Power in the alpha frequency band is reduced during active attention to a
stimulus and/or during cognitive tasks such that magnitude of the band is inversely proportional
to cortical activation (Stroganova & Orekhova, 2007). Thus, greater alpha suppression is
associated with greater cortical activation and potentially increased attention engagement. In the
present analyses, we thus expected social brain activity to be indicated by greater suppression of
Movies
Overall power: Overall alpha power was greater at 12-months than 6-months (F(1,164) = 85.82, p < 0.001; Age x Region F(3,492) = 16.50, p < 0.001); greater in left than right
hemisphere (F(1,164) = 57.70, p < 0.001; Hemisphere x Region F(3,492) = 12.61, p<0.001); and varied significantly by region (F(3,492) =48.93, p < 0.001).These effects are illustrated in the left and central panels of Figure 3A. Examining scalp regions separately, age-related increases in
alpha power were observed over all scalp regions (Fs> 40, ps < 0.001), but were strongest frontally (η2 =0.42) and weakest occipitally (η2 =0.21). Hemisphere effects were significant
across all regions (Fs > 10, ps < 0.002) but stronger parietally (η2 =0.26) and weaker occipitally (η2= 0.058).
Social versus Nonsocial effects: There were no significant effects or interactions with stimulus in the alpha band for the Movie stimuli (Fs < 2, ps > 0.2).
Live Action
Overall power: Overall alpha power was greater at 12-months than 6-months (F(1,164) = 56.75, p < 0.001; Age x Region F(3,492) = 18.60, p < 0.001; Age x Region x Hemisphere F(3,492) = 3.12, p =0.028); greater in left than right hemisphere (F(1,164) = 44.97, p < 0.001; Hemisphere x Region F(3,492) = 4.88, p=0.003); and varied significantly by region (F(3,492) =114.77, p < 0.001). These effects are illustrated in the left and central panels of Figure 3B. Examining scalp regions separately, hemisphere effects (left > right) were significant across all
related differences in alpha power were observed over all scalp regions (Fs> 17, ps < 0.001), but were strongest frontally (η2 =0.40) and weakest occipitally (η2 =0.096).
Social versus Non-Social effects: Alpha power was suppressed more during social than nonsocial epochs of attention (F(1,164) = 8.35, p = 0.004). However, this varied by scalp region
(F(3,492) = 7.32, p < 0.001). Alpha power was generally more suppressed during social than
non-social attention over temporal (F(1,164) = 5.40, p = 0.021) and occipital regions (F(1,164) = 23.28, p < 0.001) but not over the parietal region (F(1,164) = 0.006, p = 0.94) or the frontal region (F(1,164) = 0.31, p = 0.58).
Summary: Within the Live Action condition, suppression of alpha power during social
attention was observed as expected. However, across both Movie and Live Action stimuli, results
indicated that the strength and topographical extent of alpha power responses to social versus
non-social stimuli did not change over the age-ranged studied (see Figure 3). Possibly, alpha
power is a less sensitive measure of social brain development in the first year of life.
<< INSERT FIGURE 3 ABOUT HERE>>
Discussion
In this study we used EEG to investigate age-related changes in naturalistic social brain
activity in a large cohort of 6- and 12-month-old infants. We measured brain activity in response
to highly naturalistic Movie-based stimuli, and an ecologically valid Live Action condition. Our
there were significant differences in power between social and nonsocial epochs of attention that
were stronger and more widespread at 12 months than at 6 months. In contrast, although alpha
power differed by social context (with greater alpha suppression during social stimuli,
particularly in the Live Action format), there were no age-related changes in the magnitude or
extent of this effect. Of note, this difference between the two frequency bands makes it unlikely
that domain-general changes in skull thickness, brain size, or the differing number of segments
between social and non-social conditions could account for our findings. Possibly, theta
(compared to alpha) power may a more sensitive measure of social brain development in the first
year of life. Second, across both frequency bands, socially selective activity appeared stronger
and more widespread during a naturalistic episode of live singing than a more standardized
video-based presentation. These results may indicate that naturalistic live experiences engage the
developing brain more effectively than video-based stimuli, although the multiple differences
between our Live Action and Movie stimuli mean that the precise reason for differences cannot
be determined. These results are consistent with the IS hypothesis that there are age-related
increases in the strength and topographical extent of social brain activity in early development,
and suggest that EEG theta power measured in live interactive contexts may be particularly
sensitive to these changes.
<<<INSERT TABLE 3 ABOUT HERE>>>
Social Selectivity
and movie presentations included the presence of a face, direct gaze, biological motion, and
language (for review, Grossman & Johnson, 2007). Previous work suggests that neural
responses to many of these more specific features become more localized and specialized over
time (Johnson et al., 2009). The present data extends this picture by indicating that the
combination of those features (as is the case in complex naturalistic interactions) leads to an
age-related increase in the spread of specialized neural activity. The social brain includes regions
that span frontal, temporal and parietal cortices (e.g. Frith & Frith, 2007), indicating that
engagement of the full system would likely produce the kind of widespread brain activity noted
in the present study. One possibility to be tested in future work is that increased functional
connectivity between brain regions underlies this more robust and widespread activation of the
social brain network in older infants (e.g. Pandit et al., 2013).
Interestingly, whilst theta power (which is generally associated with attention)
was greater during epochs of social than nonsocial attention, behaviorally infants spent more
time looking at the nonsocial than social movie, and more time looking at the toy than the
experimenter’s face during the Live Action condition. These effects were strongest at 12 months.
Although studies with screen-based and static stimuli generally find increased attention to faces
versus other objects in infants (e.g. Elsabbagh et al., 2013), our results are consistent with
behavioral studies showing that infants actually spend relatively little time looking at people
when tested in naturalistic environments (e.g. de Barbaro et al., 2012; Yoshida & Smith, 2008).
Thus, studying patterns of social attention in naturalistic dynamic contexts is critical. Our
findings further illustrate that to understand social attention in early infancy, we must not only
examine what infants choose to look at, but also what their brains are doing whilst they look at it.
Autism Spectrum Disorder (ASD). This group of infants are at heightened risk of developing
ASD themselves, and so can be followed prospectively to identify early markers of later
diagnosis. Several recent such studies have revealed that infants with later ASD show
remarkably typical patterns of looking at social stimuli in early infancy (e.g. Ozonoff et al.,
2010; Elsabbagh et al., 2013). However, very few studies have examined brain activity during
visual attention to social and nonsocial stimuli. Our present results suggest that this may be
critical to understanding what may be different about social processing in the very early
development of infants with emerging ASD.
Specificity of EEG Frequency response
Effects seen in specific frequency bands provide further insight into social brain
development in infancy. First, frontal theta power was greater during social vs non-social
attention in the Live Action format for 6-month-olds and in both Live and Movie-based stimuli
for 12-month-olds. This is consistent with a range of evidence to suggest that frontal theta is
related to social attention (Bazhenova et al., 2007), or responds more generally to child
engagement (Orekhova et al., 2006). The present findings extend previous work by showing
significant differences in the theta response to engaging social and nonsocial stimuli, and
significant age-related increases in this differential response. Given that infants generally
showed more looking to the nonsocial stimuli, the present results suggest that frontal theta in
infancy is particularly engaged by social stimuli, and not just any stimulus that engages visual
attention. Significant increases in theta in response to social versus non-social stimuli were also
observed over parietal and occipital regions for 12-month-old infants, which is again consistent
In contrast to effects in the theta band, there were no age-related changes in differential
alpha suppression by the social and nonsocial stimuli. Of note, general age-related increases in
alpha and theta power were observed that are consistent with previous work and have been
attributed to a number of possible factors including general neuronal maturation, the
development of myelination across the cortex, changes in the orientation and density of neuronal
assemblies, and changes in the skull and supportive tissue (Marshall et al., 2002). In the present
study, epochs of social attention were associated with suppression of alpha activity over temporal
and occipital cortices at both 6- and 12-months that were observed in the Live Action format
only. The topography of this response is not consistent with ‘mu’ activity (alpha over central
regions). Further, we did not observe differential suppression of frontal alpha, which is
commonly associated with individual differences in approach and avoidance responses
(Davidson & Fox, 1989; Hane et al., 2008). Rather, since alpha is commonly interpreted as an
idling rhythm (Klimesch et al., 2007) the observed patterns may represent an increase in activity
in visual processing and language processing areas. Interestingly, it is known that language
learning between 6 and 12 months is facilitated by live versus movie-based presentation (Kuhl,
Tsao & Liu, 2003). Possibly, live presentations more effectively engage brain regions required to
integrate language and visual input. Studying how these patterns of brain activity relate to
language learning is an important step for future work.
Effects of stimulus format
The present study highlights the importance of considering the context in which social and
non-social responses are studied. We chose two very different formats to maximize
standardization (the Movie format) and ecological validity (Live Action). Broadly, our present
brain activity than the Movie-based stimuli. For example, socially selective effects were seen in
the Live Action format for 6-month-old infants, but none of these were elicited by the Movie
format. 12-month-old infants did show some socially selective patterns of brain activity in
response to the Movie stimuli, but effects were stronger and more widespread during Live
Action. Because they were designed to maximize standardization (Movie stimulus) or ecological
validity (Live stimulus) rather than be matched on multiple variables, the Live and Movie stimuli
differed on several parameters that may be of relevance to the observed findings. First, a range
of other studies have also found that infants learn more readily from live than video-based
presentations, particularly at 12 months and above (e.g. Cleveland & Striano, 2008; Barr et al.,
2007), even though infants scan the relevant parts of video-based presentations appropriately
(Taylor & Herbert, 2013). Action processing may also differ: suppression of the mu EEG
rhythm is greater in response to a live demonstration of a person producing goal-directed actions
than a video-taped stimulus at 6- to 7-months (Shimada & Hiraki, 2006) and 18- to 36-months
(Ruysschaert et al., 2013). Taken together, previous work suggests that differences in the way
that infants process live and video-based stimuli could have contributed to the differences
between the Live Action and Movie formats examined in the present report. However, there were
also other differences between the Live Action and Movie formats that could have contributed to
effects. For example, attention was possibly more endogenously driven in the Live Action
format than in the Movie format, because the child had a more direct choice between paying
attention to the experimenter’s face and the presented toy. This may lead to more effective
engagement of specialized brain regions because making a choice may elicit more ‘active’ versus
Orekhova et al., in review). In contrast, segments of social and nonsocial attention during the
movie presentations were sequential. Further work could examine the differences between
presenting both live and more naturalistic movie-based stimuli in social and nonsocial blocks
verses allowing naturalistic attention switching between competing social and nonsocial
elements. Further, the Movie format was always administered prior to the Live Action format
during testing. Systematic differences in state over time may thus confound interpretation of the
overall differences between the Live Action and Movie formats. The Movie format also featured
two women, whilst only one was present in the Live Action context; this would have affected the
relatively familiarity of the social stimulus across conditions. Other differences were that whilst
the soundtrack of the movies differed (toy noises in the nonsocial movie and women singing in
the social movie), the experimenter was always singing in the Live Action format. Further, the
Live Action format could have elicited episodes of triadic joint attention (rendering the
Non-Social condition more ‘social’ in nature), which were rare in the Movie context. However, these
latter differences would appear if anything to increase the similarly of social and nonsocial epochs in the live episode, reducing the likelihood of finding effects in the Live Action format.
Although the theoretical interpretation is unclear, the difference between results from the
Live Action and Movie formats does have several implications for future work. First, needs for
standardization versus ecological validity are often in opposition, but must be carefully
considered. Video-based sequentially presented stimuli enable the same data to be collected
across labs and processed relatively easily, a significant advantage in fields performing high-cost
longitudinal work with low-incidence participants. However, these stimuli may be less effective
at engaging relevant brain regions than more naturalistic social experiences, particularly in early
may be futile in early infancy, since such effects are not clearly seen in typically developing
infants. This study provides strong motivation for studying social brain activity in more
naturalistic settings in early infancy (see also Ruysschaerts et al., 2013). Further, the present data
also suggest that using live periods of social interaction to elicit recordings of ‘resting’ or
‘baseline’ EEG is also potentially confounded by individual differences in the degree to which
infants look at the experimenter during recording, as direction of visual attention strongly
influenced the spectral power EEG.
In summary, we demonstrated that socially-selective oscillatory theta responses increase
in power and topographic extent over the second half of the first year of life. These results are
consistent with Interactive Specialization model of brain development, although further work is
required to understand why effects were specific to the theta band and to replicate findings in a
longitudinal sample. Our work forms an important normative profile to which work with risk
groups (such as infants with later emerging autism) can be compared. Further, our results suggest
that examining brain activity during naturalistic live social episodes is critical to studying social
brain development in infancy. This has widespread implications for studies of infant brain
Notes
Support for this project was provided by an Autism Speaks Postdoctoral Fellowship and a
L’Oreal For Women in Science Fellowship (Jones), the Eunice Kennedy Shriver National
Institute of Child Health and Development (P50 HD055782 and R01 HD064820, Webb). We
thank the families who participated in the University of Washington Early Attention Study. The
References
Barr, R., Muentener, P., Garcia, A., Fujimoto, M., & Chavez, V. (2007). The effect of repetition
on imitation from television during infancy. Infancy, 49, 196-207.
Bazhenova, O. V., Stroganova, T. A., Doussard-Roosevelt, J. A., Posikera, I. A., &
Porges, S. W. (2007). Physiological responses of 5-month-old infants to smiling and
blank faces. International journal of psychophysiology, 63(1), 64-76.
Benasich, A. A., Gou, Z., Choudhury, N., & Harris, K. D. (2008). Early cognitive and
language skills are linked to resting frontal gamma power across the first 3
years. Behavioural brain research, 195(2), 215-222.
Carver, L. J., Meltzoff, A. N., & Dawson, G. (2006). Event‐related potential (ERP)
indices of infants’ recognition of familiar and unfamiliar objects in two and three
dimensions. Developmental Science, 9(1), 51-62.
Cleveland, A., & Striano, T. (2008). Televised social interaction and object learning in 14-and
18-month-old infants. Infant Behavior and Development,31(2), 326-331.
Csibra, G., Davis, G., Spratling, M. W., & Johnson, M. H. (2000). Gamma oscillations
and object processing in the infant brain. Science, 290(5496), 1582-1585.
Cuevas, K., & Bell, M. A. (2011). EEG and ECG from 5 to 10months of age:
Developmental changes in baseline activation and cognitive processing during a working
memory task. International Journal of Psychophysiology, 80(2), 119-128.
Davidson, R. J., & Fox, N. A. (1989). Frontal brain asymmetry predicts infants'
de Barbaro, K., Johnson, C. M., Forster, D., Littlewort, G., & Deak, G. (2012, November).
Sensory-motor dynamics of mother-infant-object interactions: Longitudinal changes in
micro-behavioral patterns across the first year. In: Development and Learning and
Epigenetic Robotics (ICDL), 2012 IEEE International Conference on (pp. 1-2). IEEE.
De Haan, M., Pascalis, O., & Johnson, M. H. (2002). Specialization of neural
mechanisms underlying face recognition in human infants. Journal of cognitive
neuroscience, 14(2), 199-209.
Elsabbagh, M., Gliga, T., Pickles, A., Hudry, K., Charman, T., Johnson, M. H., & BASIS Team.
(2013). The development of face orienting mechanisms in infants at-risk for
autism. Behavioural brain research, 251, 147-154.
Frith, C. D., & Frith, U. (2007). Social cognition in humans. Current Biology, 17(16),
724-732.
Gliga, T., Volein, A., & Csibra, G. (2010). Verbal labels modulate perceptual object
processing in 1-year-old children. Journal of Cognitive Neuroscience, 22(12), 2781-2789.
Gou, Z., Choudhury, N., & Benasich, A. A. (2011). Resting frontal gamma power at 16,
24 and 36 months predicts individual differences in language and cognition at 4 and 5
years. Behavioural brain research, 220(2), 263-270.
Grossmann, T., & Johnson, M. H. (2007). The development of the social brain in
human infancy. European Journal of Neuroscience, 25(4), 909-919.
Halit, H., De Haan, M., & Johnson, M. H. (2003). Cortical specialisation for face
processing: face-sensitive event-related potential components in 3-and 12-month-old
infants. Neuroimage, 19(3), 1180-1193.
and approach-withdrawal bias in infancy. Developmental Psychology, 44(5), 1491-1496.
Johnson, M. H., Griffin, R., Csibra, G., Halit, H., Farroni, T., De Haan, M., ... & Richards, J.
(2005). The emergence of the social brain network: Evidence from typical and atypical
development. Development and psychopathology, 17(3), 599-619.
Johnson, M. H., Grossmann, T., & Kadosh, K. C. (2009). Mapping functional brain
development: Building a social brain through interactive specialization. Developmental
psychology, 45(1), 151-159.
Kaufman, J., Csibra, G., & Johnson, M. H. (2003). Representing occluded objects in the
human infant brain. Proceedings of the Royal Society of London. Series B: Biological
Sciences, 270(2), 140-143.
Kida, T., Wasaka, T., Nakata, H., Akatsuka, K., & Kakigi, R. (2006). Active attention modulates
passive attention-related neural responses to sudden somatosensory input against a silent
background. Experimental brain research,175(4), 609-617.
Klimesch, W., Sauseng, P., & Hanslmayr, S. (2007). EEG alpha oscillations: the
inhibition–timing hypothesis. Brain research reviews, 53(1), 63-88.
Kuhl, P. K., Tsao, F. M., & Liu, H. M. (2003). Foreign-language experience in infancy:
Effects of short-term exposure and social interaction on phonetic learning. Proceedings of
the National Academy of Sciences, 100(15), 9096-9101.
Lloyd-Fox, S., Blasi, A., & Elwell, C. E. (2010). Illuminating the developing brain: the
past, present and future of functional near infrared spectroscopy. Neuroscience &
Biobehavioral Reviews, 34(3), 269-284.
Miller, R. (1991). Cortico-hippocampal interplay and the representation of contexts in
the brain (Vol. 37). New York:: Springer-Verlag.
Mullen, E. M. (1997). Mullen scales of early learning. Circle Pines, MN: American
Guidance Service, Inc.
Müller, M. M., Gruber, T., & Keil, A. (2000). Modulation of induced gamma band
activity in the human EEG by attention and visual information processing.International
Journal of Psychophysiology, 38(3), 283-299.
Mundy, P., Card, J., & Fox, N. (2000). EEG correlates of the development of infant
joint attention skills. Developmental psychobiology, 36(4), 325-338.
Mundy, P., Fox, N., & Card, J. (2003). EEG coherence, joint attention and language
development in the second year. Developmental Science, 6(1), 48-54.
Nyström, P., Ljunghammar, T., Rosander, K., & von Hofsten, C. (2011). Using mu
rhythm desynchronization to measure mirror neuron activity in infants. Developmental
science, 14(2), 327-335.
Orekhova, E. V., Stroganova, T. A., Posikera, I. N., & Elam, M. (2006). EEG theta
rhythm in infants and preschool children. Clinical neurophysiology, 117(5), 1047-1062.
Orekhova, E. V., Elsabbagh, M., Jones, E. J., Dawson, G., Charman, T., Johnson, M. H., &
BASIS Team. (2014). EEG hyper-connectivity in high-risk infants is associated with later
autism. Journal of neurodevelopmental disorders, 6(1), 1-11.
Orekhova, E.V., Jones, E.J.H., & Johnson, M.H. (in review). Dynamic change in EEG theta
Ozonoff, S., Iosif, A. M., Baguio, F., Cook, I. C., Hill, M. M., Hutman, T., ... & Young, G. S.
(2010). A prospective study of the emergence of early behavioral signs of autism. Journal
of the American Academy of Child & Adolescent Psychiatry, 49(3), 256-266.
Pandit, A. S., Robinson, E., Aljabar, P., Ball, G., Gousias, I. S., Wang, Z., ... & Edwards, A.
D. (2013). Whole-Brain Mapping of Structural Connectivity in Infants Reveals Altered
Connection Strength Associated with Growth and Preterm Birth. Cerebral Cortex, 23(10),
1-10.
Reid, V. M., Csibra, G., Belsky, J., & Johnson, M. H. (2007). Neural correlates of the
perception of goal-directed action in infants. Acta Psychologica, 124(1), 129-138.
Ribary, U., Ioannides, A. A., Singh, K. D., Hasson, R., Bolton, J. P., Lado, F., ... & Llinas, R.
(1991). Magnetic field tomography of coherent thalamocortical 40-Hz oscillations in
humans. Proceedings of the National Academy of Sciences, 88(24), 11037-11041.
Rosenblum, L. D., Schmuckler, M. A., & Johnson, J. A. (1997). The McGurk effect in
infants. Perception & Psychophysics, 59(3), 347-357.
Ruysschaert, L., Warreyn, P., Wiersema, J. R., Metin, B., & Roeyers, H. (2013). Neural
mirroring during the observation of live and video actions in infants. Clinical
Neurophysiology, 124 (9), 1765-1770.
Shimada, S., & Hiraki, K. (2006). Infant's brain responses to live and televised
action. Neuroimage, 32(2), 930-939.
Southgate, V., Johnson, M. H., Osborne, T., & Csibra, G. (2009). Predictive motor
activation reveals infants’ on-line prediction of others’ goals.Psychological
Science, 21(3), 355-359.
Sparrow, S. S., Balla, D. A., & Cicchetti, D. V. (2005). Vineland-II adaptive behavior
scales. AGS Publishing.
Stroganova, T. A., V Orekhova, E., & Posikera, I. N. (1998). Externally and internally controlled
attention in infants: an EEG study. International Journal of Psychophysiology, 30(3),
339-351.
Stroganova, T. A., Posikera, I. N., Prokofiev, A. O., Morozov, A. A., Obukhov, Y. V., &
Morozov, V. A. (2011). EEG alpha activity in the human brain during perception of an illusory
kanizsa square. Neuroscience and behavioral physiology, 41(2), 130-139.
Tomalski, P., Moore, D. G., Ribeiro, H., Axelsson, E. L., Murphy, E., Karmiloff‐Smith, A.,
... & Kushnerenko, E. (2013). Socioeconomic status and functional brain development–
associations in early infancy. Developmental Science, 16(5), 676-687.
Webb, S.J., Jones, E.J.H., Merkle, K., Venema, K., Greenson, J., Murias, M., & Dawson, G.
(2012). Developmental change in the ERP responses to familiar faces in toddlers with
Autism Spectrum Disorders versus typical development. Child Development, 82, 1868-1886.
Whitham, E. M., Pope, K. J., Fitzgibbon, S. P., Lewis, T., Clark, C. R., Loveless, S., ... &
Willoughby, J. O. (2007). Scalp electrical recording during paralysis: quantitative evidence that
EEG frequencies above 20Hz are contaminated by EMG. Clinical
Neurophysiology, 118(8), 1877-1888.
Yoshida, H., & Smith, L. B. (2008). What's in view for toddlers? Using a head camera to study
Yuval-Greenberg, S., Tomer, O., Keren, A. S., Nelken, I., & Deouell, L. Y. (2008).
Transient induced gamma-band response in EEG as a manifestation of miniature
Table 1: Participant demographics.
Participant Demographics 6 months 12 months
Age (days) M (SD) and Range 192.9 (9.5) 166-220
378.2 (12.0)
361-448
First Child 68% 58%
Primary (Mother | Employed) 94% | 94% 95% | 95%
Participant Race (Caucasian, Asian,
More than one race)
76%, 4%, 19% 79%, 4%, 17%
Primary: College Education
(None, Some, Graduate)
0%, 12%, 87% 1%, 9%, 89%
Family Income
(<$35k, $35-75k, >$75)
Table 2: Variables contributing to attrition in the Video and Live Formats. Numbers in brackets
within the first four lines of the table indicate the number of female infants within each category.
In the second half of the table, figures are mean (standard deviation).
6 months 12 months
N (female) 117 (51) 106 (51)
Fail to wear net
0 1
Fail to
meet data criteria
29 (11) 25 (11)
EEG Data 88 (39) 80 (46)
Movies Live Movies Live
S NS S NS S NS S NS
Table 3: Summary of Social versus Nonsocial power differences across age and region.
Frontal Temporal Parietal Occipital
6 months
Theta
[L] Soc>Non
Alpha
[L] Non>Soc [L] Non>Soc
12 months
Theta [M] Soc> Non$
[L] Soc>Non$ [L] Soc>Non$
[M] Soc>Non$
[L] Soc>Non$
Alpha
[L] Non>Soc [L] Non>Soc
Figure Captions
Figure 2. Scalp topography of log theta power during Movie (top) and Live Action (bottom)
social (left) and nonsocial (right) epochs, and topography of stimulus differences (right panel).
Figure 3. Scalp topography of log alpha power during Movie (top) and Live Action (bottom)
social (left) and nonsocial (right) epochs, and topography of stimulus differences (right panel).