http://dx.doi.org/10.4236/jbise.2014.77043
How to cite this paper: Sarvi, M.N., Luo, Y.H., Sun, P.D. and Ouyang, J. (2014) Experimental Validation of Subject-Specific Dynamics Model for Predicting Impact Force in Sideways Fall. J. Biomedical Science and Engineering, 7, 405-418.
http://dx.doi.org/10.4236/jbise.2014.77043
Experimental Validation of Subject-Specific
Dynamics Model for Predicting Impact Force
in Sideways Fall
Masoud Nasiri Sarvi1, Yunhua Luo1,2*, Peidong Sun2, Jun Ouyang2
1Department of Mechanical Engineering, Faculty of Engineering, University of Manitoba, Winnipeg, Canada 2Department of Anatomy, Sothern Medical University, Guangzhou, China
Email: *[email protected]
Received 20April 2014; revised 25May 2014; accepted 1June 2014
Copyright © 2014 by authors and Scientific Research Publishing Inc.
This work is licensed under the Creative Commons Attribution International License (CC BY).
http://creativecommons.org/licenses/by/4.0/
Abstract
Sideways fall has been identified as the most critical situation for the elderly to develop hip frac- tures. The impact force onto the greater trochanter is the key factor for predicting fracture risk. For the elderly, the impact force can only be determined by dynamics simulations, and the dyna- mics model must be first validated by experiments before it can be applied in clinic. In this study, subject-specific whole-body dynamics models constructed from dual energy X-ray absorptiometry (DXA) images of the subjects were validated by controlled and protected fall tests using young vo- lunteers. The validation results suggested that subject-specific dynamics model is much more ac-curate in predicting impact force induced in sideways fall than conventional non-subject-specific dynamics model. Therefore, subject-specific dynamics model can be applied in clinic to improve the accuracy of assessing hip fracture risk.
Keywords
Hip Fracture, Impact Force, Sideways Fall, Dynamics Model, Whole Body DXA Image
1. Introduction
Statistical studies show that more than 90% of hip fractures are caused by falls [1] [2]. Hip fracture is a common health problem among the elderly [3] [4] and it is a major source of morbidity and mortality worldwide. It is es-timated that the number of hip fractures over the world will rise from 1.3 million in 1990 to between 4.5 and 21.3 million by 2050 based on statistical trends in population aging and in hip fracture incidence [5]-[7]. Hip *
fracture has been a main contributor to medical-care costs [8]. In the United States alone, 310,000 hip fractures occurred in 2003 and the total medical-care cost was approximately $10.3 to $15.2 billion, including acute medical care and nursing home services. Future costs will be even greater with the rapidly aged population and the continuously increasing hip fracture incidence over the world. It is necessary to study fall dynamics and hip fracture risk to effectively prevent hip fractures. Van den Kroonenberg proposed a three-link dynamic model for studying sideways fall from standing height [9]. Laing and his colleagues attempted to identify hip stiffness by studying experimentally obtained force-deflection relation of the pelvis affected by a lateral impact to the hip
[10]. A two-degree-of-freedom dynamics model was constructed by Kim using parameters obtained by system identification techniques [11]. The model was validated by experimental data and then used to study dynamic interactions of various biomechanical parameters in forward fall arrests by hands. Groen conducted experiments to investigate the relationship between fall velocity and impact force [12]. Sabic and his group studied the im-pact force experienced at the hip and the shoulder in sideways falls [13]. Groen also studied the effects of hand arrest, impact velocity and trunk orientation on hip impact force [14]. Zijden and his co-workers investigated the effectiveness of fall techniques in reducing impact force induced in sideways fall [15].
Reported studies on fall dynamics are mostly based on fall experiments using young volunteers. Although fall experiment is necessary and valuable for studying fall dynamics [11] [13] [15], it is not practical for the elderly due to ethical and safety reasons. On the other hand, existing dynamics models are non-subject-specific, as the anthropometric and dynamics parameters used in the models are not from the subject in concern. Therefore, they have very limited accuracy in predicting fall-induced impact force for a specific individual. In this study, a pre-viously developed dynamics model [9] is improved to make it subject-specific. The improved model is then validated by controlled and protected fall tests using young volunteers. The objective of the study is to develop a reliable dynamics model so that it can be applied to predict subject-dependent impact force in sideways fall of the elderly. Dual energy X-ray absorptiometry (DXA) imaging modality has been widely used in clinic for screening and monitoring osteoporosis due to its low radiation. DXA images have been used to quantify tissue masses in living human body [16]-[18], based on the fact that the attenuation coefficients of X-ray are propor-tional to mineral contents in the tissues. Therefore, DXA image was adopted for constructing subject-specific dynamics models in this study.
2. Methods
Anthropometric and dynamics parameters of body segments are extracted from a whole body DXA image of the subject and then used in constructing a subject-specific whole-body dynamics model.
2.1. Determination of Anthropometric Parameters Using Whole-Body DXA Image
There exists a linear correlation between pixel value in medical image and tissue mass density. Although DXA image is two dimensional, it can be used to calculate the anthropometric parameters required in constructing a dynamics model [19]. The mass (Δm) of each pixel element can be obtained by the multiplying the mass density represented by the pixel value and the area of the pixel element. The masses of body segments can be obtained by summing up masses of all the pixel elements in the body segments. The center of mass and mass moment of inertia for a body segment are calculated using their definitions
i i c i r m r m ∆ ⋅ = ∆
∑
∑
(1)2
i i
I =
∑
r ⋅ ∆m (2)where ri is the distance between the pixel element and a selected reference line. 2.2. Subject-Specific Dynamics Model
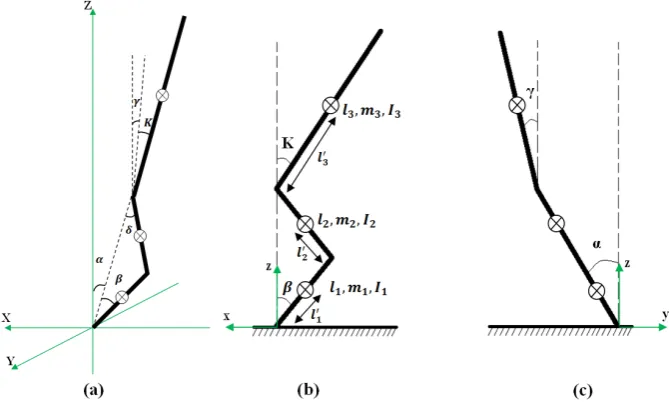
Figure 1. Three-link human body dynamics model: (a) three-dimensional view; (b) projection on sagittal plane; (c) projection on coronal plane.
The above parameters can be determined from a whole body DXA image of the subject in concern using the method described in the previous section. The motion configuration of the model is described by three angles, α,
β and γ. Where α is the angle between the vertical and the projection of the shank on y-z plane; β is the angle between the shank and its projection on x-z plane; γ is the angle between the vertical and the projection of the trunk on y-z plane. The angle between the trunk and its projection on x-z plane, κ, is considered as a constant in a fall [9]. However, it may have different value in different fall depending on the initial conditions.
The equations of motion were derived from the Lagrange’s method,
(
)
, 1, 2, 3 i
i i i
T T V
Q i
t s s s
∂ ∂ −∂ +∂ = =
∂ ∂ ∂ ∂ (3)
where Q ii
(
=1, 2, 3)
are joint moments generated by muscles, ligaments and tendons across the joints; si denote the generalized coordinates(
s1=α,s2=β,s3=γ)
. The expressions of kinetic energy (T) and potential energy (V) are provided in Appendix A. Joint moments Qβ and Qγ were calculated from fourth-order La-grange polynomials of α, β and γ that were constructed from experiment data, the obtained expressions are given in Appendix B. The polynomials were then plugged into the left-hand side of the equations in Equation (3) to obtain joint moments Qβ and Qγ. Due to complexities in the expressions, Maple codes were written to derive the equations.2.3. Impact Model
Interaction between the body and the ground is described by the impact model shown in Figure 2, which con-sists of a mass (M), a spring (K) and a damper (C). In the impact, the motion of the mass (M) is governed by the damped free vibration that has been described in most Mechanical Vibrations textbooks. The initial velocity is from the end of the fall. The mass (M) is the so-called effective mass, representing only the part of the body that has contribution to the impact force. The method for calculating the effective mass is described in [9] and the main formulas are summarized inAppendix C. The effective mass is related to the kinematic configuration of the body before the impact. Therefore, it is not a constant even for the same subject. The spring and the damper represent the effects of the soft tissue overlying the hip. The spring constant (K) and the damping coefficient (C) can be determined by the logarithm decrement method from a deflection-time curve of the hip measured from fall tests that will be described later. After solving the undamped free vibration equation, the impact force is de-termined as
Figure 2. Impact model. 2.4. Protected Fall Tests
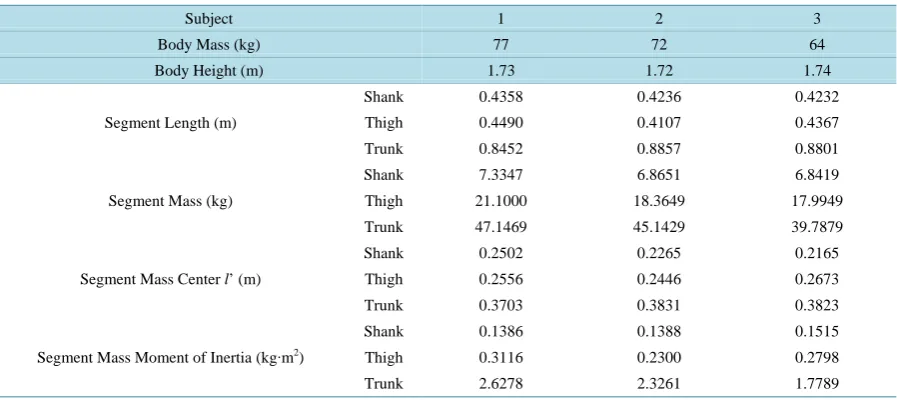
Fall tests were conducted to validate the subject-specific dynamics and impact model described in Sections 2.2 and 2.3. Three young volunteers were recruited for the study under a human research ethics approval. Before the tests, all the subjects were scanned using a clinic DXA scanner and their whole body DXA images were ob-tained. The subjects’ anthropometric parameters that were calculated from the DXA images are listed inTable 1. For each subject, a dynamics model was constructed using the obtained anthropometric parameters. As the pa-rameters used in constructing the dynamics models are obtained from the corresponding subjects, the dynamics models are thus subject specific. Then, the subjects participated in controlled and protected fall tests.
To prevent potential injury, the tests were conducted using a specially designed test system as shown in Figure 3. The system mainly consists of an electromagnetic release, slings and harness for positioning the sub-ject, a foam protection pad with an appropriate thickness and a force plate sensor embedded in the floor and un-der the protection pad. The force plate is connected to a data collection system. The subject was positioned so that the hip would hit the center of the force plate in the fall. Reflective markers were attached at the key loca-tions of the body as shown in Figure 3. The motion time histories of the reflective markers were automatically recorded by a motion capture system that consists of six high-speed cameras and a control computer. A sampling rate of 200 Hz was used in the tests. The time history data of the impact force were recorded via the force plate.
The motion of the three-link dynamics model shown in Figure 1and described by the three generalized coor-dinates was extracted from the obtained experiment data in two steps. First, the spatial coorcoor-dinates of the left and the right markers were averaged to obtain the motion of the body central line; the spatial coordinates of the body central line at the head, the hip, the knee and the ankle were used to calculate the three angles, α, β and γ. Angular velocities (α, β and γ) and angular accelerations (α, β and γ) were calculated from the angles by applying the finite difference method in the time domain. These results are used to validate the predicted motions by the three-link dynamics model in the following section. To make the predicted and the periment results comparable, initial conditions used in the dynamics simulations were retrieved from the ex-periment data and applied in the dynamics simulations.
3. Results
Using the methods presented in the previous section, the initial conditions, effective mass, hip stiffness and hip damping ratio for the three subjects were obtained and they are listed in Table 2.
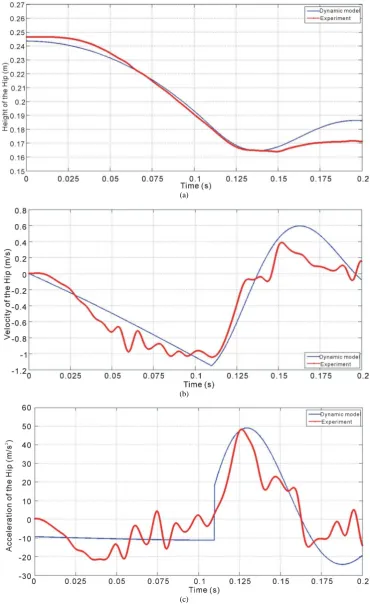
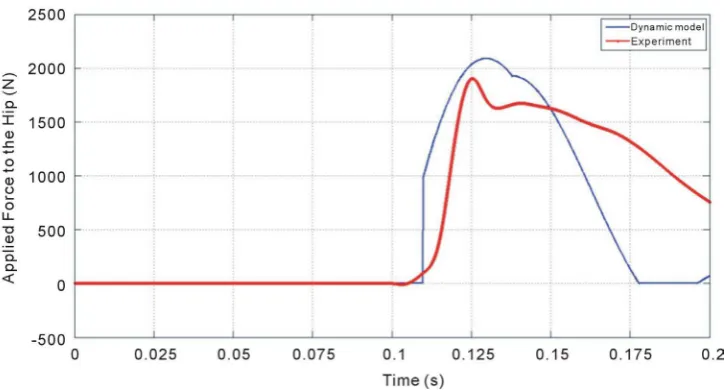
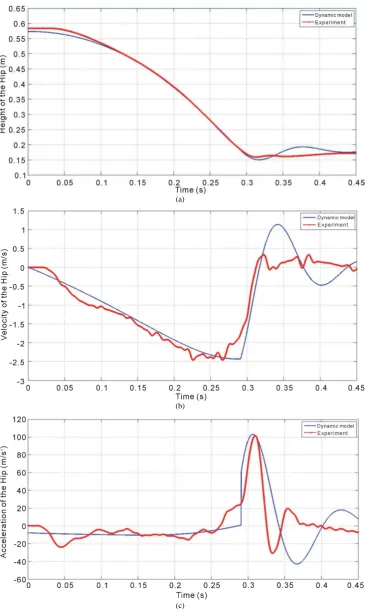
As the motion of the hip has direct effect on the impact force, the kinematics of the hip joint is used as a base-line for the validation. The predicted and experimental time histories of the hip vertical position, velocity and acceleration for Subject 1 are displayed in Figure 4. The predicted and experimentally measured impact force time histories for Subject 1 are plotted inFigure 5. The results for the other two subjects are provided in Ap-pendix D.
Relative errors in the predicted maximum hip vertical velocities and peak impact forces with respect to the corresponding experiment results are provided in Table 3. Comparison between subject-specific model and non-subject-specific model with respect to their accuracy in predicting hip velocity and impact force is given in Table 4.
4. Discussions and Conclusions
Table 1. Subject anthropometric parameters identified from whole body DXA images.
Subject 1 2 3
Body Mass (kg) 77 72 64
Body Height (m) 1.73 1.72 1.74
Segment Length (m)
Shank 0.4358 0.4236 0.4232
Thigh 0.4490 0.4107 0.4367
Trunk 0.8452 0.8857 0.8801
Segment Mass (kg)
Shank 7.3347 6.8651 6.8419
Thigh 21.1000 18.3649 17.9949
Trunk 47.1469 45.1429 39.7879
Segment Mass Center l’ (m)
Shank 0.2502 0.2265 0.2165
Thigh 0.2556 0.2446 0.2673
Trunk 0.3703 0.3831 0.3823
Segment Mass Moment of Inertia (kg∙m2)
Shank 0.1386 0.1388 0.1515
Thigh 0.3116 0.2300 0.2798
Trunk 2.6278 2.3261 1.7789
Table 2. Initial conditions and dynamics parameters retrieved from experiment data. Subject α˚ β˚ γ˚ κ˚ Effective Mass (kg) Hip Stiffness (kN/m) Hip Damping Ratio
1 64 52 38 10 35.56 108.328 0.2189
2 63 48 40 12 29.75 81.088 0.2065
[image:5.595.90.537.404.708.2]3 40 30 48 25 24.62 72.716 0.2682
Table 3. Relative errors in predicted maximum hip vertical velocity and peak impact force compared with experiment data. Subject Max. Hip Vertical Velocity (m/s) Peak Impact Force (N)
Dynamics Model Experiment Relative Error (%) Dynamics Model Experiment Relative Error (%)
1 −1.1531 −1.063 8.4 2090.1 1900.8 9.96
2 −1.3287 −1.2364 7.4 1899.6 1714.4 10.80
3 −2.4348 −2.4931 2.3 2777.4 2961.8 6.22
(a)
(b)
[image:6.595.128.499.87.692.2](c)
Figure 5. Predicted and experiment time histories of the impact force acting on the hip of Subject 1.
Table 4. Comparison between subject-specific and non-subject-specific models.
Model Relative Error (%)
Max. Hip Vertical Velocity Peak Impact Force
Non-subject-specific model [20] 5% percentile 45.7 40.0
95% percentile 34.5 30.8
Subject-specific model 6.0 (average) 9.0 (average)
velocity and impact force predicted by the subject-specific model has been greatly improved. The relative errors with respect to experiment data have been reduced in average from 40.1% and 35.4% to 6.0% and 9.0%, respec-tively. By examining the governing equations in Equation (1) and the energy expressions in Appendix A, it can be known that there are basically two groups of variables involved in the dynamics of sideways fall. One group consists of kinematic variables such as link angles and angular velocities, which are determined by solutions of the governing equations. The other group includes anthropometric parameters, for example, the segment lengths, segment masses, mass centers and mass moments of inertia. These segmental anthropometric parameters are not only affected by the subject’s overall physiological attributes such as body weight and height, but also by the distribution of the body mass. Two subjects having the same weight and height but different shape, for example, longer trunk vs. longer lower extremities, pear-shaped vs. upside-down pear-shaped, may have very different segmental anthropometric parameters. The differences will affect the resulting kinematics in fall, e.g. hip veloc-ity, via the governing equations, and thus also the impact force. The impact force is determined by both the an-thropometric parameters and the kinematic variables of the body just before the impact. From the impact model shown inFigure 2 and the expression in Equation (4), the impact force is explicitly related to the hip vertical velocity and the effective mass. The effective mass is in turn related to other kinematic variables and anthro-pometric parameters via the expressions in Appendix C. In the expressions the variables δ and β represent the body configuration before the impact. Therefore, in different fall, the same subject may suffer different im-pact force if the subject has different body configuration before the imim-pact.
to be improved. The hip stiffness and damping factor may have nonlinear relations with the soft tissue and mus-cle strength over the subject’s hip. The relations between the joint moments and the link angles may be more complicated than those fourth-order polynomials used in this study. Even the number of links in the dynamics model may need to be increased to consider the complicated body motions in sideways falls. More experiments need to be done to know their effects on the predicted impact force. A much larger number of subjects, consid-ering combinations of different age, gender, weight, height, etc., will be required to investigate the effects of the mentioned factors.
As whole body DXA images are readily available from clinic center for screening and monitoring osteoporo-sis, the proposed subject-specific dynamics model may become helpful to more accurately assess hip fracture risk for the elderly.
Conflict of Interests
The authors declare that there is no conflict of interests regarding the publication of this article.
Acknowledgements
The reported research has been supported by the Natural Sciences and Engineering Research Council (NSERC) and the Manitoba Health Research Council (MHRC) in Canada, which are gratefully acknowledged.
References
[1] Cumming, R. and Klineberg, R. (1994) Fall Frequency and Characteristics and the Risk of Hip Fractures. Journal of the American Geriatrics Society, 42, 774-778.
[2] Cummings, S.R. and Melton, L.J. (2002) Epidemiology and Outcomes of Osteoporotic Fractures. The Lancet, 359, 1761-1767. http://dx.doi.org/10.1016/S0140-6736(02)08657-9
[3] Melton, L.J. (1993) Hip Fractures: A Worldwide Problem Today and Tomorrow. Bone, 14, 1-8.
http://dx.doi.org/10.1016/8756-3282(93)90341-7
[4] Green, C., Molony, D., Fitzpatrick, C. and ORourke, K. (2010) Age-Specific Incidence of Hip Fracture in the Elderly: A Healthy Decline. The Surgeon, 8, 310-313. http://dx.doi.org/10.1016/j.surge.2010.05.008
[5] Fisher, A.A., O’Brien, E.D. and Davis, M.W. (2009) Trends in Hip Fracture Epidemiology in Australia: Possible Im-pact of Bisphosphonates and Hormone Replacement Therapy. Bone, 45, 246-253.
http://dx.doi.org/10.1016/j.bone.2009.04.244
[6] Cooper, C., Campion, G. and Melton, L.J. (1992) Hip Fractures in the Elderly: A World-Wide Projection. Osteoporos International, 2, 285-259. http://dx.doi.org/10.1007/BF01623184
[7] Gullberg, B., Johnell, O. and Kanis, J.A. (1997) World-Wide Projections for Hip Fracture. Osteoporos International, 7, 407-413. http://dx.doi.org/10.1007/PL00004148
[8] Huddleston, J.M. and Whitford, K.J. (2001) Medical Care of Elderly Patients With Hip Fractures. Mayo Clinic Pro-ceedings, 76, 295-298. http://dx.doi.org/10.4065/76.3.295
[9] Van den Kroonenberg, A.J., Hayes, W.C. and McMahon, T.A. (1995) Dynamic Models for Sideways Falls from Standing Height. Journal of Biomechanical Engineering, 117, 309-318. http://dx.doi.org/10.1115/1.2794186
[10] Laing, A.C. and Robinovitch, S.N. (2010) Characterizing the Effective Stiffness of the Pelvis during Sideways Falls on the Hip. Journal of Biomechanics, 43, 1898-1904. http://dx.doi.org/10.1016/j.jbiomech.2010.03.025
[11] Kim, K.J. and Ashton Miller, J.A. (2009) Segmental Dynamics of forward Fall Arrests: A System Identification Ap-proach. Clinical Biomechanics, 24, 348-354. http://dx.doi.org/10.1016/j.clinbiomech.2009.01.007
[12] Groen, B.E., Weerdesteyn, V. and Duysens, J. (2008) The Relation between Hip Impact Velocity and Hip Impact Force Differs between Sideways Fall Techniques. Journal of Electromyography and Kinesiology, 18, 228-234.
http://dx.doi.org/10.1016/j.jelekin.2007.06.002
[13] Sabick, M.B., Hay, J.G., Goel, V.K. and Banks, S.A. (1999) Active Responses Decrease Impact Forces at the Hip and Shoulder in Falls to the Side. Journal of Biomechanics, 32, 993-998.
http://dx.doi.org/10.1016/S0021-9290(99)00079-2
[14] Groen, B.E., Weerdesteyn, V. and Duysens, J. (2007) Martial Arts Fall Techniques Decrease the Impact Forces at the Hip during Sideways Falling. Journal of Biomechanics, 40, 458-462. http://dx.doi.org/10.1016/j.jbiomech.2005.12.014
arts Techniques Reduce Fall Severity? An in Vivo Study of Femoral Loading Configurations in Sideways Falls. Jour-nal of Biomechanics, 45, 1650-1655. http://dx.doi.org/10.1016/j.jbiomech.2012.03.024
[16] Durkin, J.L., Dowling, J.J. and Andrews, D.M. (2002) The Measurement of Body Segment Inertial Parameters Using Dual Energy X-Ray Absorptiometry. Journal of Biomechanics, 35, 1575-1580.
http://dx.doi.org/10.1016/S0021-9290(02)00227-0
[17] Nasiri Sarvi, M. and Luo, Y. (2013) Estimation of Body Segment Masses Using Whole-Body DXA Image. Proceed- ings of the 24th CANCAM, Saskatoon, 2-6 June 2013.
[18] Wicke, J., Dumas, G.A. and Costigan, P.A. (2008) Trunk Density Profile Estimates from Dual X-Ray Absorptiometry.
Journal of Biomechanics, 41, 861-867. http://dx.doi.org/10.1016/j.jbiomech.2007.10.022
[19] Van den Kroonenberg, A.J., Hayes, W.C. and McMahon, T.A. (1996) Hip Impact Velocities and Body Configurations for Voluntary Falls from Standing Height. Journalof Biomechanics, 29, 807-811.
[20] Burkhart, T.A., Arthurs, K.L. and Andrews, D.M. (2009) Manual Segmentation of DXA Scan Images Results in Reli-able Upper and Lower Extremity Soft and Rigid Tissue Mass Estimates. Journal of Biomechanics, 42, 1138-1142.
Appendix A
For the three-link dynamics model shown in Figure 1, the total kinetic energy in the system has the following expression
( )
(
(
)
)
(
(
)
)
{
(
)
(
)
(
)
(
)
(
)
}
(
(
)
)
2
2 2 2 2 2 2 2
1 1 1 2 1
2
1 2 1 2
2 2
2 2
1 2 1 2 2
3 1 2
1 1 1
cos cos 1 cos
2 2 2
cos cos cos sin sin sin
1
sin cos cos cos sin sin cos
2 1
cos cos c
2
T m Pl I m Q l
l Ql l Ql
l Ql l Ql I
m l l
β α β β α β β β
α α β δ α β β δ δ
α α β δ α β β δ δ δ α δ
α α β
= + + + + − + − + + + + − + + − − + + + − +
(
)
(
)
{
(
)
(
)
}
(
(
)
)
21 2 3
2 2
2
1 2 1 2 3 3
os sin sin sin cos cos
1
sin cos cos cos sin sin cos sin cos
2
l l Rl K
l l l l Rl K I K
δ α β β δ δ γ γ
α α β δ α β β δ δ γ γ γ
+ + − + − + + − − − +
The total potential energy in the system is
( )
(
)
(
)
1 1 2 1 2
3 1 2 3
cos cos cos cos cos cos
cos cos cos cos cos cos
V m g Pl m g l Ql
m g l l Rl K
β α α β α δ
α β α δ γ
= + +
+ + +
In the above expressions, m1, m2 and m3 are the link masses; l1, l2 and l3 are the link lengths; I1, 2
I and I3 are the link mass moments of inertia; l1′, l2′ and l3′ are distances of mass center from the distal end; and
3
1 2
1 2 3
, , l
l l
P Q R
l l l
′
′ ′
= = =
1 2 arcsin l sin
l
δ = β
Appendix B
To find 𝛼𝛼, 𝛽𝛽 and 𝛾𝛾 for each individual, information for each angle is obtained from release point to the impact moment. Then, a fourth order Lagrange polynomial is approximated to interpolate their functionality with re-spect to time. So, these functions and therefore, 𝑇𝑇𝛽𝛽 and 𝑇𝑇𝛾𝛾 are defined subject-specifically.
For Subject 1:
4 3 2
363.5 144.3 13.39 0.3320 1.175
t t t t t
α = − + − + +
4 3 2
217.2 111.1 11.30 0.2987 0.8931
t t t t t
β = − + − + +
4 3 2
174.7 70.43 5.015 0.0716 0.6375
t t t t t
γ = − + − +
For Subject 2:
4 3 2
349.1 118.4 9.291 0.5201 1.096
t t t t t
α = − + − + +
4 3 2
613.2 223.8 20.66 0.7108 0.8379
t t t t t
β = − + − + +
4 3 2
108.9 62.25 5.207 0.2187 0.6719
t t t t t
γ = − + − − +
And for Subject 3:
4 3 2
103.4 72.57 11.66 0.4491 0.6935
t t t t t
α = − + − + +
4 3 2
110.2 68.78 6.776 0.1765 0.5192
t t t t t
β = − + − + +
4 3 2
78.83 24.77 3.791 0.3226 0.8588
t t t t t
Appendix C
The effective mass of the dynamics model in Figure 1 is obtained by summing up the effective masses of the links [3]. The effective mass for the shank and the thigh links (Figure C1) is calculated by
12 12
2 12
1 2
I M
I d
m m
= +
+
where
12 1 2
I = +I I and
(
)
2 2 1(
(
)
1 2)
1 2
1 Q l m cos m 1 P l cos l cos
d
m m
δ β δ
− + − +
=
+ .
P and Q are already defined in Appendix A.
The effective mass for the trunk link as shown in Figure C2 is
3 3
3sin
Im M
I l dm ϕ
= ′ +
[image:11.595.191.406.327.419.2]The total effective mass for the whole dynamics model in Figure 1 is given by M =M12+M3.
Figure C1. Free body diagram of shank and thigh links.
[image:11.595.238.354.454.600.2]Appendix D
(a)
(b)
[image:12.595.137.488.100.688.2](c)
(a)
(b)
[image:13.595.132.498.82.695.2](c)
Figure D3. Predicted and experiment time histories of the impact force acting on the hip of Subject 2.
[image:14.595.132.497.300.492.2]