Munich Personal RePEc Archive
Political orientation of government and
stock market returns
Bialkowski, Jedrzej and Gottschalk, Katrin and Wisniewski,
Tomasz
July 2006
Online at
https://mpra.ub.uni-muenchen.de/307/
Political Orientation of Government and
Stock Market Returns
Jedrzej Bialkowski*
Department of Finance Faculty of Business
Auckland University of Technology Private Bag 92006
Auckland 1020 New Zealand
E-mail: jedrzej.bialkowski@aut.ac.nz
Phone: ++64 9 921 9999-5401 Fax: ++64 9 921 9629
Katrin Gottschalk
Department of Economics
European University Viadrina Frankfurt (Oder) Große Scharrnstr. 59
15230 Frankfurt (Oder) Germany
E-mail: gottschalk@euv-ffo.de
Phone: ++49 335 5534-2667 Fax: ++49 335 5534-2959
Tomasz Piotr Wisniewski
Department of Finance Faculty of Business
Auckland University of Technology Private Bag 92006
Auckland 1020 New Zealand
E-mail: tomasz.wisniewski@aut.ac.nz
Phone: ++64 9 921 9999-5393 Fax: ++64 9 921 9889
Political Orientation of Government and
Stock Market Returns
Abstract
Prior research documented that U.S. stock prices tend to grow faster during Democratic than during Republican administrations. This letter examines whether stock returns in other countries also depend on the political orientation of the incumbents. An analysis of 24 stock markets and 173 governments reveals that there are no statistically significant differences in returns between left-wing and right-wing executives. Consequently, international investment strategies based on the political orientation of countries’ leadership are likely to be futile.
JEL classification: G11; G14; G15
I. Introduction
An important question faced by every voter on the Election Day is which of
the parties is best equipped to foster the development of economy and capital
markets. In the pursuit of their own political agenda, the winning party or coalition
can fine-tune the fiscal policy and significantly impact on the future economic
outcomes. Depending on their political orientation, the objectives of different camps
can be quite disparate. As suggested by the partisan theory of Hibbs (1977), left-wing
governments tend to cater for the well-being of their working class electorate by
targeting unemployment. Right-wing governments, on the other hand, prioritize
reduction in inflation so feared by the higher income and occupational status groups.
Several earlier papers focused specifically on the relationship between
political orientation of the executive branch of the government and stock market
performance. Johnson et al. (1999) and Santa-Clara and Valkanov (2003) report that
U.S. stock market returns were higher under Democratic than Republican
presidencies, with the difference being particularly large for small stock portfolios.
This anomaly can not be explained away by variations in business cycle proxies.
Huang (1985) and Hensel and Ziemba (1995) look at whether presidential trading
strategies are able to improve investors’ risk-return trade-off.
Our paper adds to the presidential puzzle literature by extending the empirical
analysis beyond the U.S. stock market. The data set compiled for this study covers 24
OECD countries and 173 governments. Since elections are relatively infrequent, a
multi-country approach allows increasing the number of observations and the power
of statistical tests. Furthermore, it provides useful insights to international investors
who wonder whether the conclusions obtained from the U.S. data can be generalized
The remainder of this letter is organized as follows. The next section
describes data sources and sample characteristics. Section III investigates the
behavior of stock market indices around the Election Day and throughout the tenure
of different administrations. The implications for investors and conclusions are
contained in the last section.
II. Data
In order to investigate the nexus between political variables and stock returns,
the authors attempted to construct a comprehensive data set including all OECD
countries. Regrettably, Iceland, Ireland, Luxembourg, Slovakia, South Korea, and
Switzerland had to be excluded from the analysis because either MSCI did not
provide data on stock market indices for these capital markets, or there was not a
single change in the orientation of the government throughout the period for which
the index was available. The returns for the remaining 24 countries were computed
using the U.S. dollar denominated, value-weighted, and dividend-adjusted MSCI
Country Indices spanning a period from January 1980 through December 2005.
Whenever daily data on MSCI indices was not available from January 1980, the
sample period was adjusted accordingly. The stock market data was sourced from
Thomson Financial Datastream.
The prevailing political system in a given country (presidential or
parliamentary) determines the relevant type of election that will be examined.
Election dates as well as the exact start and end dates of each government’s term in
office were obtained from Banks et al. (2004), Caramani (2000), Lane et al. (1991),
Laver and Schofield (1998), and Müller and Strøm (2000). The classification of
Roubini (1992), Alt (1985), and Banks et al. (2004). Coalition governments were
attributed to the political camp they are conventionally associated with. Table 1
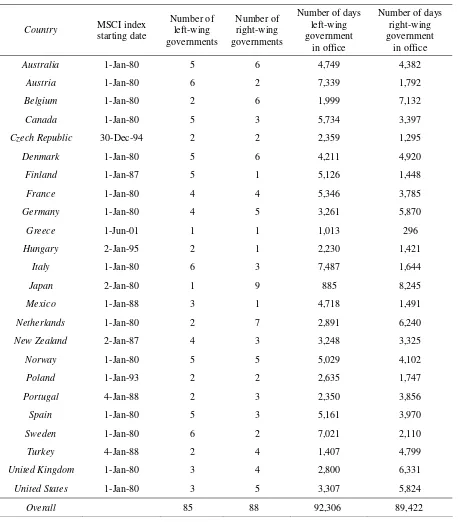
describes the characteristics of the political and financial variables used in this letter.
[Table 1 about here]
Over 60% of the countries had daily MSCI index data available from January
1980, whereas in the remaining cases the index starts at a later date. Among the 24
nations, Denmark and Australia had the highest number of governments included and
Greece had the lowest. The data set covers a comparable number of 85 left-wing and
88 right-wing governments. Although the number of right-wing cabinets was slightly
higher, the left-wing governments had tenures that were on average 70 days longer.
This translates into longer overall term in office for the left camp.
III. Results
Abnormal Returns around the Election Day
One of the features of political systems is that elections do not necessarily
coincide with an immediate change in the executive. For instance, the U.S. elections
are always held on Tuesday following the first Monday of November, whereas the
presidential term starts on the 20th of January the following year. This study
investigates the relationship between politics and stock markets by focusing both on
the entire term of office and on the day on which voters cast their ballots.
It is conceivable that in the face of political changes investors adjust their
required risk premium on assets. If they attribute greater uncertainty to the left of the
political scene, the stock market will be expected to offer higher returns under
increased risk. In this scenario, however, the prices on the Election Day are likely to
plummet. This is an immediate consequence of the increased discount rate and the
resultant lower present value of future cash flows of all firms. The story of changing
risk premia is consistent with the previously discussed presidential puzzle and Riley
and Luksetich (1980) findings showing the existence of negative returns around the
Election Day for Democratic victories and positive returns for Republican wins.
[Figure 1 about here]
In its first step, this analysis examines international stock market patterns
around the Election Day using a simple event study. The abnormal returns are
defined as difference between the returns on the respective MSCI Country Index and
the MSCI World Index. Figure 1 depicts the cumulative abnormal returns separated
by orientation of the election winner. The plots show no apparent market reaction
around the day when the uncertainty about future political leadership is resolved. The
cumulative abnormal returns for the right-wing and left-wing election winners
oscillate within a narrow range and fail to reach statistical significance.
Consequently, the conclusion that investors re-adjust their discount rates in response
to election results is not supported in our data. It is also unlikely that highly
profitable trading strategies based on the predictions of election outcomes can be
designed.
Returns during the Term of Office
Having established that the announcement effect around elections is
negligible, our focus turns to measuring stock market performance throughout
different incumbencies. Table 2 presents the dollar-denominated annualized returns
under left-wing rules and is juxtaposed with the third column which reports similar
statistics for the right-wing governments. A bootstrap test based on 1,000 replications
is used to verify whether the difference between these two columns is equal to zero.
[Table 2 about here]
According to Table 2, the Democrat premium in the U.S. is around 7.7% per
annum, which is in line with the findings of previous studies using value-weighted
indices (see Huang (1985), Johnson et al. (1999), and Santa-Clara and Valkanov
(2003)). The U.S. experience does not, however, generalize in the global context. A
closer inspection reveals that 14 out of the 24 considered stock markets actually
offered a right-wing government premium. Out of the five cases with bootstrap
p-value below 10%, two favored right-wing governments and three favored the
political left. Overall, the stock market returns were 34 basis points higher when the
left-wing cabinets were in power, but this result is not statistically significant. In light
of these findings, international investors should exercise a great deal of caution
whenever speculating on the orientation of the executive.
IV. Conclusions
Several earlier papers noted that U.S. stock prices tend to grow faster when
Democrats are in office. This anomaly persisted for almost a century and
opportunities to exploit it in security trading were present. Since political orientation
of the incumbent president is common knowledge, this result may prima facie appear
as a violation of the Efficient Market Hypothesis. Alternatively, it may be interpreted
as an increased risk premium accruing to investors who decide to hold stocks
correct, one would expect high returns during left-wing rules not only in the U.S., but
also in other countries.
To verify the above-mentioned hypothesis, this study used a comprehensive
database covering 24 OECD countries and 173 governments. The results based on
the international sample indicate that there are no statistically significant differences
in returns between left-wing and right-wing governments neither in the election
period nor throughout the tenure. The anomaly observed in the U.S. appears to be
country-specific and investors who diversify their portfolios internationally should be
wary of allocating their money based solely on the political orientation of the
References
Alesina, A., Roubini, N., 1992. Political cycles in OECD economies. Review of Economic Studies, 59, 663–688.
Alt, J.E., 1985. Political parties, world demand, and unemployment: domestic and international sources of economic activity. American Political Science Review, 79, 1016–1040.
Banks, A.S., Muller, T.C., Overstreet, W.R. (Eds.), 2004. Political Handbook of the World 2000-2002. CQ Press, Washington DC.
Caramani, D., 2000. The Societies of Europe: Elections in Western Europe since 1815 – Electoral Results by Constituencies. Palgrave Macmillan, Basingstoke, UK.
Hensel, C.R., Ziemba, W.T. 1995, United States Investment Returns during Democratic and Republican Administrations, 1928-1993, Financial Analysts Journal, March-April, 61–69.
Hibbs, D.A. Jr., 1977. Political Parties and Macroeconomic Policy, American Political Science Review, 71, 1467–1487.
Huang, R.D., 1985. Common Stock Returns and Presidential Elections, Financial Analysts Journal, March-April, 58–61.
Johnson, R.R., Chittenden, W. Jensen, G., 1999. Presidential Politics, Stocks, Bonds, Bills and Inflation, Journal of Portfolio Management, 26, Fall, 27–31.
Lane, J.-E., McKay, D.H., Newton, K., 1991. Political Data Handbook: OECD Countries. Oxford University Press, Oxford.
Laver, M., Schofield, N., 1998. Multiparty Government: The Politics of Coalition in Europe. University of Michigan Press, Ann Arbor.
Müller, W.C., Strøm, K. (Eds.), 2000. Coalition Governments in Western Europe. Oxford University Press, Oxford.
Riley, W.B., Luksetich, W.A., 1980. The Market Prefers Republicans: Myth or Reality, Journal of Financial and Quantitative Analysis, 15, 541–560.
Figure 1:
Cumulative Abnormal Returns around the Election Day
Table 1: Sample Description
Country MSCI index
starting date Number of left-wing governments Number of right-wing governments
Number of days left-wing government
in office
Number of days right-wing government
in office
Australia 1-Jan-80 5 6 4,749 4,382
Austria 1-Jan-80 6 2 7,339 1,792
Belgium 1-Jan-80 2 6 1,999 7,132
Canada 1-Jan-80 5 3 5,734 3,397
Czech Republic 30-Dec-94 2 2 2,359 1,295
Denmark 1-Jan-80 5 6 4,211 4,920
Finland 1-Jan-87 5 1 5,126 1,448
France 1-Jan-80 4 4 5,346 3,785
Germany 1-Jan-80 4 5 3,261 5,870
Greece 1-Jun-01 1 1 1,013 296
Hungary 2-Jan-95 2 1 2,230 1,421
Italy 1-Jan-80 6 3 7,487 1,644
Japan 2-Jan-80 1 9 885 8,245
Mexico 1-Jan-88 3 1 4,718 1,491
Netherlands 1-Jan-80 2 7 2,891 6,240
New Zealand 2-Jan-87 4 3 3,248 3,325
Norway 1-Jan-80 5 5 5,029 4,102
Poland 1-Jan-93 2 2 2,635 1,747
Portugal 4-Jan-88 2 3 2,350 3,856
Spain 1-Jan-80 5 3 5,161 3,970
Sweden 1-Jan-80 6 2 7,021 2,110
Turkey 4-Jan-88 2 4 1,407 4,799
United Kingdom 1-Jan-80 3 4 2,800 6,331
United States 1-Jan-80 3 5 3,307 5,824
Overall 85 88 92,306 89,422
Table 2:
Political Orientation of Government and Stock Market Returns
Returns [%]
Country Left-
Wing
Right-
Wing Difference
Bootstrap
p-value
Australia 11.0897 2.0911 8.9986 0.1140
Austria 4.5204 19.4968 -14.9764 0.0490**
Belgium 2.3024 9.8324 -7.5300 0.2060
Canada 5.6661 7.7861 -2.1200 0.3680
Czech Republic 18.1543 -3.9685 22.1228 0.0730*
Denmark -0.8029 13.3258 -14.1287 0.1090
Finland 9.9560 12.9370 -2.9810 0.4440
France 13.4530 1.5492 11.9038 0.0690*
Germany -4.1297 14.1892 -18.3189 0.0160**
Greece 3.1633 31.0425 -27.8792 0.1480
Hungary 33.4150 -5.9310 39.3460 0.0190**
Italy 10.9697 2.9079 8.0618 0.2260
Japan 0.4352 7.9392 -7.5041 0.2690
Mexico 20.1139 13.8611 6.2528 0.3610
Netherlands 4.9962 11.1087 -6.1125 0.2330
New Zealand -3.9651 3.0679 -7.0330 0.2460
Norway 3.3169 9.9913 -6.6744 0.2020
Poland 8.0489 28.1800 -20.1311 0.1690
Portugal 4.5779 0.3350 4.2429 0.3320
Spain 12.4139 3.0942 9.3197 0.1270
Sweden 15.0895 9.7092 5.3803 0.3030
Turkey 0.9501 8.2212 -7.2711 0.3670
United Kingdom 3.1467 10.6031 -7.4564 0.1490
United States 13.9556 6.2568 7.6988 0.1230
Overall 8.6992 8.3588 0.3404 0.5580