http://dx.doi.org/10.4236/ns.2014.68060
How to cite this paper: Zhou, C.H. and Chen, Y.-L. (2014) Assimilation of GPS RO Refractivity Data and Its Impact on Simula-tions of Trade Wind Inversion and a Winter Cold Front. Natural Science, 6, 605-614.
http://dx.doi.org/10.4236/ns.2014.68060
Assimilation of GPS RO Refractivity Data and
Its Impact on Simulations of Trade Wind
Inversion and a Winter Cold Front
Chunhua Zhou
1,2, Yi-Leng Chen
2*1National Center for Atmospheric Research, Boulder, USA
2Department of Meteorology, University of Hawaii at Manoa, Honolulu, USA
Email: *[email protected]
Received 20 December 2013; revised 28 January 2014; accepted 14 February 2014 Copyright © 2014 by authors and Scientific Research Publishing Inc.
This work is licensed under the Creative Commons Attribution International License (CC BY).
http://creativecommons.org/licenses/by/4.0/
Abstract
Assimilation of Global Positioning System (GPS) Radio Occultation (RO) refractivity based on WRF- 3DVAR is applied to numerical weather predictions (NWP) in Hawaii, where limited conventional observations and poor representation of local circulations in global analysis constrain the quality of numerical weather predictions. For a summer trade wind case, with GPS RO refractivity assimi-lated, the trade wind inversion is better predicted. For a winter cold front case, the propagation of the cold front is also better simulated when GPS RO refractivity is assimilated. Furthermore, the moist tongue associated with the cold front is better defined and the vertical profiles of tempera-ture and moistempera-ture are largely improved when compared to the model run without GPS RO assimi-lation.
Keywords
GPS RO, WRF-3DVAR, NWP
1. Introduction
Located in the mid-Pacific Ocean, with limited conventional in situ observations, the Hawaiian Island chain is an excellent place to test the impact of remotely sensed satellite data on high-resolution weather modeling. Many previous studies have simulated island circulations under different trade wind regimes and their response to various island terrains over the Hawaiian Islands with different initial conditions. Zhang et al. (2005) [1] and Yang et al. (2005) [2] initialized their models with the National Centers for Atmospheric Prediction (NCEP)/
C. H. Zhou, Y.-L. Chen
National Center for Atmospheric Research (NCAR) global analysis whereas several other studies (Yang et al. 2008 [3]; Yang and Chen 2008 [4]; Nguyen et al. 2010 [5]; Carlis et al. 2010 [6]) initialized their models with the NCEP Global Forecast System (GFS) model output. In these studies, the first 12-h of model runs is consi-dered to be the model spin-up period. The horizontal grids of global analyses are too coarse to resolve oro-graphic flows and island-induced diurnally driven flows in the high-resolution model domains. After a 12-h spin-up period, the orographic influences on the airflow are represented in the high-resolution nested domains.
Chen and Feng (1995) [7] examined rainfall patterns over the Island of Hawaii (Big Island) under high and low trade wind inversions during the Hawaiian Rainband Project (HaRP), July-August 1990. Their results sug-gested that for the low- (high-) inversion days, the median daily rainfall on the windward side of the Big Island is about one-half (more than twice) of the HaRP median daily rainfall. Using MM5, Chen and Feng (2001) [8] simulated island airflow and weather under summer trade wind conditions. They showed that the trade wind in-version height represents the depth of the moist layer that affects cloud development and convective feedback to the island airflow. For mountains with tops well above the trade wind inversion, the inversion also serves as a lid forcing the low-level airflow to move around the terrain (Leopold 1949 [9]; Chen and Feng 2001 [8]). An accu-rate depiction of the trade wind inversion is therefore crucial in order to properly simulate island airflow and cloud distributions under summer trade wind conditions over the Hawaiian Islands. The two sounding sites available are located in Lihue on Kauai and Hilo on Hawaii Island. Chen and Feng (2001) [8] initialized their model using an upstream sounding over the open ocean constructed from the aircraft flight-level data during HaRP.
The Global Position System (GPS) radio occultation (RO) measurements provide a new data source to deter-mine global trade wind inversion height in high vertical resolution (~200 m) (Ao et al. 2012 [10]; Guo et al. 2011 [11]; Xie et al. 2012 [12]; and others). These data can be used to obtain vertical profiles of bending angle, atmospheric refractivity (Kuo et al. 2004 [13]) and atmospheric soundings in all weather conditions, even under the presence of cloud cover (Kirsinski et al. 1997 [14]; Kuo et al. 2005 [15]; Ho et al. 2007 [16]). Previous stu-dies have shown the positive impacts of GPS RO data on numerical weather predictions including simulating typhoons (Huang et al., 2005 [17]), short-range forecasts over the Antarctic (Wee et al. 2008 [18]), and large- scale model forecasts and climate studies (Cucurull et al. 2007 [19]; Cucurull and Derber 2008 [20]; von Engeln et al. 2009 [21]; and others).
The six Formosa Satellite Mission 3/Constellation Observing System for Meteorology, Ionosphere, and Cli-mate (FORMOSAT-3/COSMIC) microsatellites launched in 2006, carry GPS RO receivers to measure the phase and amplitude of GPS signals (Anthes et al. 2000, 2008 [22] [23]). In this study, we would like to study the impacts of assimilating GPS RO refractivity data from FORMOSAT-3/COSMIC during the first 12-h of model runs on simulating trade wind inversion height at both the Hilo and Lihue sites for a summer trade wind case. Would assimilating GPS RO refractivity data during the 12-h model spin-up period affect the subsequent simulation of trade wind inversion height? In addition, we also conducted data assimilation of GPS RO refrac-tivity data during the first 12-h of the model run for a winter-time cold front case to investigate the impact of data assimilation on the simulated inversion height and the propagation and spatial distribution of the moist tongue associated with the cold front.
2. Data and Experimental Design
WRF-3DVAR is used to assimilate the GPS RO data for numerical weather predictions in Hawaii. Model initial conditions and lateral boundary conditions come from NCEP Final (FNL) Operational Model Global Tropos-pheric Analyses continuously at every six hours, with a 1˚ × 1˚ horizontal resolution and 26 vertical levels. A daily high-resolution global sea surface temperature (RTG_SST) analysis developed at the NCEP/Marine Mod-eling and Analysis Branch (MMAB) is also used to provide the lower boundary conditions. GPS RO data come from NCEP/GDAS in Binary Universal Form for the Representation (BUFR) format, downloaded from the Na-tional Oceanic and Atmospheric Administration’s NaNa-tional Model Archive and Distribution System (NOAA NOMAD) server (http://nomads.ncdc.noaa.gov/data/gdas/). For model verification, satellite images, total preci-pitable water (TPW) obtained from FNL as well as the soundings from Lihue (21.98˚N, 159.35˚W) and Hilo (19.71˚N, 155.06˚W) are compared with the model results.
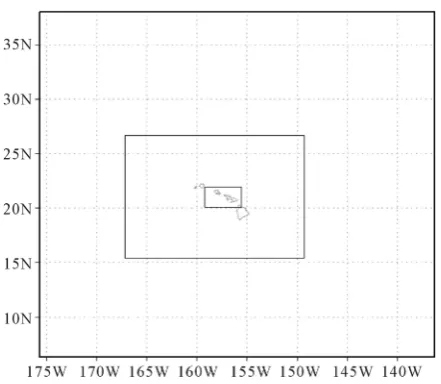
Figure 1. Locations of the three domains, with 18-km, 6-km and 2-km horizontal spacings, respectively.
types, and soil types (Zhang et al. 2005 [1]; Yang et al. 2005 [2]; Nguyen et al. 2010 [5]). In this study the land use, soil type, and vegetation fraction data are from Zhang et al. (2005) [1] and the NCEP Noah land surface model is used.
Two sets of experiments are designed, with and without GPS RO assimilation. For the one with GPS RO as-similation, starting at 1200 UTC, the model is integrated for 12 hours. The GPS RO refractivity data is assimi-lated into the forecast fields during the first 12-h simulation through WRF-3DVAR with a ±3-hour time window at 1200 UTC, 1800 UTC, and 0000 UTC. After assimilation of GPS RO refractivity data, the updated fields are integrated for another two days and the forecast fields are compared with those without assimilation of GPS RO data.
The period 6 - 8 September 2009 is selected to study the impact of GPS RO data on the simulation of trade wind inversion. The model is initialized at 1200 UTC 5 September, 2009 and integrated to 0000 UTC 8 Sep-tember, 2009 for the no-GPS RO run. For the GPS RO run, the assimilation takes place at 1200 UTC, 1800 UTC 5 September and 0000 UTC 6 September, 2009. During the period of 29 - 31 January 29, 2010, a cold front ap-proached the Hawaiian Islands and brought heavy rainfall to most islands. The model is initialized at 1200 UTC 28 January 2010. For the no-GPS RO run, the model is integrated to 0000 UTC 31 January 2010. For the run with GPS RO assimilation, WRF-3DVAR is performed at 1200 UTC, 1800 UTC 28 January and 0000 UTC 29 January and the updated fields at 0000 UTC 29 January are integrated to 0000 UTC 31 January, 2010.
3. Assimilating GPS RO Data for a Trade Wind Case
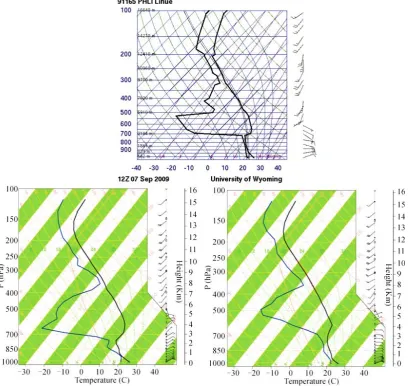
In this section, we conduct two experiments with and without GPS RO assimilation for the period of 6 - 8 tember 2009. Figure 2 shows the observed temperature and dew point temperature profiles at 1200 UTC 7 Sep-tember, 2009 at Lihue in the upper panel and the simulated profiles from the experiments with (left) and without (right) GPS RO assimilation in the lower panels. The observed trade wind inversion, denoted by the inversed temperature gradient and sharp decrease in dew point temperature (humidity), is at about the 700-hPa level. The simulated Lihue sounding with GPS RO assimilation clearly shows the existence of a trade wind inversion slightly below the 700-hPa level, whereas the simulated Lihue sounding without GPS RO assimilation exhibits a stable layer just above the 700-hPa level without a well-defined trade wind inversion.
C. H. Zhou, Y.-L. Chen
Figure 2. Upper panel: skew-T plot of Lihue sounding downloaded from the University of Wyoming. Lower panels: skew-T plots at simulated Lihue soundings from the experiments with (left) and without (right) GPS RO assimilation. All plots are valid at 1200 UTC 7 September 2009.
4. Impact of Assimilating GPS RO for a Cold Front Event
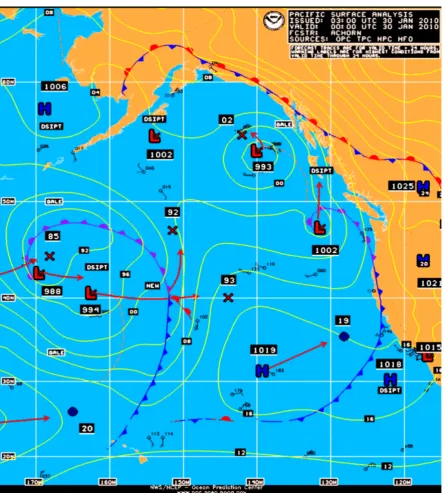
As the assimilation of GPS RO is performed at 00UTC 29 January 2010, we examine the forecast field 24 hours or longer after the assimilation, which includes the 36-hour (valid at 0000 UTC 30 January, 2010), 48-hour (va-lid at 1200 UTC 30 January, 2010), and 60-hour (va(va-lid at 0000 UTC 31 January, 2010) forecasts. The Pacific surface analysis map at 0000 UTC 30 January 2010 (Figure 4) (downloaded from
http://nomads.ncdc.noaa.gov/ncep/NCEP) shows that at this time, the frontal zone has arrived over the island of Kauai.
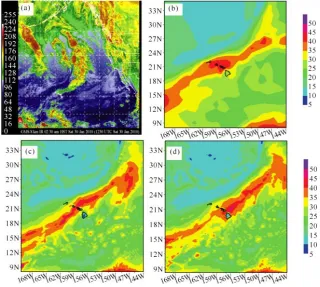
Figure 5(a) shows that at 0030 UTC January 30 2010, the cloud systems associated with the cold front covers the island of Kauai. Consistent with the cloud distribution in Figure 5(a), the moist tongue from NCEP FNL at 0000 UTC 30 January 2010 is over Kauai. Figure 5(c) and Figure 5(d) present the TPW field from the model results with and without GPS RO assimilation, respectively. It is apparent that the simulated horizontal distribu-tion of TPW with GPS RO assimiladistribu-tion is in agreement with observadistribu-tions with a maximum axis over Kauai. On the other hand, without GPS RO assimilation, the model produces a faster than observed movement of the fron-tal zone, with the maximum TPW axis reaching the island of Maui. It is apparent that with GPS RO refractivity assimilated, the propagation of the cold front and the associated moist axis is better simulated.
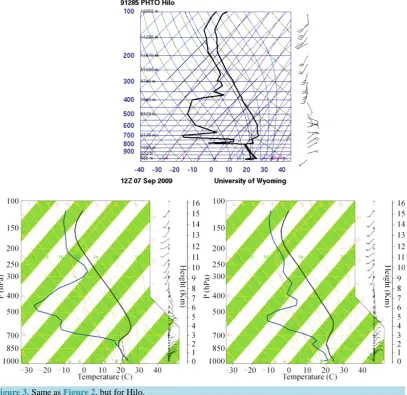
Figure 3. Same as Figure 2, but for Hilo.
NCEP FNL data (Figure 6). The cloud system associated with the cold front has moved eastward and covers from the east of Kauai to Maui. The TPW field from NCEP FNL shows a similar distribution as the satellite image, with the maximum TPW axis covering the same region. Comparison of the modeled TPW with the cloud distribution and observed TPW shows that with GPS RO assimilated, the spatial pattern of the TPW is in agreement with observations with a moist tongue covering the area from Oahu to Maui. The simulated TPW from the no-GPS RO run, however, is further toward the east, with the maximum TPW axis reaching the Big Island.
Consistent with the results shown in Figure 5 and Figure 6, the simulated TPW with GPS RO assimilation at 0000 UTC 31 January, 2010 is more realistic whereas the no-GPS RO run tends to produce large values of TPW further to the east (not shown). The above results show that assimilation of GPS RO improves the predictions of the propagation of the cold front and the moist tongue associated with it.
C. H. Zhou, Y.-L. Chen
Figure 4. Pacific surface analysis at 0000 UTC 30 January 2010, downloaded from http://nomads.ncdc.noaa.gov/ncep/NCEP.
Lihue sounding is very dry (right panel of Figure 8), which is inconsistent with the observed profile.
Figure 5. (a) Satellite image at 0030 UTC 30 January, 2010; (b) Total precipitable water
(km/m−2) at 0000 UTC 30 January, 2010 from NCEP FNL; (c) Total precipitable water at
0000 UTC 30 January, 2010 from the GPS RO run; (d) Total precipitable water at 0000 UTC 30 January, 2010 from the no-GPS RO run.
[image:7.595.154.475.421.708.2]C. H. Zhou, Y.-L. Chen
Figure 7. Skew-T plots of Lihue soundings at 0000 UTC 30 (left) and 31 (right) January 2010. The black thick line on the left (right) of each panel represents the profile of temperature (dew point temperature). These
[image:8.595.122.509.321.492.2]figures were downloaded from the University of Wyoming (http://weather.uwyo.edu/upperair/sounding.html).
Figure 8. Skew-T plots of Lihue soundings valid at 0000 UTC 30 (left) and 31 (right) January 2010, based on the experiment without GPS RO assimilation. The black (blue) thick line represents the temper-ature (dew point tempertemper-ature) profile.
[image:8.595.121.511.535.707.2]The above analysis shows that in addition to the improved simulations of the spatial distributions of TPW as-sociated with the propagation of the cold front, the thermodynamic profiles during the frontal passage are also better simulated if the GPS RO refractivity data are assimilated in the model.
5. Conclusions
GPS RO refractivity data are assimilated using WRF-3DVAR and its impacts on numerical weather simulations in Hawaii are investigated. Two typical scenarios are chosen, a summer trade wind case and a winter cold front case, to study the effects of GPS RO assimilation under different weather conditions.
The study of a trade wind case lends support to the improvements on numerical weather predictions through assimilating GPS RO. In this case, trade wind inversions are better simulated with GPS RO assimilation than without GPS RO assimilation. For the winter cold front case, with the more detailed information of temperature and humidity profiles from the GPS RO data, the model produces better-simulated frontal movement with bet-ter-defined spatial distribution of the TPW associated with the cold front and the vertical profiles of temperature and moisture are largely improved when compared to the model run without GPS RO assimilation. Both cases are consistent with previous studies, showing the positive impacts of GPS RO on the numerical weather simula-tions over the Hawaiian Islands.
Acknowledgements
This work is funded in part by the Pacific Islands Ocean Observing System (PacIOOS), which is a part of the US Integrated Ocean Observing System (IOOS), under National Oceanic and Atmospheric Administration (NOAA) Award #NA11NOS0120039.
We’d like to thank DTC for hosting the visit to NCAR and the staff in DTC for their help. Special thanks to Dr. Xiang-Yu Huang and Dr. Louisa Nance for their help on the WRF-3DVAR.
References
[1] Zhang, Y., Chen, Y.-L., Hong, S.-Y., Juang, H.-M.H. and Kodama, K. (2005) Validation of the Coupled NCEP Me-
soscale Spectral Model and an Advanced Land Surface Model over the Hawaiian Islands. Part I: Summer Trade Wind
Conditions and a Heavy Rainfall Event. Weather Forecasting, 20, 847-872.http://dx.doi.org/10.1175/WAF891.1
[2] Yang, Y., Chen, Y.-L. and Fujioka, F.M. (2005) Numerical Simulations of the Island-Induced Circulation over the
Island of Hawaii during HaRP. Monthly Weather Review, 133, 3693-3713. http://dx.doi.org/10.1175/MWR3053.1
[3] Yang, Y., Chen, Y.-L. and Fujioka, F.M. (2008) Effects of Trade Wind Strength and Direction on the Leeside Circula-
tions and Rainfall of the Island of Hawaii. Monthly Weather Review, 136, 4799-4818.
http://dx.doi.org/10.1175/2008MWR2365.1
[4] Yang, Y. and Chen, Y.-L. (2008) Effects of Terrain Heights and Sizes on Island-Scale Circulations and Rainfall for the
Island of Hawaii during HaRP. Monthly Weather Review, 136, 120-146. http://dx.doi.org/10.1175/2007MWR1984.1
[5] Nguyen, H.V., Chen, Y.-L. and Fujioka, F. (2010) Numerical Simulations of Island Effects on Airflow and Weather
during the Summer over the Island of Oahu. Monthly Weather Review, 138, 2253-2280.
http://dx.doi.org/10.1175/2009MWR3203.1
[6] Carlis, D.L., Chen, Y.-L. and Morris, V. (2010) Numerical Simulations of Island-Scale Airflow and the Maui Vortex
during Summer Trade Wind Conditions. Monthly Weather Review, 138, 2706-2736.
http://dx.doi.org/10.1175/2009MWR3236.1
[7] Chen, Y.-L. and Feng, J. (1995) The Influences of Inversion Height on the Precipitation and Airflow over the Island of
Hawaii. Monthly Weather Review, 123, 1660-1676.
http://dx.doi.org/10.1175/1520-0493(1995)123<1660:TIOIHO>2.0.CO;2
[8] Chen, Y.-L. and Feng, J. (2001) Numerical Simulations of Airflow and Cloud Distributions over the Windward Side of
the Island of Hawaii. Part I: The Effects of Trade Wind Inversion. Monthly Weather Review, 129, 1117-1134.
http://dx.doi.org/10.1175/1520-0493(2001)129<1117:NSOAAC>2.0.CO;2
[9] Leopold, L.B. (1949) The Interaction of Trade Wind and Sea Breeze, Hawaii. Journal of Meteorology, 6, 312-320.
http://dx.doi.org/10.1175/1520-0469(1949)006<0312:TIOTWA>2.0.CO;2
[10] Ao, C.O., Waliser, D.E., Chan, S.-K., Li, J.-L., Tian, B., Xie, F. and Manucci, A.J. (2012) Planetary Boundary Layer
Heights from GPS Radio Occultation Refractivity and Humidity Profiles. Journal of Geophysical Research, 117,
C. H. Zhou, Y.-L. Chen
http://dx.doi.org/10.1029/2012JD017598
[11] Guo, P., Kuo, Y.-H., Sokolovskiy, S.V. and Lenschow, D.H. (2011) Estimating Atmospheric Boundary Layer Depth
Using COSMIC Radio Occultation Data. Journal of the Atmospheric Sciences, 68, 1703-1713.
http://dx.doi.org/10.1175/2011JAS3612.1
[12] Xie, F., Wu, D.L., Ao, C.O., Mannucci, A.J. and Kursinski, E.R. (2012) Advances and Limitations of Atmospheric
Boundary Layer Observations with GPS Occultation over Southeast Pacific Ocean. Atmospheric Chemistry and Phys-
ics, 12, 903-918. http://dx.doi.org/10.5194/acp-12-903-2012
[13] Kuo, Y.-H., Wee, T.K., Sokolovskiy, S., Rocken, C., Schreiner, W., Hunt, D. and Anthes, R.A. (2004) Inversion and
Error Estimation of GPS Radio Occultation Data. Journal of the Meteorological Society of Japan, 82B, 507-531.
http://dx.doi.org/10.2151/jmsj.2004.507
[14] Kursinski, E.R., Hajj, G.A., Schofield, J.T., Linfield, R.P. and Hardy, K.R. (1997) Observing Earth’s Atmosphere with
Radio Occultation Measurements Using the Global Positioning System. Journal of Geophysical Research, 102, 23429-
23465.
[15] Kuo, Y.-H., Schreiner, W.S., Wang, J., Rossiter, D.L. and Zhang, Y. (2005) Comparison of GPS Radio Occultation
Soundings with Radiosondes. Geophysical Research Letters, 32, L05817. http://dx.doi.org/10.1029/2004GL021443
[16] Ho, S.-P., Kuo, Y.-H. and Sokolovskiy, S. (2007) Improvement of the Temperature and Moisture Retrievals in the
Lower Troposphere Using AIRS and GPS Radio Occultation Measurements. Journal of Atmospheric and Oceanic
Technology, 24, 1726-1739. http://dx.doi.org/10.1175/JTECH2071.1
[17] Huang, C.-Y., Kuo, Y.-H., Chen, S.-H. and Vandenberghe, F. (2005) Improvements in Typhoon Forecasts with Assi-
milated GPS Occultation Refractivity. Weather Forecasting, 20, 931-953. http://dx.doi.org/10.1175/WAF874.1
[18] Wee, T.-K., Kuo, Y.-H., Bromwich, D.H. and Monaghan, A.J. (2008) Assimilation of GPS Radio Occultation Refrac-
tivity Data from CHAMP and SAC-C Missions over High Southern Latitudes with MM5 4DVAR. Monthly Weather
Review, 136, 2923-2944. http://dx.doi.org/10.1175/2007MWR1925.1
[19] Cucurull, L., Derber, J.C. and Treadon, R. and Purser, R.J. (2007) Assimilation of Global Positioning System Radio
Occultation Observations into NCEP’s Global Data Assimilation System. Monthly Weather Review, 135, 3174-3193.
http://dx.doi.org/10.1175/MWR3461.1
[20] Cucurull, L. and Derber, J.C. (2008) Operational Implementation of COSMIC Observations into NCEP’s Global Data
Assimilation System. Weather Forecasting, 23, 702-711. http://dx.doi.org/10.1175/2008WAF2007070.1
[21] Von Engeln, A., Healy, S., Marquardt, C., Andres, Y. and Sancho, F. (2009) Validation of Operational GRAS Radio
Occultation Data. Geophysical Research Letters, 32, L06815.
[22] Anthes, R.A., Rocken, C. and Kuo, Y.-H. (2000) Application of COSMIC to Meteorology and Climate. Terrestrial,
Atmospheric and Oceanic Sciences, 11, 115-156.
[23] Anthes, R.A., Ector, D., Hunt, D.C., Kuo, Y.-H., Rocken, C., Schreiner, W.S., Sokolovskiy, S.V., Syndergaard, S.,
Wee, T.-K., Zeng, Z., Bernhardt, P.A., Dymond, K.F., Chen, Y., Liu, H., Manning, K., Randel, W.J., Trenberth, K.E., Cucurull, L., Healy, S.B., Ho, S.-P., McCormick, C., Meehan, T.K., Thompson, D.C. and Yen, N.L. (2008) The
COSMIC/FORMOSAT-3 Mission: Early Results. Bulletin of the American Meteorological Society, 89, 313-333.