Ethnocentrism and Internal
Compensation Structuring: An
Experimental Examination of Point
Factor Job Evaluation
Martin, Daniel and Wiley, Donna and Legree, Peter
California State University, East Bay
9 August 2006
Online at
https://mpra.ub.uni-muenchen.de/28683/
Ethnocentrism and Internal Compensation Structuring: An Experimental
Examination of Point Factor Job Evaluation
Daniel E. Martin1, Donna Wiley1, Peter J.Legree2
California State University, East Bay1, U.S Army Research Institute for Behavioral and Social Sciences2
Abstract
“Comparable Worth” represents the concept that men, women, minorities, and whites should receive equal pay for work of equal value from their employer [8]. Much research and many articles have been written in regards to overall pay inequities between men and women; however information regarding internal compensation strategies and perceived labor pools (percentage of minority applicants) has not been explored in depth. A total of 381 individuals participated in an experimental study that manipulated perceived labor market composition in order to establish the relative impact of ethnocentrism on the evaluation of compensable factors and salary. Results strongly supported the authors’ hypotheses, indicating that (a) significant discriminatory weighing of compensable factors by the perceived ethnicity and gender of labor pools occurs, (b) individual participant demographics (ethnicity and gender) contribute significantly to discrimination between perceived labor pools, and (c) participant individual differences significantly contribute to discriminatory weighting. Implications and directions for future research are considered.
Introduction
The United States provided for the protection of women and minorities against pay discrimination by enacting the Equal Pay Act (EPA) of 1963 and Title VII of the 1964 Civil Rights Act (Title VII). EPA prohibits sex-based discrimination between men and women working for the same establishment in jobs that are substantially equal in terms of compensable facts such as effort, skill, responsibility, and working conditions. The essence of this act is that employees must be given equal pay for equal work. Title VII protects against discrimination, including but not limited to sex, race, color, and/or national origin, across all employment-related matters, including pay [26]. If a company has been found in violation of the
law they may be ordered to correct the inequity by issuing wage adjustments.
male dominated (one gender reflects 70% of job incumbents). If classification falls below 70% of incumbents in one classification, then it is considered to be sex-balanced. Regression methods are used to determine the relations between existing wage rates and the point values for each subgroup of jobs. If the estimated regression lines are found to be statistically different between the male and female dominated positions then sex discrimination is said to have existed [3]. If bias has been established, general practice has been to raise the wages of the female dominated jobs up to the rate of the male-dominated jobs (typically 20%).
The job evaluation process may be subject to sex bias as associated factors and weights are inherently subjective, with evaluator points unreliable due to individual differences and rater bias [3]. Significantly, the problems of subjectivity begin earlier in the basis for the job evaluation process, job analysis. For example, in 1979 Blumrosen stated [6], “The value system and related perceptions of the job analyst influence what information is collected and therefore what is available in later stages of the process.” Male and female evaluators that receive similar information emphasize different aspects such as working conditions [3]. However, in a more recent study, Grinder & Toombs [12] found that average job-evaluation scores set by male and female evaluators were not significantly different.
Research on comparable worth began focusing on job evaluation in the mid 1980’s. As job evaluation is an administrative tool for establishing a hierarchy of jobs for purposes of pay, it is a logical place to assess comparable worth because it arrays jobs in terms of internal job requirements and related values.
More recent research [2] has shown that inherent job worth is a difficult construct to define objectively or to measure reliably. The study had three separate commercial job evaluation firms independently rate 27 jobs that represented 22% of the total employment from one company. They used separate evaluation methods and the resulting evaluations did not rate the same traits, suggesting that comparable worth will depend on the evaluator chosen.
1.
Point factor job evaluation systems, the
Equal Pay Act, and Title VII of the Civil
Rights Act of 1964
While the majority of human resources professionals are very familiar with the concept of an external salary survey, the main focus of our research is on what to value within the actual jobs, and how that value is determined for equal jobs. Based on the above, and because point factor plans are the most commonly used job evaluation method in the U.S. and Europe, we focused on aspects of the point factor job evaluation system for potentially similar discrimination in determining relative value within jobs [20].
Point factor job evaluations make the criteria for evaluating jobs explicit through the establishment of compensable factors. Compensable factors are work characteristics that the organization values, generally based on job analysis [20][15].
Our use of the point factor methodology presupposed several steps having been completed by the time study participants have received their instructions. Specifically, the job analysis of a benchmarked position (in our case, project manager) has been executed; compensable factors identified, and scaled, affording our subject matter experts (in our case students) the opportunity to weight the compensable factors relative to their importance in executing the job. [20][15].
The EPA specifically focuses on pay discrimination between employees on the basis of sex, considering equal work (“equal work on job the performance of which requires equal skill, effort and responsibility, which are performed under similar working conditions…” [27] as the basis for judging compensation discrepancies between the sexes. While the EPA spells out the use of compensable factors as grounds for the evaluation of job similarity, it does not address the potential differences in the way compensable factors are internally weighed. Compensable factors are strategically weighted to facilitate meeting organizational goals by placing an emphasis on specific compensable factors in relation to the overall pay or evaluations of employees. In point factor job evaluation, job evaluators are asked to consider the importance of the individual compensable factor, and to weight it (percentage) accordingly. This is usually done by managers or a job evaluation committee [19].
evaluation process. Specifically, as job evaluators bring their own experiences and references to the point factor process, it may be possible that, while knowing their task is to evaluate the relative importance of the compensable factor, they are considering incumbent and applicant manifestations of the specific factor, as opposed to objectively considering the factor alone [2][3][6].
Similarly, Title VII makes it unlawful to “limit, segregate, or classify employees or applicants for employment in any way which would deprive or tend to deprive any individual of employment opportunities or otherwise adversely affect his status as an employee, because of such individual’s race, color, religion, sex, or national origin.”[28]. Under Title VII, differential weighting of compensable factors based on perceptions of either incumbents, applicants, or potential labor pool might be construed as disparate impact. Disparate impact represents discrimination that is unintentional, but impacts protected employee groups unequally. The previously referenced research does not address other potential factors that may impact job evaluators and compensation decision makers. With the demographics of the United States changing rapidly, the labor market is diversifying rapidly. The Bureau of the Census [25] notes the following workforce findings: Minorities and immigrants currently hold one out of every four jobs in America, with Asian and Hispanics labor pools growing fastest, followed by the African-American workforce. Minority Americans now comprise nearly 25 percent of the total population.
While there was a groundswell in interest regarding sex-related errors in job evaluation in the mid-80s, similar approaches to understanding the impact of perceived incumbent, applicant, and labor pool ethnicity and ethnocentrism have not been addressed. The current research investigated the impact of potential biases by manipulating the perceived gender and ethnicity of populations associated with the job being evaluated, as well establishing potential significant differences related to the ethnicity and gender of the evaluator.
2.
Ethnocentrism
Ethnocentrism may be an ingredient in the job evaluation process. As ethnocentrism is the tendency to believe or feel that one’s racial or cultural background is ethically and morally superior to that
of the out-group or other groups [30], it is a facet of human life that impacts every aspect of behavior. Sumner first defined ethnocentrism [23], noting the use of in-group standards when judging out-groups. The ethnocentric perspective is one that may lead to different judgments for the same behaviors depending on who enacted the behaviors.
Ethnocentrism involves using one’s own group as a basis for comparisons with similar groups regarded more favorably (or with more in-group bias) and dissimilar groups being regarded less favorably. Ethnocentrism guides distinctions made between groups, and can lead to racial polarization. “Racial polarization links racial differences to behavior, thereby channeling people into racially segregated job niches and opportunities for accomplishments” [17]. Individuals may identify with their cultural background, using out group standards for non-members, manifesting ethnocentric judgments during the weighting of the compensable factors.
3.
Individual Differences
As acculturation plays an important role in individual/group identity, we will explore its relevance to the evaluation of compensable factors. Redfield, Linton and Herskovits [21] defined acculturation as “those phenomena which result when groups of individuals having different cultures come into continuous first-hand contact, with subsequent changes in the original culture patterns of either or both groups.” Berry, Kim, Power, Young, and Bujaki [5] have proposed a model to describe the ways the individual relates to the dominant culture. Their relational style is known as their acculturation strategy. We will use the categories in the Berry, et al. [5] analysis to assess the potential impact the four dimensions of acculturation above may have on weighting compensable factors.
The strategies formulated by Berry, et al. are:
Assimilation, which is when the individual adheres to the other culture’s values;
Separation, in which the individual adheres to their own cultural values, and rejects the other culture’s norms;
Integration, which is the acceptance of both sets of cultural norms to a greater degree;
As the weighting of compensable factors may tap into cognitive biases, and as resisting these biases necessitates effortful cognitive processes [10], an individual’s need for cognition might play a role in the evaluation of compensable factors. The need for cognition (NFC) describes individual differences in one’s likelihood to participate in effortful cognitive activities [7], and individual NFC scores express variations in one’s attitudes, thinking, and behaviors. Importantly for our study, previous research has demonstrated a significant negative correlation between need for cognition and modern racism in college students [29]. As we are examining the effect of group membership (and group membership-related individual differences), as opposed to individual cognitive differences, we will use the need for cognition scale as a covariate in our multivariate analyses.
While legislation has been enacted to prohibit compensation discrimination based on race, color, religion, sex, national origin, age, disability, or protected activity, the current study is concerned with problems of both internal and external compensation discrimination. Specifically, given the prevalence of multinational and national organizations, we have not been able to identify the discriminatory impact of differential assignments of points to compensable factor based on perceived labor markets. While individuals are supposed to be evaluating jobs, not people, the evidence suggests the majority of evaluators are considering incumbents, applicants and labor pools, not the job itself in a job evaluation [2]. Given the paucity of literature regarding both the interaction between gender and ethnicity of perceived labor pools, and evaluator demographics in internal compensation decision making, we focused on the aforementioned factors in our current research.
4.
Present Study
This study explored 1) the impact of the perceived ethnicity/nationality on internal compensation decision making, 2) strength of cultural identification on internal compensation decision making, 3) external compensation and the impact of the aforementioned independent variables.
4.1.Hypotheses
H1: Based on previous related findings, we anticipated significant differences in relative weighting of compensable factors and salary based on perceived ethnicity and gender of the labor pool.
H2: We anticipated significant differences to be found in the weighting of compensable factors and salary based on participant demographics.
H2a: Participant ethnicity H2b: Participant gender
H3: We anticipated that individual differences may play a role in the weighting of the compensable factors/salary allocation and accordingly:
H3a: Assessed for the impact of participants’ acculturation on the weighting of compensable factors and salary.
4.2.Method
4.2.1.Sample
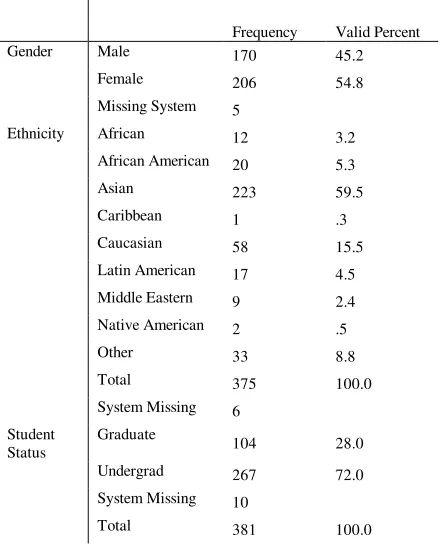
[image:5.612.325.545.437.709.2]The sample came from a medium-sized public university on the west coast. Participants were both graduate and undergraduate students in a college of business and economics. Student ages ranged from 20 to 56, with 75% being between the range of 20 and 30 years old. 55% of the participants were female, and 45% were male. 59% of the participants self identified as being Asian in ethnicity, with 15% self identifying as Caucasian. The majority of participants were undergraduates at 72%, with 28% of the participants being graduate students (see Table 1).
Table 1:Participant descriptive statistics
Frequency Valid Percent
Gender Male 170 45.2
Female 206 54.8
Missing System 5
Ethnicity African 12 3.2
African American 20 5.3
Asian 223 59.5
Caribbean 1 .3
Caucasian 58 15.5
Latin American 17 4.5
Middle Eastern 9 2.4
Native American 2 .5
Other 33 8.8
Total 375 100.0
System Missing 6
Student Status
Graduate
104 28.0
Undergrad 267 72.0
System Missing 10
For the purposes of our analyses, participant ethnicity was condensed to Asian, Caucasian, and others.
4.3.Procedure
The survey instrument contained five sections. Following an introduction to the task, the first section exposed individuals to a stimulus job description that manipulated the labor pool (a majority-70% being of one gender), and ethnicity (African-American or Caucasian) of the position being evaluated (project manager). As such, there were four potential forms for the participants to receive. They were ordered one through four and passed out randomly in courses during the spring and summer quarter of 2005.
Table 2: Participation by version
Participant version Frequency Valid Percent African-American female 92 24.1
African-American male 98 25.7
Caucasian female 98 25.7
Caucasian male 93 24.4
Total 381 100.0
The second section asked them to assign a percentage to compensable factors (knowledge/education/experience, responsibility, effort, and working conditions) indicating their relative importance to the organization, with the total percentage adding up to 100%. As the students had little or no exposure to compensation concepts, examples were given (see below, and Appendix A). For example, if the person would only need to perform basic tasks or need basic knowledge in the area, then you should have 10% assigned to that compensable factor. In order to assign a high percentage, the person would need to be able to perform complex duties requiring significant knowledge and skills in the compensable factor. A third section had students consider a range of salary for the position based on external salary surveys. They were asked to indicate what salary human resources should offer potential project manager candidates.
A fourth section had students respond to a Need for Cognition (NFC) scale [7]. The NFC scale consisted
of twenty (20) questions establishing preferences for cognitive effort in various situations (Appendix A). As the student population is extremely diverse, and includes many foreign-born students, a fifth section had students respond to two questions that were designed to assess their level of acculturation into United States cultural norms. Finally, students were asked a series of demographic questions, specifically their ethnicity, age, sex, educational status (undergraduate or graduate) and number of years they have spent in United States.
4.4.Analyses
Before beginning the analyses the reliability of the NFC scale and the Berry Acculturation scale in our sample were established. Both scales (NFC and the Berry Acculturation scale) had acceptable Cronbachs alphas, .78, and .89, respectively.
Multivariate analysis of covariance (MANCOVA) was used to test the hypotheses, with compensable factors (knowledge, responsibility, effort, and working conditions) and salary serving as the dependent variables. Participant gender, questionnaire version, participant ethnicity and level of acculturation, served as fixed factors [24]. Adjustment was made for the covariate of need for cognition.
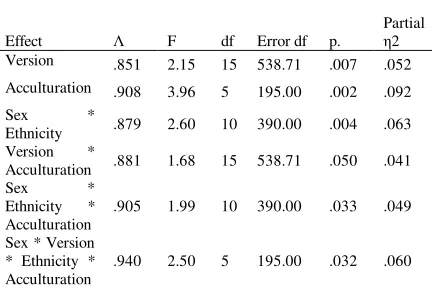
[image:6.612.326.542.564.707.2]Using Wilks’ criterion, we found modest (acculturation partial η2 = .09) to small associations (version partial η2 = .05) between the combined dependent variables and the main effects. Associations between the combined dependent variables and the interactions were modest. Table 3 provides a summary of the significant Multivariate Wilk’s Lambda test.
Table 3: Significant MANCOVA Multivariate Test (Wilk’s Statistic)
Effect Λ F df Error df p.
Partial
η2 Version .851 2.15 15 538.71 .007 .052
Acculturation .908 3.96 5 195.00 .002 .092
Sex *
Ethnicity .879 2.60 10 390.00 .004 .063 Version *
Acculturation .881 1.68 15 538.71 .050 .041 Sex *
Ethnicity * Acculturation
.905 1.99 10 390.00 .033 .049
Sex * Version * Ethnicity * Acculturation
To further identify significant main effects and interactions found in the MANCOVA, the results of the MANCOVA between-subjects effects tests were analyzed further (see Table 4).
Table 4: Significant MANCOVA between-subjects effects tests.
Source D.V. Type
III SS df F p.
Partial
η2
Resp. 605.4 3 2.84 .039 .041 Version
Salary 18.99 3 2.90 .036 .042
Acculturation Effort 452.12 1 6.46 .012 .031
Know. 1343.8 2 4.52 .012 .044 Sex *
Ethnicity
Effort 870.97 2 6.22 .002 .059 Sex * Version
* Ethnicity Effort 938.56 6 2.23 .041 .063 Sex *
Acculturation Salary 12.80 1 5.87 .016 .029 Sex *
Ethnicity * Acculturation
Effort 553.07 2 3.95 .021 .038
Sex * Version * Ethnicity * Acculturation
Salary 20.62 1 9.46 .002 .045
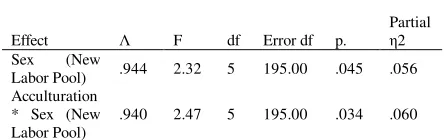
[image:7.612.73.291.154.338.2]Mean differences are presented in Appendix B. For the purposes of comparison, two new variables representing either an African American or White labor pool (New Race), or a Female of Male (New Sex) labor pool were constructed. A subsequent MANCOVA was run with the inclusion of the two new variables, and the removal of the version (manipulated labor pool composition) variable. Significant MANOVA multivariate test (Wilk’s Statistic) are presented in table 5.
Table 5: Significant MANCOVA Multivariate Test (Wilk’s Statistic)
Effect Λ F df Error df p.
Partial
η2 Sex (New
Labor Pool) .944 2.32 5 195.00 .045 .056 Acculturation
* Sex (New Labor Pool)
.940 2.47 5 195.00 .034 .060
[image:7.612.71.293.507.577.2]To further identify significant main effects and interactions found in the MANCOVA, we interpreted the results of the MANCOVA between-subjects effects tests (see Table 6). Mean differences are presented in Appendix B.
Table 6: Significant MANCOVA between-subjects effects tests.
Source D.V.
Type III
SS df F p.
Partial
η2 Sex (New
Labor Pool)
Resp. 325.94 1 4.59 .033 .023
Salary 10.29 1 4.72 .031 .023
Acculturation * Sex (New Labor Pool)
salary
9.99 1 4.58 .033 .023
5.
Results
Perceptions of the degree to which compensable factors account for the successful completion in a job are subject to a host of subtle and rarely acknowledged biases. We manipulated two variables in this study: ethnic salience and sex, which (either as main effects or interactions) had significant impacts on the way participants weighted compensable factors. We also established the impact of acculturation on the perceived value of the compensable factors. Our findings were consistent with the existing literature, and directly support our hypotheses. Some of the findings point to promising further research, while others confirmed well-established research findings. Specific results and their relationships with our hypotheses are presented below.
H1: Significant differences in the relative weighting of compensable factors and salary based on perceived ethnicity and gender of the labor pool.
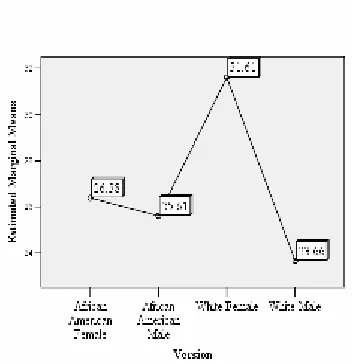
Our finding that the labor pools’ perceived ethnicity and gender impacts salary allocation represents the traditional discrepancy between males and females in salary, we find that African-American males (4.84) and white males (4.76) are being offered salaries of greater magnitude than females, with the largest distinction made between African-American females (3.87), and African-American males. The findings also expended previous research by demonstrating that within women, ethnicity differences also result in differential salary allocations. White females (4.23) in our sample were offered salaries far greater than African American females (3.87). However, both perceived female labor pools were offered salaries much lower than either African-American males or white males (see Figure 2 below).
H2: Significant differences in weighting of compensable factors and salary based on participant demographics.
H2a: Participant ethnicity H2b: Participant gender
In the assessment of the importance of knowledge is a compensable factor in the project management position, Asian participants’ perspectives were extremely stable (36.65 for Asian males, and 36.68 for Asian females) when compared to Caucasian participants. Caucasian males weighting the relative importance of knowledge at 29.72, whereas Caucasian females weighting the importance as 42.91.
The Other category was made up of several ethnicities (African, African-American Black, Caribbean, Latin American, Middle Eastern, Native American, and other) and consisted of 17% of the sample. While difficult to clearly establish specific characteristics of this conglomeration, the weighting was opposite to that made by the Caucasian sample. Specifically, Other males weighed importance of knowledge at 45.60, and Other females weighed the importance of knowledge at 33.16. See Figure 3 below.
other female participants (27.65). See Figure 4 below.
H3: Individual differences play a role in weighting compensable factors/salary allocation and accordingly:
H3a: Impact of participant’s acculturation on the weighting of compensable factors and salary.
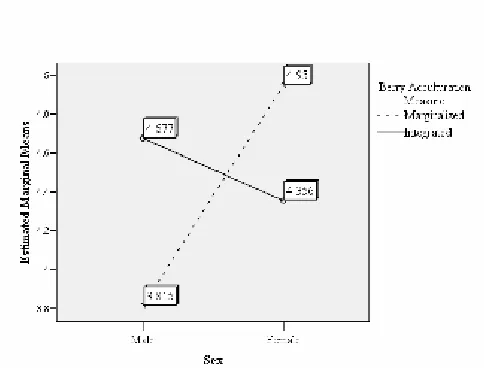
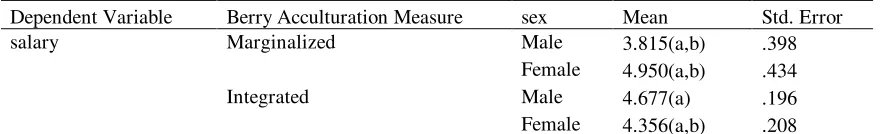
While the impact of group membership on salary discrepancies has been clearly established, little work has been performed on the impact of acculturation and the overall value associated with a specific occupation (in our circumstance, project manager). As such, the interaction between male and female participants and their relative acculturation status presents an important finding. Our sample represented only two of the four potential acculturation classifications (integrated and marginalized). Male participants classified as marginalized offered significantly less salary (3.81) compared to their counterparts in the integrated classification (4.67). Females classified as marginalized offered significantly more (4.95) than their integrated counterparts (4.35). See Figure 5 below.
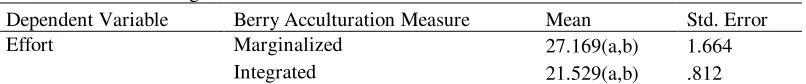
The impact of acculturation also makes an important contribution in understanding the perceived value of compensable factors. Those who are classified as marginalized participants in our study perceived effort as being significantly more important (27.17) than their compatriots classified as being integrated (21.53). See Figure 6 below.
[image:9.612.322.564.72.256.2]integrated group. Both marginalized and integrated groups offered African American women the least salary.
6.
Discussion
The ramifications of potential discrimination at the compensable factors weighting stage of defining compensation internal alignment are tremendous. The implications for pay structure, perceived fairness, and motivation can have a tremendous impact on overall organizational productivity and success. Internal equity discrimination can also have ramifications for litigation.
The most relevant and critical consideration based on our findings is that human decision-making is subject to a wide array of biases that cannot be controlled by the current loosely defined methods of establishing the relative value of compensable factors. Potential ways to defend one’s organization from inadvertent discrimination first need to go beyond the current compensation profession’s best practices [15][9] and potentially approach the topic from a prejudice-reduction perspective integrated from the beginning of the job evaluation (point factor or other method ) through the implementation of the findings across locations [11].
While it is well-established that gender stereotypes do exist for female employees, and have a substantial impact on the way these female employees are perceived [14], there is sparse information on the interaction between gender and ethnicity in the arena of occupational stereotypes. Future research will concentrate on establishing the potential existence of occupational stereotypes for both gender and
ethnicity, as well as control for other related environmental considerations, such as cost of living, and perceived employee availability.
7.
References
[1] Adams, M. (1999). Fair and Square, HR Magazine, 44, p.38-41
[2] Arnault, J., Gordon, L., Joines, D. & Phillips, M. (2001). An Experimental Study of Job Evaluation and Comparable [1] [3] Worth, Industrial and Labor Relations Review, 54, p.806-815
[3] Arvey, R., Maxwell, S., & Abraham, L. (1985). Reliability Artifacts in Comparable Worth Procedures, Journal of Applied Psychology, 70, Issue 4
[4] Arvey, R. (1986). Sex Bias in Job Evaluation Procedures, Personnel Psychology, 39, p.315-335
[5] Berry, J., Kim, U., Power, S., Young, M., & Bujaki, M. (1989). Acculturation attitudes in plural societies. Applied Psychology: An International Review, 38, 185-206.
[6] Blumrosen, RG. (1979). Wage Discrimination, Job Segregation, and Title VII of the Civil Rights Act of 1964, University of Michigan Law Review, 12, p.397-502
[7] Cacioppo, T., Petty, R. & Kao, C. (1984). The efficient assessment of need for cognition, Journal of Personality Assessment, 48, pp. 306-307.
[8] California Law Review (1983). Comparable Worth, Disparate Impact, and the Market Rate Salary Problem: A Legal Analysis and Statistical Application, 71, p.730-775
[9] Chicago Area Partnerships (2003). Pathways and Progress: Best Practices to Ensure Fair Compensation [10]Dasgupta, N., & Greenwald, A.G. (2001). On the malleability of automatic attitudes: Combating automatic prejudice with images of admired and disliked individuals. Journal of Personality and Social Psychology, 81, 800-814.
[11]Devine, P.G. & Monteith, M. J. (1993). The role of discrepancy-associated affect in prejudice. In D.M. Mackie & D.L. Hamilton (Eds.) Affect, cognition, and stereotyping: Interactive processes in group perception. (pp . 317-344). New York: Academic Press.
[12]Grinder, D., & Toombs, L. (1993). Disproving Valuation Discrimination: A Study of Evaluator Gender Bias, ACA Journal, 2
[13]Gunderson, M. (1994). Pay and Employment Equity in the United States and Canada, International Journal of Manpower, 15, p.26-43
[14]Heilman, M., Wallen, A., Fuchs, D., & Tamkins, M. (2004). Penalties for Success: Reactions to Women Who Succeed at Male Gender-Typed Tasks. Journal of Applied Psychology, Vol. 89, No. 3, 416–427
[15]Henderson (2006). Compensation Management in a Knowledge-Based World, 10th edition, Pearson-Prentice-Hall
[16]Heneman (2001). Work Evaluation: Current State of the Art and Future Prospects. World at Work Journal, Volume 10, Number 3, Third Quarter
[17]Jones, J. (1997). Prejudice and Racism, Second Edition, McGraw-Hill Companies, Inc.
[18]Manning, A., & Robinson, H. (2004). Something in the Way She Moves; A Fresh Look at an Old Gap, Oxford Economic Papers, 56, p.169
[19]Martocchio, J. (2004). Strategic Compensation: A Human Resource Management Approach (3rd Ed.) Pearson-Prentice-Hall
[20]Milkovich and Newman (2005). Compensation, 8th edition,. McGraw-Hill Irwin.
[21]Redfield, R., Linton, R., & Herskovits, M.J. (1936) Memorandum on the study of Acculturation. American Anthropologist, 38, 149-152
[22]Rudin, J., & Byrd, K. (2003). U.S. Pay Equity Legislation: Sheep in Wolves’ Clothing, Employee Responsibilities and Rights Journal, 15, p.183-190
[23]Sumner, W.G. (1940) Folkways. Ginn and Company, Boston
[24]Tabachnick, B., & Fidell, L. (1996). Using multivariate statistics (3rd Ed.) Harper Collins
[25]U.S. Census Bureau (200) Projections of the Resident Population by Race, Hispanic and Nativity: Middle Series, 2016 to 2020. (NP-T5-E) Population Projections Program, Population Division, U.S. Census Bureau, Washington, D.C. 20233
[26]US Equal Employment Opportunity Commission (2000). EEOC Compliance Manual, 915.003 [27]29 United States Code, 206, Section 6, paragraph (d)
[28]42 United States Code 2000e-2, Section 703
Appendix A: Compensable Factors Questionnaire
As a Managing Director at ABC Corporation, you have just received the final draft of compensable factors (what tasks and behaviors you will pay employees to execute) from the Human Resources director to determine your internal compensation strategy for the Project Manager position. Your task is to assign points based on the relative importance of the compensable factors to the satisfactory completion of the overall job. Please consider the job description and position related material below to facilitate your assignment:
The Project Manager will be responsible for coordinating various projects for the Director and will have 1 full time assistant reporting to them. On average, they will have three separate projects at any given time that they are responsible for. Three years of relevant work experience is expected. Our labor pool for this position is comprised of 70% Black and 70% women, and we field applicants from three local newspapers.
Assign a percentage to the following compensable factors as relative in importance to the organization. The total percentage needs to add up to 100%. For example, if the person would only need to perform basic tasks or need basic knowledge in the area, then you should have 10% assigned to that compensable factor. In order to assign a high percentage, the person would need to be able to perform complex duties requiring significant knowledge and skills in the compensable factor.
Compensable Factors Your Rating (Please assign % based on instructions above. The % must add up to 100%)
Knowledge/Education/Experience Responsibility
Effort
Working Conditions
Finally, salary surveys have given a range of pay for this position ranging from $50,000 to $85,000. Based on your knowledge of the position, please indicate what salary Human Resources should offer potential Project Manager candidates.
What pay range should be offered for the project manager position? Please circle one. 1. $50,000 - $55,000
2. $55,000 - $60,000 3. $60,000 - $65,000 4. $65,000 - $70,000 5. $70,000 - $75,000 6. $75,000 - $80,000 7. $80,000 - $85,000
1. Age _______
12
For each statement below, indicate how characteristic the statement is of you using the 5-point scale. 1 extremely
uncharacteristic
2 somewhat uncharacteristic
3 uncertain 4 somewhat characteristic
5 extremely characteristic 3. I would prefer complex to simple problems.
1 2 3 4
5
4. I like to have the responsibility of handling a situation that requires a lot of thinking.
1 2 3 4
5 5. Thinking is not my idea of fun.
1 2 3 4
5
6. I would rather do something that requires little thought than something that is sure to challenge my thinking abilities.
1 2 3 4
5
7. I try to anticipate and avoid situations where there is a likely chance I will have to think in depth about something.
1 2 3 4
5 8. I find satisfaction in deliberating hard and for long hours.
1 2 3 4
5 9. I only think as hard as I have to.
1 2 3 4
5 10. I prefer to think about small, daily projects to long-term ones.
1 2 3 4
5 11. I like tasks that require little thought once I’ve learned them.
1 2 3 4
5
12. The idea of relying on thought to make my way to the top appeals to me.
1 2 3 4
5
13. I really enjoy a task that involves coming up with new solutions to problems.
1 2 3 4
5 14. Learning new ways to think doesn’t excite me very much.
1 2 3 4
5 15. I prefer my life to be filled with puzzles that I must solve.
1 2 3 4
5 16. The notion of thinking abstractly is appealing to me.
1 2 3 4
5
17. I would prefer a task that is intellectual, difficult, and important to one that is somewhat important but does not require much thought.
1 2 3 4
5
13
1 2 3 4
5
19. It’s enough for me that something gets the job done; I don’t care how or why it works.
1 2 3 4 5
20. I usually end up deliberating about issues even when they do not affect me personally.
1 2 3 4
5
For each statement below, indicate how characteristic the statement is of you using the 9-point scale. 21. How important is it for you to maintain your cultural group’s values?
Not important Not Sure Very important
1 2 3 4 5 6 7 8
9 22. How important is it for you to maintain US cultural values?
Not important Not Sure Very important
1 2 3 4 5 6 7 8
9
23. Ethnicity (Please circle): African African/American-Black Asian Caribbean Caucasian Latin American Middle Eastern Native American Other
14
Appendix B: Estimated Marginal Means for Significant Main Effects and Interactions
To ensure economic use of space, the following abbreviations will be used: African American Female: AAF
African American Male: AAM White Female: WF
[image:15.612.64.449.182.307.2]White Male: WM
Table 7: Estimated Marginal Means for Version
Dependent Variable Version Mean Std. Error Responsibility AAF 26.381(a,b) 1.719 AAM 25.607(a,b) 1.656 WF 31.611(a,b) 1.686 WM 23.658(a) 1.664 Salary AAF 3.874(a,b) .301 AAM 4.848(a,b) .290 WF 4.238(a,b) .295 WM 4.768(a) .292
[image:15.612.62.465.353.395.2]a Covariates appearing in the model are evaluated at the following values: NeedforCognition = 1.49. b Based on modified population marginal mean.
Table 8: Estimated Marginal Means for Acculturation
Dependent Variable Berry Acculturation Measure Mean Std. Error Effort Marginalized 27.169(a,b) 1.664 Integrated 21.529(a,b) .812
a Covariates appearing in the model are evaluated at the following values: NeedforCognition = 1.49. b Based on modified population marginal mean.
Table 9: Estimated Marginal Means for Ethnicity and Sex
[image:15.612.62.508.443.621.2]15 Table 10: Estimated Marginal Means for Version, Ethnicity and Sex
Dependent Variable Version Ethnicity sex Mean Std. Error Effort AAF Asian Male 27.124(a) 3.255 Female 21.814(a) 2.185 Caucasian Male 27.399(a) 3.500 Female 31.228(a,b) 8.388 Other Male 19.833(a) 4.527 Female 36.551(a) 4.700 AAM Asian Male 30.722(a,b) 2.243 Female 23.244(a) 3.094 Caucasian Male 24.613(a) 2.889 Female 19.051(a) 4.700 Other Male 18.812(a) 4.867 Female 29.617(a,b) 3.420 WF Asian Male 20.325(a,b) 2.331 Female 21.625(a,b) 1.559 Caucasian Male 29.603(a) 2.875 Female 26.228(a,b) 5.948 Other Male 16.228(a,b) 4.870 Female 15.020(a,b) 5.915 WM Asian Male 20.990(a) 3.127 Female 19.452(a) 3.128 Caucasian Male 31.256(a) 4.523 Female 19.159(a) 3.222 Other Male 20.020(a) 5.122 Female 24.093(a) 4.678 a Covariates appearing in the model are evaluated at the following values: NeedforCognition = 1.49. b Based on modified population marginal mean.
Table 11: Estimated Marginal Means for Acculturation * Sex
[image:16.612.60.501.475.542.2]16
Table 12: Estimated Marginal Means for Ethnicity * Acculturation * Sex Dependent Variable Ethnicity
Berry Acculturation
Measure Sex Mean Std. Error effort Asian Marginalized Male 26.228(a,b) 4.229 Female 21.962(a,b) 3.075 Integrated Male 23.705(a) 1.153 Female 21.190(a) .927 Caucasian Marginalized Male 34.376(a) 2.892 Female 21.515(a,b) 4.287 Integrated Male 22.060(a) 1.984 Female 23.110(a,b) 2.837 Other Marginalized Male 20.479(a,b) 4.867 Female 40.020(a,b) 5.915 Integrated Male 18.031(a) 2.420 Female 21.471(a) 2.262 a Covariates appearing in the model are evaluated at the following values: NeedforCognition = 1.49. b Based on modified population marginal mean.
Table 13: Estimated Marginal Means for Sex * Version * Ethnicity * Acculturation Dependent
Variable Version Ethnicity
Berry Acculturation
[image:17.612.66.514.322.508.2]17
Table 14: Estimated Marginal Means for Sex * Version * Ethnicity * Acculturation, continued Dependent
Variable
Version Ethnicity Berry Acculturation Measure
sex
Mean Std. Error AAM Asian Marginalized Male .(a,b) .
18 Table 15: Estimated Marginal Means for Sex (New Labor Pool)
Dependent Variable Sex (New Labor Pool) Mean Std. Error Knowledge Female 33.507(a,b) 1.805 Male 40.321(a,b) 1.702 Responsibility Female 28.415(a,b) 1.248 Male 24.544(a,b) 1.177 effort Female 25.295(a,b) 1.239 Male 22.806(a,b) 1.169 Working Conditions Female 13.276(a,b) 1.153 Male 12.883(a,b) 1.088 salary Female 4.015(a,b) .219 Male 4.804(a,b) .206
a Covariates appearing in the model are evaluated at the following values: NeedforCognition = 1.49. b Based on modified population marginal mean.
Table 16: Estimated Marginal Means for Sex (New Labor Pool)*Acculturation Dependent Variable
Berry Acculturation Measure
Sex (New Labor
[image:19.612.61.495.283.579.2]