EFFECT OF TEMPRETURE AND FREQUENCY ON THE ELECTRICAL
PROPERTIES OF POLYSTYRENE COMPOSITE CONTAINING OIL
SHALE PARTICLES
Abeer Adaileh and Husam Miqdad
Department of Basic Science, Applied Science Private University, Amman, Jordan E-Mail: [email protected]
ABSTRACT
The electrical properties of prepared oil shale/polystyrene composites with concentration 30 wt. % of oil shale were studied in this paper, under various measuring conditions including temperature and applied electric field frequency. The dependence of AC-electrical properties of oil shale/polystyrene composites on frequency and temperature were studied using the AC impedance technique.The impedance measurements were performed in the frequency range (100 kHz - 1.5 MHz) and its thermal behavior was studied within the temperature range (30ºC - 90ºC). Impedance, dielectricconstant and AC-conductivity showed frequency and temperature dependencies. The relaxation time was determined as a function of temperature. The study includes application of some models to explain the observed results. The universal power law of the AC conductivity behaviour is satisfied for a certain concentration and at different temperatures.
Keywords: oil shale, composites, impedance, dielectric constant, AC conductivity.
1. INTRODUCTION
Many of our modern technologies require materials with uncommon combination of properties that cannot be met by the conventional polymeric materials, metal alloys and ceramics. Material property combinations and ranges have been, and are yet being, extended by the development of composite materials [1].
Composite materials have been utilized to solve technological problems for a long time, but in the 1960s did these materials start draw attention of industries with the introduction of polymeric-based composites. Since then, composite materials have become common technical materials that are designed and manufactured for several applications. Today, it appears that composites are the materials of choice for many engineering and sciences applications.
The most advanced composites are polymer matrix composites. They are characterized by relatively low costs, simple manufacturing and high strength. In general, added to the matrix to improve or alter the matrix properties. The reinforcement forms a discontinuous phase that is dispersed uniformly throughout the matrix [2, 3].
Polystyrene is a polymer which finds widespread use in the developed world due to its desirable properties, combined with its relative cheapness. Among its features are excellent color range, transparency, rigidity, and low water absorption. Polystyrene can be polymerized with butadiene to make high impact polystyrene (HIPS) or expanded with pentane to make plastic foam, which is made in the form of foam packaging and insulation (Styrofoam is one brand of polystyrene foam). Also, it can be transparent or can be made to take on various colors [4].
The term oil shale refers to a class of fine-grained sedimentary rocks containing high concentrations of organic material, called kerogen that can be a source of
accumulations of sediments and organic matter deposited in anoxic environments. As the deposits are buried by additional sediment, high temperature and pressure remove water and enable chemical reactions that transform the organic matter into kerogen. These reactions can proceed at greater temperatures to produce oil, but oil shale have not been buried to sufficient depths to allow this further conversion [5]. Oil shale typically contains enough hydrocarbons to burn in raw form and can be used directly as a solid fuel. However, producing oil from kerogen requires pyrolysis, an energy intensive process in which the rock is heated to 450-550oC in the absence of oxygen. The industrial procedure used to convert oil shale into useful hydrocarbons is called "retorting''.
2. EXPERIMINTAL WORK
2.1 Materials and Composites Films Preparation Oil shale/polystyrene composites with filler concentration 30wt% oil shale and neat polystyrene were prepared. Oil shale rocks were obtained from region located in south of Jordan and embedded at about 10m depth in the ground. The deposit filler was grinded into powder and chemically purified. A summary of chemical, physical property, and morphology of the oil shale deposits were reported previously [6, 7]. Polystyrene resin and oil shale powder with grain size of about 63 mm were thermally mixed in a Brabender-like apparatus at a temperature of 180ºC and a pressure of 150 bar in a heat press. The compressed molded composite sheets were about 1.3 mm thick.
2.2 SEM microscopy
exhibit good distribution and strong adhesion of the oil shale particles within the polymer matrix.
2.3 Electrical Measurements
The AC electric properties of the oil shale /PS composite were studied through measurements of the impedance (Z), and the phase shift angle (
) by using LF Impedance Analyzer (HP model 4192). Impedance measurements were done at different temperatures and applied field frequency range from 100 kHz to 1.5MHz over a range of temperature (30ºC - 90 ºC). The test specimens were placed firmly between two copper electrodes in a sample holder. These electrodes were connected through cables to the impedance analyzer. Disk-shaped specimens with 2 cm diameter and 1.3mm thick were cut from the prepared sheets. The test specimens were placed firmly in a cell between two copper electrodes connected through cables to the impedance analyzer. The cell was placed in an oven and the temperature was measured by thermocouple wires. A period of about 20 min was maintained between successive impedance measurements to allow a steady state of temperature to be reached. The impedance analyzer reads values of impedance and phase angle of the specimen by varying the applied frequency. The mean and standard deviations were estimated with average error of about 3-5%.The complex impedance of the sample with the real and imaginary components can be calculated by:
Z' = Z cos φ (1)
Z'' = Z sin φ (2)
The dielectric constant ' and the dielectric loss '' of the sample are calculated from the following equations [9]: 2
2
"
Z
fC
Z
o
(3) 22
Z'
Z
fC
o
(4)where f is the frequency of the applied AC electric field and C0 is the capacitance of the two plates of the cell (capacitor) without the sample (dielectric), and is given by:
Co = εo A / d (5)
Here A is the area, and d is the thickness of the test specimen.
where εois the electrical permittivity of free space (εo = 8.854 x 10⁻¹² F.m-1).
The AC conductivity of the sample calculated from the following equation: [10]
σAC= 2π f εoε'' (6)
3. RESULTS AND DISCUSSIONS
The electrical properties of oil shale/polystyrene composite, containing 30% weight oil shale were studied and some of their physical parameters such as the AC electrical conductivity, relaxation time were determined.
3.1 Dependence of Electrical Properties on Temperature and frequency
The thermo-electrical behavior of oil shale/PS composite is examined at temperatures (30, 45, 60, 75 and 90 °C) under different frequencies. The variation of impedance (Z) with frequency at different temperatures is shown in Figure-2 and Figure-3. It is clear that impedance decreases with increasing temperature and strongly affects the impedance behavior at low frequencies. This may be explained in terms of certain events such as charge carriers' generation, increasing ionic mobility, and closing up the energy gap. These processes affect the charge carriers' transport in the composite bulk. Generally, the total observed current may be assumed as a superposition of polarization and conduction current effects. The polarization current depends on temperature, whereas the decay time of polarization is shortened by increasing temperature. This behavior proves that the conductivity increases as temperature increases, similar to semiconducting and ionic solids [11].
0 200 400 600 800 1000 1200 1400 1600 0
20 40 60 80 100 120
Impedanc
e (M
m
)
Frequency (kHz)
30 oC 45 oC 60 oC 75 oC 90 oC
Figure-2. Impedance versus frequency for 30 wt. % oil shale/PS composites.
Figure-4. Dielectric constant versus frequency for 30 wt.% oil shale.
0 200 400 600 800 1000 1200 1400 1600
0.03 0.04 0.05 0.06 0.07 0.08 0.09 0.10 0.11 0.12
Diel
ect
ric
los
s (
)
Frequency (kHz)
30 oC 45 oC 60 oC 75 oC 90 oC
Figure-5. Dielectric loss vs frequency for 30 wt. % oil shale.
Figure-6 represents the AC conductivity (σAC), calculated from equation (6), versus frequency at different temperatures. Also, the variation of the AC conductivity with temperature is shown in Figure-7 at the frequencies (200, 400, 600, and 800 kHz). It was found that AC-conductivity values increase as temperature increases for all frequencies, which is similar to ionic and semiconducting materials.
The rapid increase in σAC, is mainly
AC-ionic conduction due to impurities existing in both the polymeric matrix (PS) and the filler (oil shale).
Electron emission facilitated by the increase in the chain mobility by the filler concentration.
Maxwell-Wagner buildup of interfacial charges at the PS/filler interfaces.
Hopping of charge carriers over smaller barrier heights.
0 200 400 600 800 1000 1200 1400 1600
-1 0 1 2 3 4 5 6 7
30
oC
45
oC
60
oC
75
oC
90
oC
AC Conduc
tiv
ity
x1
0
-6
(ohm.m)
-1
Frequency (kHz)
Figure-6. AC-conductivity versus frequency for 30 wt. % oil shale composites.
1.5 2.0 2.5 3.0 3.5 4.0
duc
tiv
ity
10
-6
(oh
m.m)
-1
3.2 AC Conductivity Model at Different Temperatures The universal relation of the AC-conductivity is given by the power law form as:
σAC (ƒ) = σDC + B ƒ m (7)
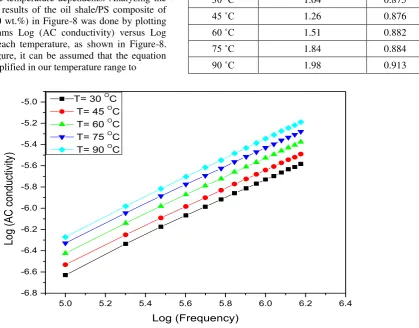
where B and m are coefficients, ƒ is the frequency of the applied field (Hz), σ DC is the DC conductivity of the material and σAC is the AC conductivity of the material in (Ω.m)-1. At higher frequencies the conductivity increases as a power of frequency with exponent 0 < m < 1. In this case B and m are temperature dependents. Analyzing the AC conductivity results of the oil shale/PS composite of concentration (30 wt.%) in Figure-8 was done by plotting common logarithms Log (AC conductivity) versus Log (frequency) for each temperature, as shown in Figure-8. Based on this figure, it can be assumed that the equation above can be simplified in our temperature range to
σ ≈ B ƒ m (8)
From these figure we can estimate the coefficients B and m. The results are shown in Table-1 which shows that the values of (B) increase with increasing temperature and all m values are close to 1.
Table-1. Estimated B and m coefficients for (30 wt. %) oil shale/PS composite.
Temperature B x10-11(Ω.m)-1 (Hz)-m m
30 ˚C 1.04 0.875
45 ˚C 1.26 0.876
60 ˚C 1.51 0.882
75 ˚C 1.84 0.884
90 ˚C 1.98 0.913
5.0 5.2 5.4 5.6 5.8 6.0 6.2 6.4
-6.8 -6.6 -6.4 -6.2 -6.0 -5.8 -5.6 -5.4 -5.2
-5.0 T= 30
O
C T= 45 OC T= 60 OC T= 75 OC T= 90 OC
Log (AC c
onduc
tiv
ity
)
[image:7.595.120.540.229.557.2]Log (Frequency)
Figure-8. Variation of log (AC-conductivity) versus log (frequency) for the 30 wt. % oil shale composite.
3.3 Cole-Cole Plots and relaxation time
Figure-9 shows Cole-Cole plots for dielectric loss (ε'') versus the dielectric constant (ε') for the composite sample of (30 wt. %) oil shale/PS at different temperatures. The construction plane plots are distorted arcs exhibiting different electrical conduction processes with relaxation time spectrum.
3.0 3.2 3.4 3.6 3.8 4.0 4.2 4.4 4.6 4.8 5.0 0.03
0.04 0.05 0.06 0.07 0.08 0.09 0.10 0.11 0.12
Diel
ect
ric
los
s (
)
Dielectric constant ()
30 oC
45 oC
60 oC
75 oC
90 oC
Figure-9. Cole-Cole plots for 30 wt.% oil shale/PS composite at different temperatures.
30 40 50 60 70 80 90
1.5 2.0 2.5 3.0 3.5 4.0 4.5 5.0 5.5
Relaxa
tion
time
10
-6
(se
c)
Tempreture
Figure-10. Variation of relaxation time with temperature for 30 wt. % oil shale /PS.
3. CONCLUSIONS
The present study deals with the AC-electrical properties of oil shale/polystyrene composites with a
The relaxation time () showed variation with the oil temperature and frequency. The calculated (τ) values decrease with increasing temperature; this may be to ionic mobility.
The Bruggman’s formula gives a bitter fit of the observed dielectric data of the studied composites.
The overall AC conduction taking place in the composites is attributed to some processes as transport of the charge carriers and polarization.
The universal power law of the AC conductivity dependence on frequency and temperature is satisfied.
ACKNOWLEDGEMENTS
The author acknowledges Applied Science Private University, Amman, Jordan, for the fully financial support granted of this research article.
REFERENCES
[1] Callister William D. 2007. Material Science and Engineering. An Introduction, (4th edition), New York: John Wiley and Sons.
[2] Alenbach H. and Kissing W. 2004. Mechanics of Composite Structural Elements, Berlin: Springer-Verlag.
[3] Mallick, P. K. 1997.Composites Engineering Handbook, Marcel Dekker Inc, New York.
[4] Fouasser J. P. and Rabek J.F. 2000. Lasers in Polymer Science and Technology: Applications. CRC, CRC press Inc. Florida.
[5] Killops V. 2005. Introduction to Organic Geochemistry, (2nd.). Blackwell Science Ltd. USA.
[6] Ahmad M, Abdallah M and Zihlif A. 1991. Electrical properties of oil shale rocks. J Mater Sci; 26: 203-207.
[7] Ahmad MS, Abdelazeez MK and Zihlif AM. 1990. Microwave measurements on oil shale rocks. J Mater Sci. 25: 5019-5024.
[8] Ragosta G. and Zihlif A. 2009. Thermal Characterization of Oil Shale/PS Composites. (Private Communication).
[9] Elimat Z. M. 2008. AC Electrical Properties of Epoxy / Silicon Carbide Whiskers Composites Coated with TiO2 and Poly (divinylbenzene). Journal of reinforced
[10]Hummel R. E. 1993. Electronic Properties of Materials, (2nd ed). Springer-Verlag, New York.
[11]Nofal O. M. and Zihlif A. M. 2008. Dielectric and AC Conductivity of Rockwool Fibers/Polystyrene Composites. M. Sc. Thesis, Jordan University, Faculty of Science, Physics Department.
[12]Sbeih S. A. and Zihlif A. M. 2009. Optical and Electrical Properties of Kaolinite/ Polystyrene Composite. Journal of Physics D: Applied Physics. 42(2009): 165408 (p. 7).
[13]Shahin M., Al-Haj Abdallah M. and Zihlif A. 1996. Temperature Dependence of Electrical Properties of Epoxy-Glass Microballoons Composite. Journal of Polymeric Materials. 13: 253-257.