Use of information Resources and Services in City
Central Library, Mysore and Branch Libraries
Chandrashekara J
*, Dr. Adithya Kumari H
**, Mohan B.S
****
Librarian, Vidya Vikas Institute of Engg. And Technology, Mysore
**
Assistant Professor (S.G.), University of Mysore, Mysore
***
Asst. Librarian, Indian Institute of Astrophysics, Bangalore
Abstract- A Study on use of information resources and services of City Central Library and its branch libraries, Mysore , Karnataka State, India shows that majority of users were men between the age group of 16 – 25 years and they included unemployed graduates and students who visit the library daily. Most of the users are also member of the library. They got acquainted with the libraries through their friends and through mobile library services. They opine that the location of library and working hours are convenient to them. They visit the library for educational purpose. Most of the users spend 2 hours per day in the library. Short stories, adventure story books, biographies, sports literature and general books were the most frequently read information sources of interest to the users. Concludes that since majority of the users are students and unemployed youth, public libraries need to enrich their information resource collection, provide access to Internet and offer community-based services, including literary programs. Public libraries need to take proactive approach in motivating users to use these resources and services to enhance their competence level.
Index Terms- City Central Library, Branch Libraries, Use, Collection, Services, Karnataka, Mysore
I. INTRODUCTION
he public libraries are the potential social institution to mould the human resource and help to make it more productive and valuable by their information educational, cultural and recreational services. Unesco Public Library Manifesto (1994)(03) has made it clear that the public library is a local gateway to the world of knowledge, information and culture. It is a democratic social institution, which provides equal access to all the citizens. Further, it states that it should provide special services to those who are unable to make use of the regular services for whatever the reason.
“Public library is people‟s university”. Public library is get open one and all irrespective of is access, cost, community, educated states, socio-economic background etc. It is support are community at large Karnataka Public Library Act-1965 provides for City Central Library in each city having more then 1 lakh population Mysore City Central Library starter early 19th century as a municipal library come empirical Karnataka Public Library System shone after the amalgamate the KPL Act in 1965. Seen in sauce this library in considers to be need from people in Mysore city after the permission new Act. Its activity is nearly main branch at open with in irrespective to serve larger population
people observed background visit this public library with different approaches there unemployed youth, educated class, business class, house wife, children all visit this library to see information of the requirement this study of information needs. Heterogeneaces group of user proved let main change to develop library collection improves library services incest new activity. Therefore present study popular to new the information need of different class of City Central Library.(02)
City Central Library, Mysore
The City Central Library is a 92-year-old treasure house which has served as a „Bodhi‟ tree for hundreds of knowledge seekers. The Library situated on Sayyaji Rao road houses a collection of over 55,000 rare books. It keeps adding new books every year with the Octroi funds of Rs 3,43,000 which it gets from the State Government and 6 per cent Library Cess from Mysore City Coopuration, which is about Rs. 80 to 85 lakhs. Established in 1915 during the reign of Nalvadi Krishnaraja Wadiyar, it was handed over to the Government during 1965, when the Public Library Act was passed. Presently, the library has 8 Branches,11 Service Stations, 3 Reading Rooms and a Mobile Library. In total, it has over 8,88,896 books and 41,852 members. A Competitive Examination Centre was added to the library in 2009-10. One can become a member at the City Central Library by paying Rs 25, Rs 30, Rs 40 to borrow 1, 2 and 3 books respectively.(01) The same card holds good to borrow books from the branches, service stations and mobile library.
Review of Literature
B. Yicmaz (06) reports results of a sociological and demographic study of public library users in Ankara, Turkey, in order to determine the level of public use and to isolate the factors affecting this usage. He conducted thorough survey of the history and statistics of Turkish public libraries. It is followed by the results of the user survey, employing the society survey method, involving 1800 users (aged 6 years and over) in 3 socioeconomic strata‟s. The study took usage of the library as the dependent variable and demographic and socioeconomic properties (age, sex, marital status, educational level, occupation, income level and geographic past) as the independent variables. Other socioeconomic factors (social status and social role) were also considered.
L, Tabgen(05) reports on a survey of public library use in Trondheim, Sweden by immigrants published in 1995, in order to provide a foundation for introducing relevant initiatives to improve services. He also discusses the nature of the survey and how it was carried out and then outlines its findings in the areas
of level of use of the library, ways in which it is used, and user satisfaction.
Willard and Teece (04) have conducted a random sample survey of actual users of public library to determine the purpose of user‟s visit to the local public library. They found 50% of people visit the library to choose material by means of browsing while less than 20% to obtain a specific item or answer an information need.
II. OBJECTIVES OF THE STUDY
1. To know the personal background of users in City Central Library,
2. To understand the frequency of users visit to the public libraries.
3. To assess weather users are satisfied with the location of the libraries.
4. To know the popular magazines, competitive magazines, comics, news papers that the users are interested most and whether they are available in the public libraries.
5. To study weather the users in public libraries have adequate, natural and artificial light, ventilation, power supply, drinking water, sanitary facilities etc.
6. To find out weather the users in public libraries have adequate space to house books and facilitate reading,
7. To know weather-working hours of city central libraries and their branch libraries are convenient to the users.
8. To identify the subject areas of the book collection in city central libraries and branch libraries
9. To assess the opinion of libraries about the users library collection in city central libraries and branch libraries.
10. To study the extension services provided by city central libraries and branch libraries for users.
11. To study whether public libraries provide user orientation and extend assistance to public library users.
Need and Importance
However no effort is made to study the information use patterns of users of public library facilities in Mysore city. Therefore this study attempts to understand what type of information is needed by users of Mysore City Library. The study aims to understand the socio-economic, educational and occupational background of public library users. It studies users and the types of information, the purpose for which they look for information in the library.
Scope and Limitations
The scope of the study is limited to CCL and its branch libraries in Mysore city. The study covers all type of users irrespective of age, sex, education attainment, socio-economic status etc.
Methodology
It is a survey. A questionnaire was specifically designed to elicit the opinions of the users of public libraries in Mysore city and distributed to 1200 users of City Central Library and Branch Libraries on random basis. Out of 1200 questionnaires distributed, 835 filled questionnaires were received, individual response is 69.58%. The questionnaire contains questions related
to background information about the user, user information requirement, approaches to various types of information, opinion about the availability of required information in the public library, other means adopted for fulfilling required information etc
Distribution of Respondents by Age
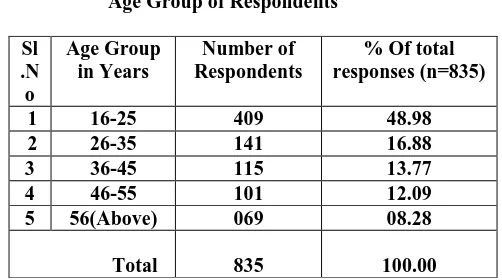
[image:2.612.333.584.224.364.2]Different age groups will have different interests in information they want and the approach of children, adults are also different; as they have varied interest in information they seek. The 835 respondents are categorized into 5 age groups as shown in Table 1.
Table 1
Age Group of Respondents
The above table shows that among 835, the 409 (48.98%) respondents are between the age group of 16-25 years, 141 (16.88%) are between the age group of 26-35 years, 115 (13.77%) respondents are aged between 35-45 years, 101 (12.09%) respondents are 46-55 years of age and 69(08.28%) respondents are above 55years of age. So that, the majority of the users 409(48.98%) belonging to the age group of 16 to 25 years.
Educational qualification
Educational level of library user is another important criterion to determine user need. Hence information needs of low-level educated person is different to person with higher educational qualification, therefore data regarding educational qualification is presented in table 2.
Table 2
Educational Qualification of Respondents Sl
.N o
Age Group in Years
Number of Respondents
% Of total responses (n=835)
1 16-25 409 48.98
2 26-35 141 16.88
3 36-45 115 13.77
4 46-55 101 12.09
5 56(Above) 069 08.28
Total 835 100.00
Sl. No.
Qualification of Education
Number of Respondent
% Of total
responses (n=835)
1 S.S.L.C. 124 14.99 2 Pre-University 189 22.83 3
Under-Graduates
339 40.79 4 Post-Graduates 183 21.39
[image:2.612.325.582.597.723.2]The above table shows that the different levels of education among the respondents. Among 835 respondents, those who have S.S.L.C are 124 representing 14.99%, 189 respondents are having Pre-University education and they represent 22.83%, 339 respondents have completed their under graduation and they represent 40.79% and 183 are Post-graduates representing 21.39%. The table shows that 40% of total respondents are Graduates.
Gender Distribution
Gender of the library users is also considered as other criteria as there could be a difference in the reading interests between males and females. Therefore the information regarding gender of the users was obtained and is presented in the figure below.
Figure 2
The Gender wise division of the respondent
86.4 13.54
male female
The above figure demonstrates that there are 722 male users, against 113 female users. They represent 86.46% and 13.54% respectively, thus it is observed that male users one more than female users.
Occupations of Users
[image:3.612.38.295.276.408.2]The individual‟s occupation greatly influences not only information need but also information use. The employed person may use the library less where as an unemployed person use the library all the time. The interest of unemployed youth may be different from the employed person and from the information need. Therefore information relating to employed users and unemployed users and other types of users who usually use the public libraries is analyzed and presented in the table-3.
Table-3
Occupation of Respondents
Sl.No. Occupation Number of
Respondents
% Of total responses (n=835)
1 Students 324 38.80 2 Unemployed 175 20.95 3 Employment private
section
83 09.94 4 House wives 82 09.82 5 Employed in Government 68 08.14
Department
6 Agriculturists 37 04.43 7 Industrialists 33 03.96 8 Businessmen 33 03.96
Total 835 100.00
The above table shows that among 835 respondents, 324 are students, 175 are unemployed, 83 are private employees, 82 are housewives and 68 are employed in government departments. They represent, 38.8%, 20.95%, 09.94%, 09.82%, and 08.14% respectively. From the remaining 103 respondents, 37 are agriculturists, 33 are industrialists and 33 are businessmen. They represent 04.43%, 03.96%, and 03.96% respectively. The table also demonstrates the status of users who are coming from different occupation. The users are distributed in all categories. The number of unemployed is almost 21% of the total library users.
Membership to Public Library
As all the users of the public libraries may not be the member of the library, the respondents were asked to state whether they are the members of the public library or not. The same data is presented in the figure 3.
Figure 3
Membership of Public Library
The Figure shows that out of 835, 673 users are member of public library as against 162 are nonmembers. They represent 80.59% and 19.41% respectively.
Acquaintance with Library
Users come to know about the library through different sources. With this background data is obtained from the respondents the library about their source of acquaintance about the library. The table 4 presents data relating to this.
Table 4
Acquaintance with City Central & Branch Libraries.
Sl.No Mode of
Acquaintance
Number of Respondents
% Of total responses (n=835)
1 Through Friends 342 40.95 2 Mobile libraries
moving around city
[image:3.612.312.536.362.511.2]3 Radio & TV announcements
92 11.01 4 Through parents 80 09.58 5 Paper advertisement 62 07.42 6 Library news in local
news papers
56 06.70 7 Through other
sources
86 10.33
Total 835 100.00
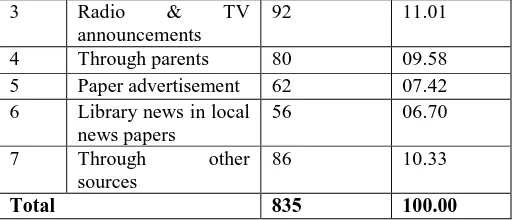
It may be observed from the above table about 40.95% respondents could acquaint with libraries through introduction by their friends and nearly 14.01% users got acquaintance through Mobile Library service. There are about 11.01% of users that were inspired to acquaint with the library through Radio and TV announcements. About 9.58% of respondents could acquaint with libraries through the introduction by their parents. About 7.42% respondents became aware of the public library services through paper advertisements. While 54 respondents were influenced by library news in local news papers they representing 6.7%. There are 10.33% users who got acquaint with other sources.
Frequency of visit to the library
The frequency of library visit by the users may differ from one another depending upon the purpose they visit and distance of the library. The respondents were asked to provide information about the frequency of their visit to library. The responses received and analyzed and are presented in table-5.
Table 5
Frequency of visit to library by the users
The Table 5 exhibits that 342 (40.95%) users visit library daily, 164 (19.64%) users visit library twice a week, 103 (12.33%) users visit library thrice in week, 92 (11.01%) users visit library once in week, 83 (9.94%) users visit library once in a fort night, 27 (3.24%) users visit library once in a month, 24 (2.89%) users visit library occasionally.
Infrastructural Facilities
The public libraries must have basic infrastructural facilities to attract its users. So the data is gathered about the
[image:4.612.40.299.58.168.2] [image:4.612.30.280.455.591.2]location, working hours, area of library building etc and the same is presented in the Table 6.
Table 6
User Opinion about Infrastructural Facilities of the Libraries
Sl.No Infrastructural Facilities
User opinion
Number of Respondents (n=835)
% Of
total responses
1.
Location of the Library
Centrally Located
539 64.55
Not Centrally Located
224 26.83
Not Responded
072 08.62
2
Working Hours
Convenient 689 82.51
Not Convenient
146 17.49
3
Area of
Library Building
Adequate 369 44.19
Partially adequate
263 31.49
Not adequate
203 24.32
4 Furniture and
equipments
Adequate 314 37.60
Partially Adequate
278 33.29
Not Adequate
243 29.11
Sl.No Frequency Visit Number of
respondents
% Of total responses (n=835)
01 Daily 342 40.95 02 Twice in week 164 19.64 03 Thrice in week 103 12.33 04 Once in week 092 11.01 05 Once in fort night 083 09.90 06 Once in a month 027 03.24 07 Occasionally 024 02.89
5
Browsing space for users
Adequate 452 54.13
Not Adequate
258 30.89
Not Responded
125 14.97
6
Natural Light and
Ventilation
Adequate 474 56.76
Partially adequate
209 25.02
Not adequate
152 18.22
7 Electric Fans
Adequate 339 40.59
Partially adequate
207 24.79
Inadequate 289 34.62
8
Drinking Water Facility
Adequate 237 28.38
Partially adequate
211 25.26
Not adequate
387 46.36
9 Parking space
for Vehicles
Exists & adequate
277 33.17
Exists but not adequate
146 17.48
Does not exist
412 49.35
The table exhibits that out of 835 total respondents 539 (64.55%) contend that the libraries they use arecentrally located whereas 224 (26.83%) respondents partially agree that the libraries they use are housed in central place. However
72(8.62%) respondents disagree to the view that the libraries they use are centrally located.
The table also shows that there is 689 users representing 82.51% find the working hours convenient as against 146 users representing 17.49% who find it is not convenient. The working hours of city central libraries and branch libraries seem to be convenient to larger public.
The table shows that about 44.19% of respondents contended that the space provided in the library for different purposes is adequate and about 31.49% respondents contend that the space is partially adequate, whereas about 24.32% respondents opinion that the space is inadequate.
The table shows that 835 respondents have expressed their opinion about the adequacy of furniture. Out of total of 835 who have responded to the specific question 314 (37.60%) contend that the furniture‟s in their libraries are adequate, whereas 243 (29.11%) of the total feel that the furniture‟s are insufficient and adequate in their libraries. There are 278 respondents representing 33.29 % of the total who have expressed that the furniture‟s in their library are partially adequate. Thus 243 users‟ libraries have not equipped with adequate furniture.
The table shows that about 54.13% respondents contented that the browsing space for users is adequate as against 30.89% who feel that the space is not adequate. There are nearly 14.97% respondents who have not indicated their opinion.
Table 6 exhibits that for 474 respondents, out of 835, representing 56.76% of the total expressed that the libraries they use have adequate natural light and ventilation against 152 (18.22%) respondents who have responded negatively. There are 209 (25.02%) respondents who contented that the natural light and ventilation in their libraries is partially adequate.
The table shows that around 41% users are of the opinion that the electric fans facility provided in the library is adequate against 34.62% of respondents who contented that this facility is inadequate. Of the remaining 24.79% respondents feel that the facility is partially adequate.
The table shows that around 28% of users opined that the water facility in libraries is adequate against 46.36% respondents who say that there is no water supply facility and 25.26% contented that the water supply is partially adequate. Thus, the water supply facility in libraries seems to be very poor.
The Table shows that about 33.17% respondents express that there is a provision of adequate vehicle parking space against 49.35% respondents who say that there is inadequate space for parking vehicles. About the 17.48% users have expressed that the parking space exists but not adequate.
Purpose of Visit to the Library
Figure 4
Purpose of Library Visit by the Users
0
200
400
600
800
672 628 596357
291 249 243
For educational studies To gather information To read newspapers For recreation
Special cultural Programmes
The Figure 4 shows that large number of users that they visit libraries for educational studies. They account for 80.47% (672 respondents) of the total. The second important purpose for which most of the users visit libraries is to obtain information on various aspects of their interest. They are 628 in number accounting for 75.20% of the total. There are 71.37% users who visit libraries for reading newspapers and about 42.75% users visit libraries for recreation purposes. Those who visit libraries for attending special cultural programmes are 291 (34.85%), they are 249 users representing 29.82% of the total visiting the library to meet total visiting the library to meet their friends. 243 users around 29.10% visit library for borrowing books. Majority (80.47%) of the users visit the library for educational studies regarding current events.
Hours of Spending in the Library
The serious users normally stay in library for longer hours. To trace the time period spent in library during every visit by the users the data is sought. The responses received are analyzed and presented in table-7.
Table 7
Duration of Time Spent in the Library by the Respondents
The table 23 shows that most of users spend on an average two hour per day in libraries. They account for 23.35% of total respondents. There are about 21.43% users who spent three hours per day in libraries. Another 19.88% respondents spend in the library four hours per day. There are 15.80% respondents spend one hour per day. There are 11.73% users who use library for five hours per day, remaining 7.81% respondents spend in the library more then five hours per day.
Reading Interests Among Users
To know the type of documents that the users are interested in reading, the researcher has identified 18 varieties of documents and asked the users to indicate their priorities. The data obtained from respondents is tabulated and presented in table 8 where in the type of documents are arranged in the descending order of preference by users using public libraries.
Table 8
Reading Interest among User
Sl. No
Variety of books of interest
Number of respondents
% Of total responses (n=835)
01 Short stories 588 70.41 02 Adventure stories 572 68.50 03 Biography 519 62.15 04 Sports literature 483 57.84 05 General books 477 57.12 06 Poetry 384 45.98 07 Sacred stories 357 42.75 08 Tours & travels 305 36.05 09 Text books 284 34.01 10 Detective 279 33.41 11 Fiction 187 22.39 12 Riddles 163 19.52 13 Historical
document
159 19.04 14 Social literature 148 17.72 15 Philosophy 137 16.40 16 Folk literature 129 15.44 17 Religious books 113 13.53 18 Mythological
documents
97 11.61 19 Others 69 08.26
Sl.
No. Duration Per Day
Number of Respondent s
% Of total
responses (n=835)
1 Two hours 195 23.35 2 Three hours 179 21.43 3 Four hours 166 19.88 4 One hour 132 15.80 5 Five hours 98 11.73 6 More then five hours 65 07.81
The table 8 exhibits that as many as 70.41% respondents are interested in reading short stories. This is followed by adventure stories where in 68.50% users respectively are interested. Biographies occupy third place and they are followed by sports literature and general books. The number of users interested in these documents account for 62.15%, 57.84% and 57.12% respectively. There are about 45.98% and 42.75% respondents interested in poetry and users interested in sacred stories and 42.52% user are interested in tours and travels books. Those users who are interested in text books, detective books, fiction, riddles, historical documents and social literature account for 34.01%, 33.41%, 22.39%, 19.52%, 19.04% and 17.72% respectively. There are 137 (16.40%) and 129 (15.44%) users who are interested in philosophy and folk literature. Those who are interested in religious books and mythological documents account for 13.53% and 11.61% respectively. There are 69 users representing 8.26% of the total respondents who are interested in drawing, painting art and sculpture books.
Availability of Books, Newspapers and Magazines of Interest
Books, news papers and popular magazines are important sources of information for users. Today‟s users read books, news papers and magazines regularly to update their knowledge and to keep themselves up to date with the day-to-day happenings. To know the opinion of the users about availability of books of their interest, newspapers and magazines in their libraries the information is sought and is presented in the table 9.
Table 9
Availability of Books, Newspapers and Popular Magazines of their Interest in the library
User Opinion
Number of
respondents
% Of total responses (n=835)
Books
Available
372 44.55 Partially
available
270 32.36 Not
available
192 22.99
Newspapers &
Magazines
Partially Available
326 39.04
Available
233 27.90 Not
Available
276 33.06
The Table 9 shows that there are about 44.55% users who express that the books of their interest are available in the library against 32.36% of user who positively express the partially availability their interested books. There are 22.99% users who expressed negatively about the not availability of books. Thus it may be inferred that in majority of libraries, the books of interest and useful to the users are available. The table also exhibits that there are 39.04% users who opinion that the newspapers and magazines required by the partially available in public libraries, as against 33.06% users who express that the required newspapers and magazines are not available in the public
libraries. There are 27.9% users who expressed that required news papers/magazines are available in public libraries.
Availability of Non-Book Materials and Other Facilities
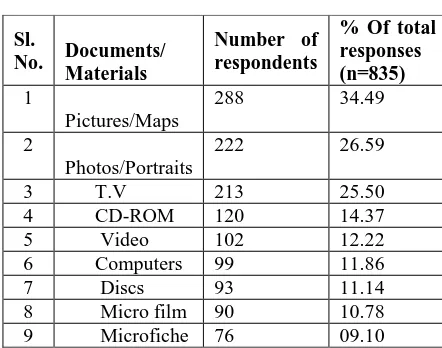
[image:7.612.358.579.250.424.2]Users enjoy using different forms of information sources and therefore, libraries need to possess information available in different forms. It is to know the opinion of users about the forms of documents other than books and other facilities that are available or not available and the desirability of having different forms of information sources in different public libraries, information is sought and the same is presented in table 10 the availability of non-book materials in city central libraries and branch libraries as opinion by users respondents.
Table 10
Availability of Non-Book Materials
Among different forms of the non-book materials, picture/maps and photos/portraits seems to be available in moderate number in some libraries. The number of users responded positively about the availability of these non-book materials accounts for 34.49% and 26.59% respectively. There are about 25.50% users who opinion positively about the availability of TV. Those users who express positively about the availability of CD-ROM, Video, Computers, Discs, Microfilm and Microfiche account 14.37%, 12.22%, 11.86%, 11.14%, 10.78% and 9.10% respectively.
User Opinion about users interests in using Popular Magazines and Newspapers in Public Libraries
The libraries are supposed to procure documents in accordance with the needs of users. Not only the libraries need to procure books but also procure popular magazines and newspapers to the users easily and timely for their use. To find out the users interests in using magazines and newspapers investigator obtained the opinion of user‟s interest in using in the libraries. The table 11 presents data relating to the opinion of users about their use of popular magazines and newspapers in respective public library that they use.
Sl.
No. Documents/
Materials
Number of respondents
% Of total responses (n=835)
1
Pictures/Maps
288 34.49 2
Photos/Portraits
Table 11
User Opinion about Use of Popular Magazines and Newspapers in Public Libraries
Sl.No Magazines
Number of respondents
% Of
total responses (n=835)
Sl.
No Newspapers
Number of
respondents
% Of total responses (n=835)
01 Taranga 558 66.82 01 Prajavani 680 81.43 02 Sudha 496 59.40 02 Vijayakarnataka 543 65.02 03 Vara
Patrike
312 37.36 03 Kannada Prabha 512 61.31
04 Lankesh Patrike
236 28.26 04 Samyakta Karnataka
497 59.52 05 Mangala 236 28.26 05 Indian express 436 52.21 06 The Week 228 27.30 06 Deccan Herald 397 47.54 07 India
Today
204 24.43 07 The times of India 383 45.86 08 Prapancha 196 23.47 08 The Hindu 367 4395 09 The Sport
Star
194 23.23 09 Udayavani 332 39.76 10 Filmfare 189 22.63 10 Andolana 313 37.48 11 Prajamatha
173 20.71 11 Star of Mysore 297 35.56
12 Mallige 173 20.71 12 Munjane 263 31.49 13 Deepavali
special
164 19.64 13 Sanjevani 211 25.26 14 Frontline 159 19.04 14 Others 184 22.03 15 Blitz 113 13.53
16 Kasturi 70 08.38 17 Sangathi 58 06.94 18 Others 42 05.02
The table 9 shows that Taranga is listed at the top in which more than 66.82% users are interested. This is followed by Sudha, Varapatrike, Lankesh Patrike and Mangala in which 59.40%, 39.37% 28.26%and 28.26% users are interest. There are 27.30% users who are interested in The Week and 24.43% users who are interested in India Today. Those users who are interested in reading Prapancha, Sport, Filmfare, Prajamatha and Mallige account for 23.47%, 23.23%, 22.63%, 20.71% and 20.71% respectively. While Deepavali Special is preferred by 19.64% users Frontline and Blitz are read by 19.04% and 13.53% users respectively. The magazines Kasturi, Sangathi and others is preferred by least number of users as they account for 08.38%, 6.94% and 5.02% users respectively.
The table also reveals that the Prajavani, Vijayakarnataka, kannada Prabha, Samyukta Karnataka, Indian express and Deccan Herald are used by majority of users. The number of users who responded positively about the use of these dailies account for 81.43%, 65.02%, 61.31%, 59.52%, 52.21% and 47.54% respectively. The other dailies such as The Times of India, The Hindu, and Udayavani are being used by 45.86%, 43.95%, and 39.76% respectively. The response of public regarding the availability of Andolana, Star of Mysore, Munjane, Sanjevani is poor, they account for 37.48%, 35.56%, 31.49% and 25.26% respectively.
Availability of Public’s Most Interested Books in Libraries
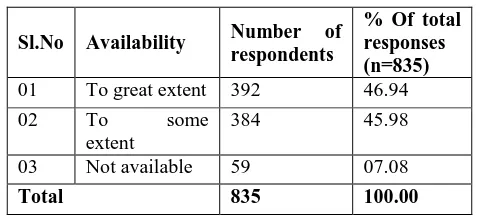
[image:8.612.325.565.538.646.2]The opinion of public about the availability of their interested books in the public libraries is sought and presented in table 12.
Tabel-12
Availability of Most interested titles of Books in libraries
Sl.No Availability Number of
respondents
% Of total responses (n=835)
01 To great extent 392 46.94 02 To some
extent
384 45.98 03 Not available 59 07.08
Total 835 100.00
Interest in Reading Latest Publications
[image:9.612.312.578.159.283.2] [image:9.612.35.303.170.256.2]Users normally will have the urge to read, see new books. It is to know the opinion of the users whether they are interested in reading latest publications, information has been sought and the same is presented in table 13.
Table 13
Users Interest in Reading Latest Publication
Sl.No Opinion about new
publications
Number of respondents
% Of total responses (n=835)
1 Have Interest 741 88.74 2 Do Not have
interest
94 11.26
Total 835 100.00
The Table exhibits that nearly 88.74% users are of the opinion that they are interested in reading latest publications. Only about 11.26% users seem to have no interest in reading latest books. Those users who expressed negatively are very small in number and therefore, it may be inferred that large majority of users are interested in reading latest publications.
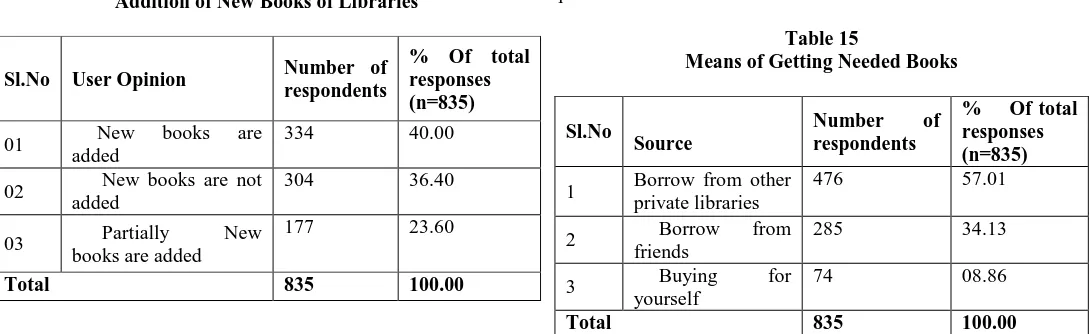
Addition of New Books to Libraries
Libraries need to have live collections and the collection be developed continuously. The library that does not add user new books from time, majority of user are interested in latest publications. If the public libraries add new and relevant publication continuously, do serve as real centers of libraries, add new users books to their collection from time to time, information is sought and the same is presented in table 14.
Table 14
Addition of New Books of Libraries
The Table exhibits that only about 40.00% users are of the opinion that the libraries do add to new users books to their collection. Against this almost equal number (36.40%) expressed negatively and nearly about 23.60% users expressed that the libraries add new books partially, that means some libraries do acquire and add publications but with reasonable gap of time.
Consideration of Requests of Users for Addition of Books to Library
The Figure 5 presents weather or not the suggestions made by users for the addition of books are considered.
Figure 5
Consideration of requests of users for addition of books to Library
It may be observed from the Figure that out 387 users who requested for addition of their books of interests to the libraries, 187 (48.32%) users that their requests have been considered by the libraries. Against this, 141 (36.43%) users state that their requests were considered by libraries in procuring required books. There are another 59 (15.25%) users who have expressed that their suggestions for procuring books were considered by their libraries partially.
Means of Getting Needed Books
[image:9.612.34.579.468.635.2]Other than the library, there are different sources that the users can obtain needed books for reading purposes. Information is therefore sought from users as to where from the users obtain needed books for reading purposes. The information so sought is presented in table 15.
Table 15
Means of Getting Needed Books
Sl.No
Source
Number of
respondents
% Of total responses (n=835)
1 Borrow from other private libraries
476 57.01
2 Borrow from friends
285 34.13
3 Buying for yourself
74 08.86
Total 835 100.00
The table shows that while 57.01% users borrow from private libraries, 34.13% users borrow from friends and 08.86% users buy books for themselves. Thus users not only depend upon the public library to meet their requirement of books but also get required books from private libraries, their friends and self purchase.
Sl.No User Opinion Number of
respondents
% Of total responses (n=835)
01 New books are added
334 40.00
02 New books are not added
304 36.40
03 Partially New books are added
177 23.60
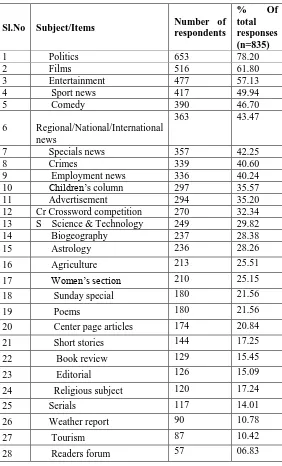
Subject/Items Published in Newspapers/Magazines that are of Great Interest to the Users
It is to know the subjects of great interest to the users in news papers and magazines, their opinion is sought and presented in table 16.
Table 16
Subjects/Items in Newspapers/Magazines that are of Great Interest to Users
Sl.No Subject/Items Number of
respondents
% Of total responses (n=835)
1 Politics 653 78.20 2 Films 516 61.80 3 Entertainment 477 57.13 4 Sport news 417 49.94 5 Comedy 390 46.70 6 Regional/National/International
news
363 43.47
7 Specials news 357 42.25 8 Crimes 339 40.60 9 Employment news 336 40.24 10 Children‟s column 297 35.57 11 Advertisement 294 35.20 12 Cr Crossword competition 270 32.34 13 S Science & Technology 249 29.82 14 Biogeography 237 28.38 15 Astrology 236 28.26 16 Agriculture 213 25.51 17 Women‟s section 210 25.15 18 Sunday special 180 21.56 19 Poems 180 21.56 20 Center page articles 174 20.84 21 Short stories 144 17.25 22 Book review 129 15.45 23 Editorial 126 15.09 24 Religious subject 120 17.24 25 Serials 117 14.01 26 Weather report 90 10.78 27 Tourism 87 10.42 28 Readers forum 57 06.83
The table 16 shows those who are greatly interested in politics are 78.2% as against 61.80% who are greatly interested in films. Those who are greatly interested in entertainment, sport news, comedy, regional/national/international news, specials news and crimes account for 57.13%, 49.94%, 46.70%, 43.47%, 42.25% and 40.60% respectively. There are 40.24% users who are interested in employment news. Those who are interested in children‟s column, advertisement, crossword competition,
science & technology, biography, astrology, agriculture and women‟s section account for 35.57%, 35.20%, 32.34%, 29.82%, 28.38%, 28.26%, 25.51% and 25.15% respectively. There are 21.56% users who are greatly interested in Sunday special and poems. Those who are interested in center page articles, short stories, book review, editorial, religious subject, serials and weather report account for 20.84%, 17.25%, 15.45%, 15.09%, 14.37%, 14.01% and 10.78% respectively. There are 10.42% and 06.83% interested in tourism and readers forum respectively.
Language-wise Preference of Reading Materials by Users
[image:10.612.21.303.169.635.2]Since the investigator covers users in cities/towns as well as taluk places spread over different regions of Karnataka State, he found it appropriate to know users with different language-wise preference of reading materials. The opinion of user is presented in figure 6.
Figure 6
Language-wise Preference of Books/reading Materials by Users
The figure shows that out of 835 users, 752 representing 90.06% prefer to read Kannada reading materials. There are 71.02% users who prefer documents published in English language. Those who prefer documents in Hindi language account for 13.53% respectively. There are about 12.22% users who prefer documents in other languages, such as Tamil, Telugu, Urdu and Others.
Easy identification or location of Books
It is to know weather the users can easily identify and locate the books of choice in the library. Their opinions have been sought and the same is presented in table 17.
Table 17
[image:10.612.319.567.292.458.2]The table 21 reveals that there are 49.94% users who identify books in the library easily, whereas 33.05% users could partially identity required books and 17.01% users could not identify required books easily.
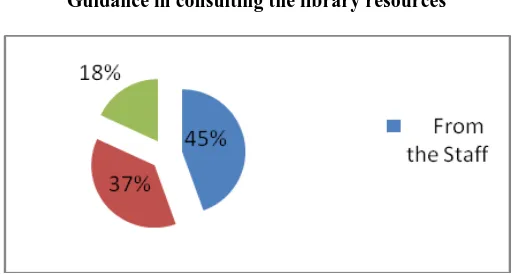
Guidance in Consulting the Library Resources
[image:11.612.31.299.59.208.2]More often, the staff within the library plays a major role in providing guidance to its users. It is to know the sources of help received by users from the librarians and library staff and others in searching the library resources, information was sought from the users‟ respondents and the same is presented in figure 7.
Figure 7
Guidance in consulting the library resources
The figure exhibits that the librarians and library staff are the major source of guidance to users within the library to located and use different sources of information over 44.55% users opine that they received guidance from the library staff. There are 37.37% users who opine that friends guided them in consulting books within the library. Users are normally accompanied by their parents/guardians while visiting library. About 18.08% of users express that their parents/guardians have been providing guidance and assistance to them in consulting resources in the libraries.
Organization of Reference Sources
[image:11.612.348.582.91.200.2]Opinion of users was sought about the organization of reference collection and services. The opinion sought are analyzed and presented in the table-18.
Table 18
Organization of reference sources and services
Sl.No Opinion Number of
Respondents
% Of total responses (n=835)
1 Organized well
592 70.90 2 Not
organized well
243 29.10
Total 835 100.00
The table 22 shows that there are 592 respondents representing 70.90% of the total 835 who have express positive opinion about the organization of reference collection. Whereas remaining 243 respondents representing 29.10% have replied negatively.
Orientation to Users
[image:11.612.39.298.373.510.2]Primary orientation about the library, its sources and services, rules and regulations, do‟s and don‟ts help user to make optimum use of library resources or service should be given to the users. Opinion of users is therefore sought to know weather librarians have provided orientation to the users in the beginning for locating the documents, searching information and knowing about the facts in the library. The opinion so sought it presented in table 19.
Table 19
Opinion of Users About Library Orientation
Sl. N o
Opinion Number of
respondents
% Of total responses (n=835)
1
Orientation is given
336 40.24
2
Orientation is Not given
499 57.76
Total 835 100.00
Out of 835 users, 336 users representing 40.24% of the total who have responded positively, against 499 (57.76%) users who have opined negatively about the orientation by the librarians for beginners.
Type of Special Programs that the Users are interested
As Public libraries conduct different special programs the responses about user‟s interest were collected in this regard. The responses are given in table-20.
Sl.No Opinion Number of
respondents
% Of total responses n=(835)
1
Books can be easily located
417 49.94
2
Partially books can be easily located
276 33.05
3
Books are not easily located
142 17.01
[image:11.612.320.570.420.549.2]Table 20
Interest in special programme by the respondents
Table shows that there are 472 respondents represent 56.53% are interested in debate, 431 (51.62%) are interested in book exhibition, 423 (50.66%) have interest in special lectures, 290 (34.73%) are interested of in talk exhibition about employment. 249 (29.82%) respondents show interest in art exhibitions, 208 (24.91%) respondent are interested in movies, 103 (12.34%) respondent are interested in photo exhibition.
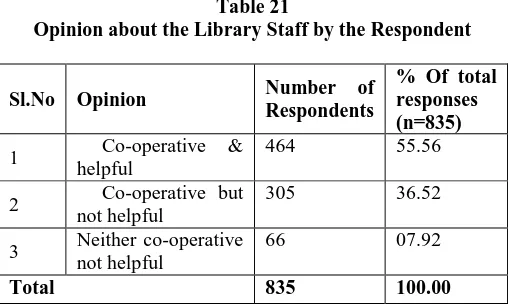
Opinion of users about Library Staff
The user is asked to give the opinion in general about library staff. The opinion given is represented in table 21.
Table 21
Opinion about the Library Staff by the Respondent
Sl.No Opinion Number of
Respondents
% Of total responses (n=835)
1 Co-operative & helpful
464 55.56
2 Co-operative but not helpful
305 36.52
3 Neither co-operative not helpful
66 07.92
Total 835 100.00
The Table shows that there are 464 respondents who opined (55.56%) that the library staffs are co-operative. And helpful 305 (36.52%) content that the co-operative but not
helpful, remaining 66 (07.92%) say they are neither co-operative not helpful.
III. CONCLUSION
Majority of users of CCL and its branch libraries in Mysore are within age group of 11-25 years and visit library daily. Majority of them are students, and unemployed youth. They spend two per day in the library. Since majority of the users are students and unemployed youth public libraries needs to enrich their information resource collection. Public libraries need to take proactive approach in motivating users to use their resources and service to enhance their competence.
REFERENCES [1] Handbook of the public, Mysore
Mysore: Mysore bysys Patrika Press, n.d. [2] Khan. H.A
“Karnataka Public Libraries Act: A criticasl review of its implementation,” In: Library Legislation in India, ed by Rout.R.K
Delhi: Reliance Publishing House, 1986; p168. [3] Nick Moore
Culture, Information and the Public Library, Rivlib File, 4 No1, 1983, p23-31.
[4] Patrica Willard and Viva Teece
Satisfying the Users: a look at a Local Public Library. Australian Librarian Journal, 32 No 1,1983, p 41-46.
[5] Tangen.L
Libraries as a life source the Immigrant Population‟s Use of the Trandheim Public Library System, Scandinavian-Public Library-Quarterly. V29 (4) 1996. p.26-28.
[6] Yilmaz,B
A sociological study of public library use in Ankara, Turkey. Journal-of-Librarianship-and-Information-Science.v 30 (4); Dec 1998; p.259-67.
AUTHORS
First Author – Chandrashekara J, Librarian, Vidya Vikas
Institute of Engg. And Technology, Mysore, Email: jpcshekar@gmail.com
Second Author – Dr. Adithya Kumari H, Assistant Professor
(S.G.), University of Mysore, Mysore, Email: adithyakumarih@gmail.com.
Third Author – Mohan B.S. Asst. Librarian, Indian Institute of
Astrophysics, Bangalore, mohan@iiap.res.in
Sl.No
Programs
Number of
Respondents
% Of total
responses (n=835)
1 Debate 472 56.53 2 Book exhibition 431 51.62 3 Special
Lectures
423 50.66 4 Talk-exhibition 290 34.73 5 Art Exhibitions 249 29.82 6 Movies 208 24.91 7 Photo
Exhibition
[image:12.612.41.296.387.541.2]