A Study of the Processes Involved in ECG Signal Analysis
A.Muthuchudar
*, Lt.Dr.S.Santosh Baboo
** *Department of Computer Applications, Kongunadu Arts and Science College, Coimbatore – 641029, Tamilnadu, India **
PG & Research Dept. of Computer Applications, D.G. Vaishnav College, Chennai -600106, Tamilnadu, India
Abstract- ECG Signal Analysis involves various processes and
techniques which in the recent years , have yielded better results in terms of accuracy in the diagnosis of heart diseases. This paper deals with some of the recent developments in the processes such as denoising, data compression, feature extraction and classification of the ECG signals. These processes are discussed each with suitable examples.
Index Terms- Artificial Neural Networks, Wavelet Transform,
Arrhythmia
I. INTRODUCTION
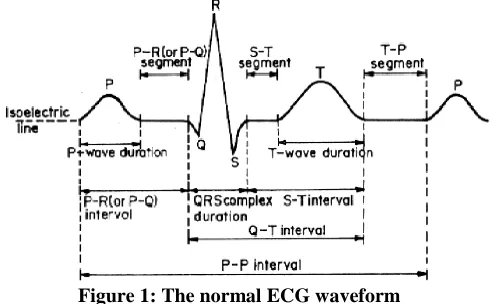
[image:1.612.325.570.165.317.2]here is a need for tackling large number of patients with various kinds of heart diseases. Medical science in collusion with Computer Science has, during the recent years, evolved methods that could be used for expert diagnosis by the cardiologists. Electrocardiogram (ECG) is an invaluable tool for diagnosis of heart diseases. The normal ECG waveform with its various segments is shown in Figure.1. With the help of ECG, the electrical activity within the heart can be easily detected from the outside of the body. When the ECG is abnormal it is called Arrhythmia. The patterns of the waveform change due to abnormalities of the heart. The methods used for diagnosis generally involve four essential processes to arrive at the accurate and quick decisions about the kind of heart disease a patient suffers from. They are: 1. Data Compression 2. Denoising 3. Feature Extraction and 4. Classification. In this paper each process is explained with examples from the recent researches using Artificial Neural Network. An Artificial Neural Network, often just called a neural network, is a mathematical model inspired by biological neural networks. A neural network consists of an interconnected group of artificial neurons, and it processes information using a connectionist approach to computation. In most cases a neural network is an adaptive system that changes its structure during a learning phase. Neural networks are used to model complex relationships between inputs and outputs or to find patterns in data[12].
Figure 1: The normal ECG waveform
II. DATACOMPRESSION
Quite a large volume of ECG data produced by monitoring systems over a period of time, need to be compressed for efficient storage. ECG signals are collected both over long periods of time and at high resolution. This creates substantial volumes of data for storage and transmission. Data compression seeks to reduce the number of bits of information required to store or transmit digitized ECG signal without significant loss of signal quality.
In a project taken up by Dr. Anubhuti Kare et al[9], they have developed and implemented a low complexity „lossy‟ ECG Encoding Algorithm capable of at least a 2 : 1 compression rate. There are two types of Compression techniques „lossless‟ and „lossy‟. Since lossy compression technique gives a better compression rate, this technique has been used. A Coder- Decoder, based on a new emerging Transformation technique called Wavelet Transform coding, has been chosen so as to achieve the compression ratio 2 :1 .
Wavelet Transforms: A number of alternative time – frequency methods are now available for signal analysis. Of these, the wavelet transform has emerged over recent years asa the most favored tool by researchers for analyzing problematic signals across a wide variety of areas in Science, Engineering and Medicine.
It is found that the compression technique using Discrete Wavelet Transform (DWT) is more effective compared to the Discrete Cosine Transform (DCT). The algorithm that has been implemented using Wavelet Transform technique seems to be the best choice for ECG data compression.(Table 1)
Table 1
DCT Compression DWT Compression
CR = 90% CR = 95%
PRD about 1% PRD less than 1% Algorithm Execution Time
about 7 sec
Algorithm Execution Time about 3 sec
III. DENOISING
[image:2.612.53.283.264.379.2]One of the main problems in biomedical data processing like electrocardiography is the separation of the wanted signal from noises caused by power line interference, external electromagnetic fields, random body movements and respiration. ECG filtering is done so that the desired information is not distorted by interferences or altered in any way.
Figure 2: Removing wideband noises from an ECG signal by applying the UWT
For the purpose of filtering ECG, Manpreet [8] uses a combination of Moving Average Method and IIR Notch filter. A moving average filter smoothes data by replacing each data point with the average of neighboring data points. This removes the baseline drift of original ECG signal and thus the power spectral density is removed. The IIR Notch filter is applied to this smoothed signal.
Chinmay Chandrasekar et al [3] have used Adaptive Power line Interference Canceller which is an improved adaptive canceller for the reduction of the fundamental power line interference component and harmonics in ECG recordings. They used RLS (Recursive Least Squares) algorithm which is a special version of the adaptive filter which has less computational complexity and good filtering capacity.
The Figure.3 shows a sample signal before and after noise removal.
Figure 3: ECG signals before and after UWT de-noising
IV. FEATUREEXTRACTION
An expert Cardiologist will not be able to monitor a large number of cardiac patients efficiently and so computer aided feature extraction and analysis of ECG signal for disease diagnosis has become necessary. The input data will be transformed into a reduced representation set of features (also named features vector). Transforming the input data into the set of features is called feature extraction. If the features extracted are carefully chosen it is expected that the features set will extract the relevant information from the input data in order to perform the desired task using this reduced representation.
Figure 4.Steps in Feature Extraction
The flowchart in Figure.4 indicates the steps involved in Feature Extraction. For the purpose of diagnosis, we need to extract various features from the preprocessed ECG data, including QRS intervals, QRS amplitude, PR intervals, ST intervals etc., In this kind of analysis, identification and extraction is the first step. The most prominent feature here is QRS complex and the accurate detection of QRS complex forms the basis for the extraction of other features.
[image:2.612.322.560.414.555.2]has given accuracy of detection and simplicity in calculations without any need for preprocessing.
Saxena et al [9] developed a combined Wavelet transform Technique to analyze multilead ECG signals for cardiac disease diagnosis. Here two wavelets have been used: One is the Quadratic Spline Wavelet (QSWT) for QRS detection and the other Daubechies Six Coefficient (Db -6) wavelet for P and T detection.
Shahanaz Ayub et al [5] in their extraction of fusion beats of ECG, aim at making the analysis of fusion beats easy so that the patient could be diagnosed for the heart problems in less time and with more accuracy using Artificial Neural Networks. The identification of fusion beats is done using MATLAB based Feed Forward Neural Network. For training and validation of the neural network, the standard MIT – BIH arrhythmia database is used.
The Feed Forward network based on back propagation algorithm with training algorithm, was the best for the analysis of fusion beats because it gives an accuracy of about 96%.
V. CLASSIFICATION
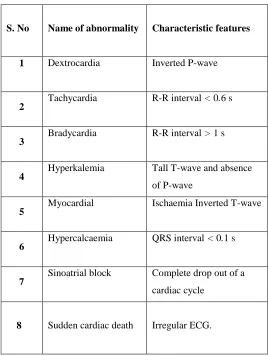
[image:3.612.314.582.63.419.2]Classification with regard to ECG refers to categorizing the various features of waves extracted from ECG according to the specific heart disease each feature represents, and this classification is done with the help of Artificial Neural Networks. Classification is done generally according to the Table 2 given below. Various characteristic features of the patterns of ECG wave are listed and the corresponding disease to each pattern is also given.
Table 2: Various abnormalities and their characteristic features
An ECG contains important pointers to the nature of diseases afflicting the heart. Acharya et al classified cardiac abnormalities into 8 classes. Three parameters were extracted from the heart rate signals and used for this classification.
Acharya et al [6] have used HRV signal as a reliable indicator of heart disease. They used neural network classifier and the fuzzy classifier as diagnostic tools to aid the physician in the analysis of heart diseases. These tools yield results with 80 – 85% accuracy and not 100%.
Table 3 :
Diseases classified by ANN
No.of dataset
used for
training
No.of dataset used for testing
Percentage of correct classification (10,000 iterations) Left Bundle
Branch Block(LBBB)
28 14 85.7
Normal Sinus Rhythm(NSR)
60 30 90
Pre Ventricular Contraction(PVC)
45 25 88
Atrial 30 25 85
S. No Name of abnormality Characteristic features
1 Dextrocardia Inverted P-wave
2 Tachycardia R-R interval < 0.6 s
3
Bradycardia R-R interval > 1 s
4 Hyperkalemia Tall T-wave and absence of P-wave
5
Myocardial Ischaemia Inverted T-wave
6 Hypercalcaemia QRS interval < 0.1 s
7
Sinoatrial block Complete drop out of a
cardiac cycle
[image:3.612.307.583.577.730.2]
Fibrilation(AF) Ventricular Fibrilation (VF)
28 21 81
Complete Heart Block (CBF)
28 21 81
Ischaemic / Dilated Cardiomyopathy
30 18 83.3
Sick Sinus Syndrome (SSS)
30 18 88.9
Surendra Dalu et al [10] have done classification of QRS and ST segment using Long Vector Quantization (LVQ) neural network. As a new approach LVQ which belongs to the class of competitive long networks, was developed particularly for classification problems.
QRS complex:
[image:4.612.67.271.324.441.2]QRS complex is the electrical wave that signals the depolarization of myocardial cells of the ventricles. The duration of the normal QRS is not greater than 3 mm or 0.06 to 0.12 seconds. If this duration is more than 3 mm it is to be suspected as an abnormal intra ventricular conduction velocity.
Figure 5: Lead Electrocardiogram showing ST segment elevation (orange) in I a VL and v1 –v5 with reciprocal changes
(blue) in the inferior leads, indicative of an anterior wall myocardial infarction.
VI. CONCLUSIONANDFUTUREWORK
The discussion so far made shows that new techniques are being evolved by researchers in each process involved in signal analysis so that more accuracy is achieved and treatment is given before it is too late. There is scope for future research in each process leading to 100% accuracy.
REFERENCES
[1] Thaweesak Yinglhawornsuk: “Classification of Cardiac Arrhythmia via SVM”, International Conference on Biomedical Engineering and Technology IPCBEE. Vol. 34 2012, IACSIT Press, Singapore.
[2] Rajiv Rajan, V.K Giri: “A Unified Approach of ECG Signal Analysis”, International Journal of Soft Computing Engineering (IJSCE)ISSN : 2231 – 2307, Vol. 2, Issue -3, July 2012.
[3] Chinmay Chandrakar, M K Kowar: Denoising ECG Signals Using Adaptive Filter Algorithm, International Journal of
Soft Computing Engineering (IJSCE)ISSN : 2231 – 2307, Vol. 2, Issue -1, March 2012.
[4] M K Islam, AANMM Haque, G.Tangim, T.Ahamad and MRH Khondoker: “Study and Analysis of ECG Signal Using MATLAB and LABVIEW as Effective Tools”, International Journal of Computer and Electrical Engineering Vol.4 ,No.3, June 2012.
[5] Shahnaz Ayub, J.P.Saini: “Fusion Beats Extraction from ECG Using Neural Networks based Soft Computing Techniques”, Advances in Applied Science Research, 2010, I(2) 76 – 83.
[6] R. Acharya U , A. Kumar , P.S. Bhat , C . M . Lim , S. S. Iyengar , N. Kannathal, S . M . Krishnan: “Classification of Cardiac Abnormalities using Heart Rate Signals”, Medical and Biological Engineering and Computing(2004), Vol.42, PP 288 – 293.
[7] Alexandros Pantelopoulos and Nicollaos Bourbakis, “ECG Beat Classification using Optimal Projections in Overcomplete Dictionaries”, 23rd IEEE International
Conference on Tools with Artificial Intelligence,2011.
[8] Manpreet Kaur, Birmohan Singh: “Powerline Interference Reduction in ECG Using Cobination of MA method and IIR Notch”, International Journal of Recent Trends in Engineering, Vol.2 No.6, Nov 2009.
[9] Anubhuti Khare, Manish Saxena, Vijay B Nerker :” ECG Data Compression using DWT”, Internatioanl Journal of Engineering and Advanced Technology (IJEAT) ISSN : 2249 – 8958, Vol. 1, Issue -1, Oct 2011.
[10] Surendra Dalu, Nilesh Pawar: “Detection and Classifictaion of QRS and ST segment using WNN”, International Journal of Computer Science and Network (IJCSN) , Vol. 1, Issue – 3, June 2012, www.ijcsn.org, ISSN 2277 – 5420.
[11] Miss Hong Liang: “ECG Feature Elements Identification for Cardiologist Expert Diagnosis”, Proceedings of the 2005 IEEE Engineering in Medicine and Biology 27th Annual Conference, Sanghai, China Sept 1-4 2005.
[12] Wikipedia
AUTHORS
First Author – A. Muthuchudar has a BSc in Physics, MCA, and
M.Phil from Bharathiar University. She is pursuing her PhD at the School of Computer Science and Engineering of Bharathiar University. She has been a faculty at the Kongunadu Arts and Science College, Coimbatore for about 4 years and has a total teaching experience of 7 years. She has presented 2 papers in National level seminars. Her areas of interest are Data Mining, Artificial Intelligence and Medical Applications of Computer Science.
Second Author – Lt. Dr.S.Santhosh Baboo has around twenty
years of postgraduate teaching experience in Computer Science, which includes Six years of administrative experience. He is a member, board of studies, in several autonomous colleges, and designs the curriculum of undergraduate and postgraduate programmes. He is a consultant for starting new courses, setting up computer labs, and recruiting lecturers for many colleges. Equipped with a Masters degree in Computer Science and a Doctorate in Computer Science, he is a visiting faculty to IT companies. It is customary to see him at several
the post graduate students to get real time projects. He has also guided many such live projects. Lt.Dr. Santhosh Baboo has authored a commendable number of research papers in international/national Conference/journals and also guides research scholars in Computer Science. Currently he is Associate Professor in the Postgraduate and Research department of Computer Science at Dwaraka Doss Goverdhan Doss Vaishnav
College (accredited at „A‟ grade by NAAC), one of the premier institutions in Chennai.
Correspondence Author – A. Muthuchudar ,