[Type text]
OCT-NOV, 2012, Vol. – I, Issue-III www.srjis.com Page 722
FEA based validation of Weld joints to determine effect of overlap length of weld strength
Rahul Khot,
Department of Mechanical Engg,
Rajarambapu Institute of technology, Sakharale, India.
Gawade S.S.
Department of Mechanical Engg,
Rajarambapu Institute of Technology, Sakharale, India. Vinnay Patil
(FEA (Finite Element Analysis Department, Vaftsy CAE Pune India.)
Received: 30 Nov 2012 Accepted: 30 Dec 2012
Weld joints form an important part of pressure vessels, ships buildings, pressure vessels, water reactors, concrete slab plates, boilers are highly essential for structural integrity of
the system. Typical welds are done on flat surfaces and their strengths are well catalogue for
reference. The standard data related to the no. of welds, thickness of plate, size of
overlapping length for flat plate is available. But such a type of standard data is not
available in the market for curved plate. So the objective of this paper is to analyze welds on
curved plated and determine their strength, and create a similar catalogue for curved
surfaces.
KEYWORDS:CURVED PLATE,FINITE ELEMENT ANALYSIS,WELDED JOINT
Abstract
OCT-NOV, 2012, Vol. – I, Issue-III www.srjis.com Page 723 INTRODUCTION
In current industrial practice, welds and welded joints are an integral part of many complex load- carrying structures. Unfortunately, welds are often the weakest portions of these structures and their quality directly affects the integrity of the structure. Failure strength is believed to have a close relation to the precise geometrical discontinuity of the welded
joint. The ultimate goal to produce welds of suitable strength and at a reasonable cost.
Generally two types of plates are used in fabrications i.e. flat plate and Curved plate. There are various applications of flat plates like manufacturing of different automobile components, standard machine parts, leaf spring, Steel pipe flange etc. So producing such type of component, standard table or data (catalogue) available for selection of weld for different strength of flat plate. Also lot of work is done related to the flat plate. But there are limitations for producing complicated components by using flat plates.
As ships buildings, pressure vessels, water reactors, concrete slab plates, boilers are fabricated from curved plates. To assemble such parts welding are commonly used. However it is impossible to avoid the deformation produced by welding. Therefore they are highly essential for structural integrity of the system. Since it is influenced by various factors like angle of weld, material of weld, thickness of weld, thickness of weld plate, radius of the weld material etc. A very few research papers of curved plates are available. But standard data of curved plate with respect to above parameters are not available. A better approach to the prediction of welding deformation is using the combined technologies of experiments with calculation. With modern computing facilities, the Finite Element (FE) technique has become an effective method for prediction and assessment of welding residual stress and distortions
various factors, the quantitative prediction and the control of welding deformation especially for a large and complex welded structure is extremely difficult.
BRIEF REVIEW OF SOME RESEARCHERS
As there are lot of work is done in weld of flat plate, very little work is done in relevant field of a welded joint of a curved plate. A brief review of some selected references on the strength of curved plate, distortions of plate, strength of welded joint.
OCT-NOV, 2012, Vol. – I, Issue-III www.srjis.com Page 724 failure in dissimilar weld joint. Residual stress profiles across these weld joints were
determined by X –ray diffraction technique. The failures are generally attributed to one or more of the following causes 1.Difference in mechanical properties across the weld joint and coefficient of thermal expansion of two materials. 2. Residual stresses present in the weld joint. 3. Service condition and others. A successful weld between dissimilar metal is one that
is as strong as the weaker of the two metal being joined with sufficient tensile strength so that joint will not fail.
Chien-Yuan Hou has suggested that Fatigue analysis of welded joints usually assumes weld toes of ‗mathematically perfect‘ geometry for the required weld toe stress state.
However, the weld toe geometry certainly cannot be defined by simple mathematical functions. In that, the three-dimensional laser scanning technology used to preserve the real geometry of welded specimens. Finite element models of the specimens were then constructed with the scanned results. Linear elastic finite element analyses were then carried out to estimate the stress concentration factors along the weld direction of each specimen
Deng et al. have predicted that welding distortions of large welded structure by using elastic Finite Element Analysis (FEA).Regardless of the types of the structures, the correction or straightening of the deformation, which required special skill and large cost, is an essential part in the assembly process. From the theoretical view point, thermal elastic plastic Finite Element Analysis the most general method to predict the welding residual stress and distortions. Based on the thermal elastic plastic analysis and experimental observations pointed out that a source resulting in welding deformation and residual stress must exist in the weld joint.
OCT-NOV, 2012, Vol. – I, Issue-III www.srjis.com Page 725 and thickness of the specimen.
M. Xiea, J.C. Chapman have suggested that Friction-welded bar–plate connections are a basic structural component of Steel steel–concrete–steel sandwich construction. In Bi-Steel members, the bar–plate connections, embedded in concrete, are subject to tension, shear and bending. They describes experimental and numerical studies on the static and fatigue
strength of the friction-welded connections with the bar loaded in tension. Finite element analysis is carried out to examine the effects of plate thickness, the collar (―flash‖) formed
after friction welding, and possible initial defects or fatigue induced cracks. It is found that except for 6 mm plate specimens, the static tensile capacity of the embedded connections is governed by the tensile strength of the bar connectors. In the fatigue tests, single fracture and double fracture mechanisms were observed.
Some of the researchers address about the welding distortion considering residual stresses for a flat plate. Also, the mathematical behaviour of welded specimen is considered as a multisport welded structure is eventually determined by the strength of each single spot weld. Also existence of crack like imperfection in the welded joint is normally considered to eliminate and so called crack initialization stage of fatigue life. As such no certain guidelines or set of formulation is available for curved plate lap joint regarding overlap.
ANALYTICAL METHOD TO DETERMINE NON LINEAR STRENGTH
Consider a diametral section through a plate of thickness t. O is the centre of a plate and OX and OY are the principal axes in the plane of the diagram. The axis OZ is perpendicular to the screen.
Let C be the centre of curvature of section ‗ab‘ at a distance χ from O. then if the deflection y
is small:
(1)
The radius of curvature in the plane XOY is given by approximately
Thus equitation 1 becomes,
(2)
OCT-NOV, 2012, Vol. – I, Issue-III www.srjis.com Page 726 (Approximately)
If u is a distance of any fibre from neutral axis (which is assumed to be centre) then proceeding as for in the plane of YOZ and XOY the linear strains are
And
Where ƒx and ƒz are the stresses in the directions OX and OZ and ƒy is zero
DIFFERENT TYPES OF NON LINEAR BEHAVIOR
Although the process of changing stiffness is common to all types of nonlinear analyses, the origin of nonlinear behavior can be different, making it logical to classify nonlinear analyses based on the principal origin of nonlinearity. Because it isn‘t possible to point out a
single cause of nonlinear behavior in many problems, some analyses may have to account for more than one type of nonlinearity.
4.1 Nonlinear geometry
As already discussed, nonlinear analysis becomes necessary when the stiffness of the part changes under its operating conditions. If changes in stiffness come only from changes in shape, nonlinear behavior is defined as geometric nonlinearity. Such shape-caused changes in stiffness can happen when a part has large deformations that are visible to the naked eye. A
generally accepted rule of thumb suggests conducting a nonlinear geometry analysis if the deformations are larger than 1/20th of the part‘s largest dimension. Another important factor to recognize is that in cases of large deformations, the load direction can change as the model deforms. Most FEA programs offer two choices to account for this direction change: following and non following load
4.2 Nonlinear material
OCT-NOV, 2012, Vol. – I, Issue-III www.srjis.com Page 727 the load. It also assumes that no permanent deformations will result, and that once the load
has been removed the model will always return to its original shape.
Changes in stiffness due to shape can also occur when the deformations are small. A typical example is an initially flat membrane deflecting under pressure. Initially, the membrane resists the pressure load only with bending stiffness. After the pressure load has
caused some curvature, the deformed membrane exhibits stiffness additional to the original bending stiffness.
4.3 Understanding Loss of elastic stability (buckling)
Stiffness in a part also changes due to applied loads. Sometimes, loads—depending on how they are applied can either increase the stiffness (tension loads) or decrease it (compressive loads). For example, a tight rope can take an acrobat‘s weight. A loose one, however, will make him fall. In cases of compressive load, if the changes in stiffness are sufficient to cause the structure‘s stiffness to drop to zero, buckling occurs and the structure
experiences a rapid deformation. It then either falls apart or acquires a new stiffness in its post buckling state.
Linear buckling analysis can be used to calculate the load under which a structure will buckle (Euler load). However, the results of linear buckling analysis are not conservative. In addition, idealizations in the FEA model may result in the predicted buckling load being much higher for the FEA model than for the real part. Thus the results of linear buckling analysis should be used carefully. Buckling does not necessarily equal catastrophic failure and the structure may still be able to support the load after buckling has taken place. Nonlinear analysis will explain post buckling behaviour.
THE FEM MODEL AND PROCEDURE
OCT-NOV, 2012, Vol. – I, Issue-III www.srjis.com Page 728 required. For analysis such a welded flat plates, we extracted and meshed the mid-surface
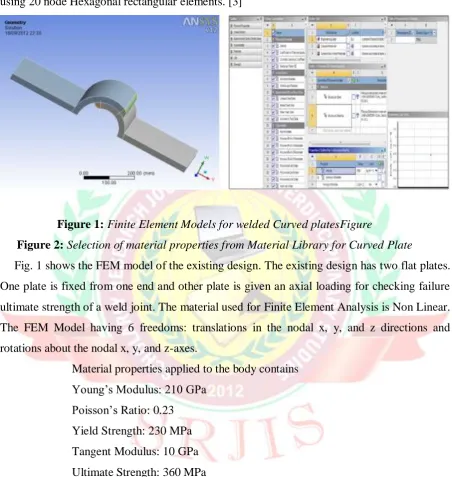
[image:7.595.72.525.104.582.2]using 20 node Hexagonal rectangular elements. [3]
Figure 1: Finite Element Models for welded Curved platesFigure Figure 2: Selection of material properties from Material Library for Curved Plate
Fig. 1 shows the FEM model of the existing design. The existing design has two flat plates. One plate is fixed from one end and other plate is given an axial loading for checking failure
ultimate strength of a weld joint. The material used for Finite Element Analysis is Non Linear. The FEM Model having 6 freedoms: translations in the nodal x, y, and z directions and rotations about the nodal x, y, and z-axes.
Material properties applied to the body contains Young‘s Modulus: 210 GPa
Poisson‘s Ratio: 0.23
Yield Strength: 230 MPa Tangent Modulus: 10 GPa Ultimate Strength: 360 MPa
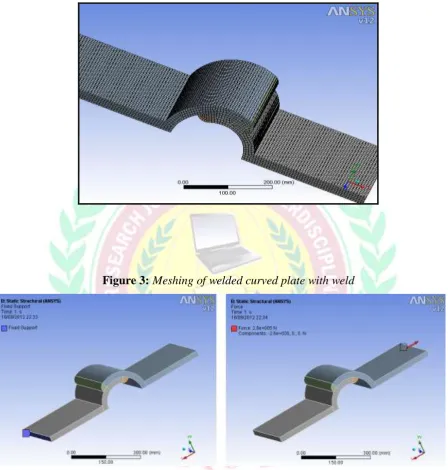
OCT-NOV, 2012, Vol. – I, Issue-III www.srjis.com Page 729 Figure 3: Meshing of welded curved plate with weld
Figure 4: Application of boundry condition as Fixed Support on one plate
OCT-NOV, 2012, Vol. – I, Issue-III www.srjis.com Page 730 Figure 6: Equivalent(Von-Mises)stresses in the Welded Curved Plate Figure 7: Total
Deformationoccured in the Welded Curved Plate
RESULT AND CONCLUSION
In Welded curved plate FEA analysis is done and company provides the experimental results. The dimension of Welded Curved Plate is Non curved length of plate is 300 mm, Innermost Radius is 75 mm and Overlap angle is varying between 30 to 90 degree., Thickness of plate is 50 mm and width of plate is 200 mm. The experimental and FEA results of both side Welded Curved Plate is tabulated as follows.
Figure 9: Graph of Overlapping Angle Vs Maximum Force
S r. N o
Angle of Overl
ap
FEA Results Experimental Results
% Difference of Load Failu
re Load
Defor matio n (δ)
Failure Load Deformation (δ)
1 30 225 10.11
2 219 11.3 2.67
2 60 289. 6
7.524
7 281 8.7 2.97
3 90 466 5.803
[image:9.595.213.383.590.691.2]OCT-NOV, 2012, Vol. – I, Issue-III www.srjis.com Page 731
Curve Fitting for Effective Failure Force of welded curved plate
In this article the curve fitting technique is utilized to find the relation between angles of overlap with the failure strength of Welded curved plate. The angle of overlap is defined as the common angle prescribed by the two plates over each other. Total six data points (three for each of the perforated welded plate) are adopted from the failure force to determine the curve fitting functions. It should be pointed out that when the overlap angle approaches to zero i.e. both plates are weld in front of each other like Butt weld no appropriate curve fitting function can found between the failure strength (force) and angle of overlap of Welded Curved Plate. In fact distribution of failure force is quite linear. In particular when overlap angle approaches 1 the slope of fitting curve become normal and found appropriately to process the curve fitting and obtained function. This function can be used to predict the trend of failure strength of a welded curved plate in a diagonal array. The function is expressed in mathematical form are as
Y = aX2 + bX +c Where,
X = Overlap angle of a welded Curved plate in Degree.
Y = Failure strength of Welded joint of Curved plate in KN
a, b, c = Coefficient of this function listed in the table. TABLE: 6.7
Coefficient of Curve fitting functions
Discussion on results obtained by theoretical experimental analysis is carried out here to reach the conclusion.
The average value of maximum displacement for welded curved plate is decrease as
the overlap angle increases simultaneously the failure load is increase.
Coefficients A B C
Single side
weld 0.0266 -1.328 226.5
Both side
OCT-NOV, 2012, Vol. – I, Issue-III www.srjis.com Page 732
Difference between failure load of welded curved plate in experimental result and
analytical results are near about 2.6 to 5.3 %
Similarly the deformation occurred in welded curved plate is less than 2% of the test
length of the specimen.
The load carrying capacity of single side weld is more than that of the both side weld before 50˚ overlap angle considering economical aspects. So when overlap angle is more than 50˚ always consider the both side weld for getting maximum strength and if
it is less then prefer the single side weld. ACKNOWLEDGEMENT
The authors would like to thank to the Vaftsy CAE Pune, India. for supplying the experimental results in this study.
REFERENCES
Dean Deng, Hidekazu Murakawa, Wei Liang ―Prediction of Welding distortion in a curved
plate structure by means of elastic finite element method‖ Published in journal of Material Processing Technology 203(2008) page no. 252-266
Hyungyil Lee, Nahmho Kim, Tae Soo Lee Crack trajectory near a weld: Modeling and simulation published in Engineering Fracture Mechanics 72(2005) page no. 1203-1221 A Joseph, Sanjai K. Rai, T Jaikumar ―Evaluation of residual stresses in dissimilar weld joint‖ published in International Journal of Pressure Vessels‘ and piping 82 (2005) page No.
700-705
Donald w. White and Se-Kwon Jung ―Shear strength of horizontally curved steel I-girders finite element analysis studies‖ Journal of constructional steel research 62 (2006) Page
no. 329-342
Chien-Yuan Hou ―Fatigue analysis of welded joints with the aid of real three-dimensional weld toe geometry‖ published in International Journal of Fatigue 29(2007) Page no.
772-785
M.M. Rashid, V. Tvergaard ―Crack trajectory near a weld: Modeling and simulation‖
published in engg. Fracture 75(2008) 560-570.
V.B. Bhandari ―Design of Machine Element‖, Published by Tata McGraw Hill Publishing
OCT-NOV, 2012, Vol. – I, Issue-III www.srjis.com Page 733 Joseph Edward Shigley ―Mechanical Engineering Design‖, First Metric Edition by McGraw
Hill Company New Delhi.
M. Xie,∗, J.C. Chapman ―Static and fatigue tensile strength of friction-welded bar–plate connections embedded in concrete‖ published in Journal of Constructional Steel