THE AVAILABILITY OF CEMENT TOWARDS
INFASTRUCTURAL DEVELOPMENT IN BANTEN:
A DYNAMIC SYSTEM MODEL ANALYSIS
Rahman Abdullah, Andi Maddepungeng, and Rahmi Wahyuni
Department of Civil Engineering
University of Sultan AgengTirtayasa, Cilegon, Banten
Abstract-Infrastructures are no doubt important to speed economic development in the province of Banten. Due to this reason the government of Banten gives a serious concern toward infrastructural development in this province. However, studies estimating the availability of cement to support the infrastructural development in Banten have been limited. This study, by using a dynamic system simulations, aims at estimating the availability of cement for the infrastructural construction in the future. The data were collected from the official statistics and other secondary sources. The study found that the demand for cements will exceed the supply of cement between the period 2018 and 2025. This study suggests the following actions that need to be given serious attention by the provincial government of Banten. First, there is a need to increase the number of cement industries in the province of Banten. Second, the provincial government should introduce conducive policies to attract investors to invest in cement industries to support the sustainability of cement production. Third, the development of cement industries should be environmentally friendly. Fourth, there is a need to develop a large capacity of cement production. Finally, the government needs to monitor the availability of cements to mitigate the gap between the supply and demand of cements in this region.
Index terms- the supply and demand of cements, Dynamic Systems model, infrastructural development, conducive policies.
1. INTRODUCTION
Infrastructure can simply be defined as the physical systems that provide transportation, water, buildings, and other public facilities required to meet human basic needs both economically and socially. In the province of Banten, like in many other provinces in Indonesia, the development of infrastructure is no doubt important as the engine of economic growth. This is because the availability of infrastructures is able to increase productivity, cost efficiency and attracting investments (Szirmai, 2010). For this reason, the development of infrastructure is a must for any regions to have rapid economic growth.
In the province of Banten, however, the availability of infrastructure was limited. The provincial government of Banten consequently since 2010 established regional plan to speed the development of infrastructures. This provincial development plan has attracted the growing of construction companies. Between the period 2013 and 2014, the number of construction companies increased from 2,413 units to 2,440 units with the construction value reached 11.8 trillion rupiah. The number of the construction companies was reported increasing since these periods. Judging from the type of work, nearly 60 percent of the construction value was for civil buildings such as roads and bridges. The rest is just only buildings (17.9 %) and other special construction (19.3 %) respectively (Banten Provincial Statistics, 2015).
Apart from the above building types, the development of housing and the like are also rapid in this province. This is not surprising as the population of this province grow quiet rapidly. The rapid development of infrastructures certainly have a linear positive relationship with the need of cement supply as one of the important building materials. However, as there have been limited studies in estimating the supply of cement to support the infrastructural development in this province, this study is considered important to be undertaken.
dynamic systems model and the source of data will be detailed. Section 4, then, discussed the finding of the study. Finally, section 5 will address concluding remarks and recommendation of the study.
II. LITERATURE REVIEW
As has been mentioned at the outset that the study to estimate the future supply of cement for construction industries in the province of Banten was limited. The available studies relevant to this present study is as follows. The first study is the study undertaken by Rahayu Utami (2006) titled Dynamic System Simulation toward the availability of cassava in Bogor, West Java. The second is the study conducted by Erma Suryani (2005) on the Policy Planning scenario towards the capacity of the cement industry using Dynamic system model. The third is the study done by Safitri Ambarsari, et.al. (2015) on the Analysis of Work Core Process of Supply Chain using Lean Six Supply Chain Management in Semen Indonesia company (Persero) Tbk). The fourth study is the study on the Supply Simulation of Maize using the Dynamic Systems Approach in Chareon Pokhpand company in Indonesia. This study was conducted by Alkafi Abdillah (2014). The other relevant study that needs to be informed is the study conducted by EkoWidodo, et.al. (2013). This study was focused on the Dynamic Systems Simulation to Improve supply Performance of the company in Indonesia. The mentioned studies confirmed that there were no available studies on the Dynamic Systems Simulation of the Supply of Cement in the province of Banten.
III. RESEARCH METHODS
Dynamic System Model
As discussed previously that cement is one of the raw materials that need to be provided adequately toward the development of infrastructures. However, the supply availability of cement in many regions in Indonesia was considered limited. The reason is simply because efforts to supply cement in the region deal with many complex factors or variables. To solve this problem, a dynamic system model was suggested in the literature. This model is considered able to deal with the complexity of the variables associated with the supply of cement.
The used of system approach begins with problems identification, and followed by the needs analysis and ends by the effective operating system. The system approach has several elements including their methodologies for planning and management which have be multidisciplinary and systematic approaches. This approach should also be able to think in non-quantitative, by using mathematical modelling, simulation and optimization technique. This approach can also be applied using computer (Eriyatno, 1998).
There are at least three stages that need to be done using the system approach. The first is the stage of needs analysis. This includes the department of Public Works, Regional Development Planning organization (Bappeda), and other stake holders including the cement industries and consumers . Having completing this need analysis, the second stage will be problems formulation. In this stage there will be problems formulation towards the development of the cement industry Supply Chain system. However, in this stage there are usually many problems associated with the Supply Chain system of cement. These problems include the problem of the transport system from the distributor to the consumer, and the fluctuations of the price of cement in the industrial market. These problems will affect the cement industry to run the business.
After completing the problems formulation, there is a need to identifying the system itself. In this stage, the analysis needs to focus a chain of relationships between the statement of needs and a special statement of the problem that need to be solved to meet these needs. In this part the analysis needs to consider the interests of the components involved and the linkage components in the system using casual loops (Muhamadi, et.al., 2001).
This is then followed by the phase of model formulation. In this phase the true meaning of every relationship that exists in the conceptual model is formulated. This dynamic system will use mathematical equations (differential equations) to describe a system into the model. At this stage the quantification of the model is done by incorporating the quantitative data into a dynamic system diagram in order to obtain the corresponding relationship between the variables in the model consistently.
Finally, it is the stage of model evaluation. In this stage there should be verification and validation of the model. Verification is performed to determine the consistency of the model made by checking the dimensions of the variables used in the model and determine the accuracy of the use of methods of integration (time step) that are selected. Whilst validation is done by comparing the model simulation with the real situation. Validation includes direct structure tests without running the models, and comparing test of the model behaviour with quantitative behaviour pattern.
In organising the model, there are four stages that needs to be given attention. The first is problem identification. Problems associated in this stage include the existence of a fairly complex problems, many variables involved, and time. To clarify the scope of the problem, it is required restrictions on the problem and used the relevant assumptions in building the model. Some of the necessary variables include the total initial value of cement productivity, the amount of cement consumption, and cement industrial capacity.
The second is data collection techniques. The data collection is aimed to collect a variety of data and information related to the cement industry, cement supply chain activities, including the activities of the process of supply, production to distribution. Data that are needed include primary and secondary data which contains the following. The primary data include: 1) the supply chain of the existing condition of the cement in Indonesia in general and in the study area, especially through direct observation in the field survey and interview process with the stakeholders. 2) Historical data of the Indonesian cement production, historical data of cement sales, historical data on cement consumption , historical data in the study area of cement production, historical data of cement consumption in the study area, and the data of infrastructural development plan.
The secondary data that needs to be collected include those obtained from the literature and from related agencies. Other secondary data needed include the data of demand for cement in the province of Banten, construction project planning data, and other supporting data. These secondary data was collected from the Indonesian Cement Association, the Central Bureau of Statistics at provincial level, the ministry of public works in Banten and National Planning Agency ( BAPENAS)
The third stage is making the Model and Simulation. Modelling, simulation and analysis need to be conducted in accordance with the goals, objectives, and the scenario. Before running the simulation, it is necessary to put the values of the required parameters. The initial value of the variables studied, the fraction or parameters and effect link between a variable with a significant other variables that are determined based on empirical data and information that can be gathered from sources and relevant literatures.
Finally, The stage of model verification and validation. In model verification, there is need to check an recheck the unit size to the variables in the models. This includes the level, rate and the constants of secondary data, and then determines the accuracy of the use of methods of integration and the time step chosen, and asked stakeholders to evaluate the model created. While the model validation was carried out in accordance with the purpose of modelling to compare the dynamic behaviour of the model with the real system conditions. If the model has been deemed valid, then this model can be used as a representative model.
Model Design
In designing the model there are three steps taken. The first is by describing the dynamic system model. In this model design , the analysis will be limited only to matters relating to the supply and demand of cements used for the raw materials that are needed for the construction industry. Any problems associated with the supply and demand for cements are analysed using the causal loop approach which formulated in the stock and flow diagram, and further simulated using Software Powersim Studio2005.
Note that, in constructing the casual loop diagram, Powersim 2.5 software program is used. The data that are accommodated in this software are both production and consumption of cements in Banten. The data period used was from 2003 to 2013. The production data were taken from the following cement industries. These are PT. Semen Padang (PT, SP), PT. Indocement Tunggal Tbk (PT. ITP), PT. Semen Balfour (PT, SB), PT. Holcim Indonesia Tbk (PT, HI), PT. Semen Gresik (PT, SG), PT Semen Bosowa Maros. (SBM), while the consumption data was divided into cement consumption for construction and non-construction.
The third is model formulation. However, before formulating the model, the following assumptions need to be mentioned. First, the availability model built should be applicable to both construction and non construction. Second, the cement industries analysed are those in the group of Indonesian Cement Association. Third, the data for cement consumption were limited to cement consumption for constructional purposes in Banten. Fourth, the growth rate of the project was held constant over the period 2004-2025. Fifth, the period of simulation analysis is limited to the period of 2003 to 2025. Finally, it is assumed that the total cement industry was considered fixed during 2003-2013. Note that, before formulating the model, data on the types of distributional patterns are analysed using Promodel Software 7.5 programs.
In the context of the sub model of the cement availability, the study used the following mathematical equations.
• Historical Data of Cement = NORMAL (2.22317 million tons <<>>; 641 070 tons <<>> ) where, historical data of cement = normal distribution of cement production in scale year (tons)
• cement consumption data = NORMAL (2.21146 million tons <<>>; 643 820 tons <<>>) where, historical data of cement = normal distribution of cement consumption.
The above equations are the equations to determine the need or the amount of cement required for supporting both construction and non0construction projects. The value of production is based on data from the Indonesian Cement Association in the periods of 2003-2013, while for consumption used data for both construction and non-construction obtained from the result of the normal distribution using the software Promodel 7.5.
Furthermore, in the analysing the availability of cement using dynamic system, the model design, simulation and analysis were conducted in accordance with the objectives and scenarios on the model. Policy scenarios that will be used in the analysis of cement available in Banten province used the following scenario. First , a scenario with no change in policy that describes the condition of the production and consumption of cement during the period of 2003-2013 where there was a tendency of dynamic data or random. Under these conditions then it was predicted the situation in the future. In this model it is assumed there are no expansion on production capacity to improve productivity. This situation illustrates the state without the addition of a new plant. With this model it can be analyzed situations and behaviour of the availability of cement system in the province of Banten in the absence of policy changes or additions to the new cement industry.
IV. RESULTS AND DISCUSSION
The General Conditions Cement Industry
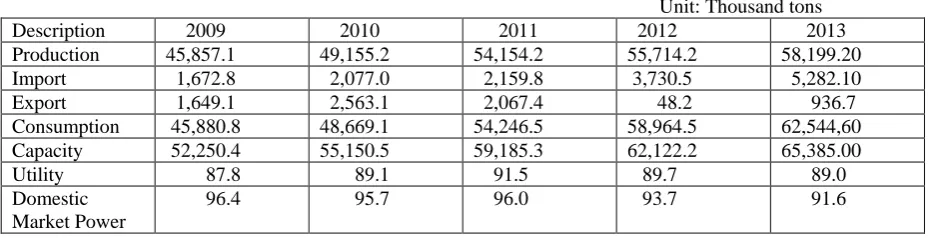
[image:4.595.30.501.670.789.2]Detail of production, consumption and capacity of the cement industry in Indonesia can be seen in Table 1. As can be seen at this Table that there had been an increase of production as well as consumption of cement in Indonesia. However, in terms of trade, there have been deficit of cement in Indonesia between the period of 2009 and 2013 as the data available. This suggests that the local production of cement in Indonesia relatively has been limited to fulfil the demand for cement. Therefore, the government plays important role in bridging the increasing demand of cement in Indonesia.
Table 1. Production, Consumption and Capacity of Cement Industry in Indonesia
Unit: Thousand tons
Description 2009 2010 2011 2012 2013
Production 45,857.1 49,155.2 54,154.2 55,714.2 58,199.20
Import 1,672.8 2,077.0 2,159.8 3,730.5 5,282.10
Export 1,649.1 2,563.1 2,067.4 48.2 936.7
Consumption 45,880.8 48,669.1 54,246.5 58,964.5 62,544,60
Capacity 52,250.4 55,150.5 59,185.3 62,122.2 65,385.00
Utility 87.8 89.1 91.5 89.7 89.0 Domestic
Market Power
Source : Central Board of Statistics, various years.
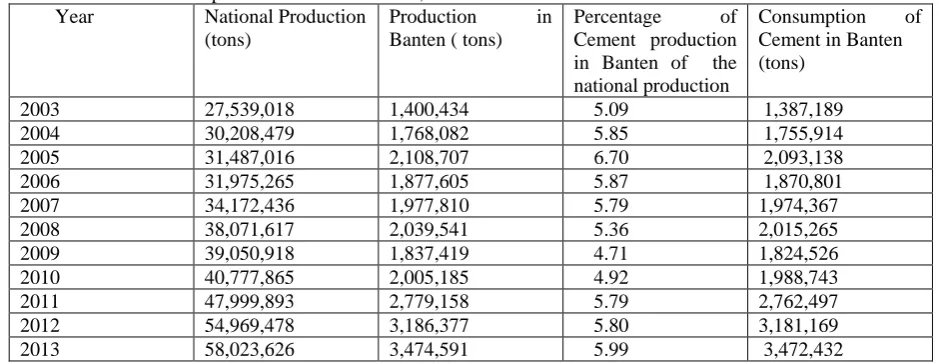
In the province of Banten the expenditure of industrial construction per year between the period 2013-2014 continued to increase to reach 11.8 trillion rupiah. Judging from the type of work, nearly 60 per cent of the construction value is the result of the work of civil building construction such as the construction / repair of roads and bridges. The used of cement for construction in this province was about 6 percent of the total national cement production in 2013. Details production and consumption of cement in the province of Banten can be seen at Table 2.
Table 2. Production and Consumption of cement in Banten, 2003-2013 Year National Production
(tons)
Production in Banten ( tons)
Percentage of Cement production in Banten of the national production
Consumption of Cement in Banten (tons)
2003 27,539,018 1,400,434 5.09 1,387,189
2004 30,208,479 1,768,082 5.85 1,755,914
2005 31,487,016 2,108,707 6.70 2,093,138
2006 31,975,265 1,877,605 5.87 1,870,801
2007 34,172,436 1,977,810 5.79 1,974,367
2008 38,071,617 2,039,541 5.36 2,015,265
2009 39,050,918 1,837,419 4.71 1,824,526
2010 40,777,865 2,005,185 4.92 1,988,743
2011 47,999,893 2,779,158 5.79 2,762,497
2012 54,969,478 3,186,377 5.80 3,181,169
2013 58,023,626 3,474,591 5.99 3,472,432
Source : Indonesian Cement Association, various years.
The use of cement as a raw infrastructure material in Banten
[image:5.595.62.532.171.353.2]Construction sector plays an important role in the economic development process, especially to support the creation of economic and social infrastructures in a region and to stimulate the growth of other economic sectors. The number of construction companies in Banten during the period 2013-2014 increased from 2,413 units to 2,440 units. However, the increase of the number of companies was not followed by the increase in the number of permanent workers. During these years, the number of workers reduced from 25 335workers to 24 967 workers (Table 3). This indicates that the growing number of construction company does not always contribute to the increase of the number of workers. Thus, much remain to be done to push the use of workers by the construction companies.
Table 3. The number of Construction Companies in Banten, 2013-2014
Description 2013 2014
The number of Construction companies
2,413 2,444
The number of workers 25,335 24,967 Constructional values (billion
Rupiah)
10,904 11,799
Source : Provincial Statistic Bureau, 2015.
Table 4. Budget Allocation for Infrastructures in Banten, 2015
Unit : Million Rupiah
Ministry of Public Works 869,787.8
Housing development Programs 200,610.8
Housing Monitoring, controlling, and implementation 31,834.7 Management of Official Buildings and Housing 28,188.3
Sanitation and Waste Management 35,167.8
Drinking Water system Management 102,648.0
Policy and program Formulation, International Cooperation and Data Information
2,771.7
Road Construction Program 273,782.5
Capacity Development and Preservation of National Roads
273,782.5
Regional Spatial Planning 0.0
Regional Spatial Plan Implementation 0.0
National Plan Implementation 0.0
City Development Plan 0.0
Spatial Development Plan 0.0
Water Management Program 395,394,8
Irrigation Development and Management 51,489,7
Natural Disaster Management 45,554.1
Water Integrated management 32,666.9
Conservation and Development of Dams 224,684.3
Water supply and management 40,999.7
Source : National Development Plan Agency, 2015.
The Cement Industries in Banten
[image:6.595.63.532.550.701.2]There are three types of the cement industries in the province of Banten. These are Indonesian Cement Association (ASI), PT Cemindo Gemilang (White Cement Industries), and PT Semen Hippo. The Indonesian Cement Association was founded on October 7, 1969 and consisted of two state-owned cement plants that exist at the time as the P.N. Semen Padang and P.N. Semen Gresik. Indonesian Cement Association was originally established as a forum for communication, consultation and coordination for the purposes of cooperation between its members in developing the cement industry both in terms of production, quality, marketing, research and development as well as in other matters where deemed necessary by the members, society and the State. Details of the supply of cement produced by the member companies of this association are shown at Table 5.
Table 5. Cement Production Produced by Cement Companies under ASI, 2003-2013
Unit : tons
Years PT. SP PT. SB PT. ITP PT. HI PT.SG PT SBM
2003 16,665 80,950 829,193 215,123 258,503 -
2004 40,581 88,911 907,246 328,5873 402,770 -
2005 107,308 94,511 918,893 388,732 501,462 97,800
2006 165,383 69,634 780,444 313,504 419,984 128,656
2007 157,728 44,921 976,213 385,365 305,904 107,679
2008 225,567 3,462 1,804,843 443,268 242,016 40,385
2009 251,137 18,404 1,001,731 348,108 216,709 233,521
2010 198,210.71 8,205 1,153,184 383,282 258,936 3,367
2011 223,732.85 1,800 1,490,213 543,528 483,005 36,877
2012 307,182 - 1,600,362 648,134 553,429 72,270
2013 416,128.62 - 1,650,918 600,476 785,968 21,100
Source : The Indonesian Cement Association, 2015.
building an integrated cement factory in the area Bayah, PT. Cemindo Gemilang also have a grinding plant in the area Ciwandan, Banten, with a two-line production capacity of 750,000 and 1,000,000 tons years.
PT. Cement Hippo or PT. Sun Fook Industries Indonesia are companies manufacturing cement with trademark CEMENT HIPPO which was established on 22 January 2013, with the aim to meet the demand for high-quality cement in Indonesia. This company has adopted the Quality Management System ISO 9001: 2008 as a standard procedure Operation. This company was able to maximize production capacity to reach 1.2 million tons per year. Note that in this paper, PT. Hippo cement is not included in the study analysis.
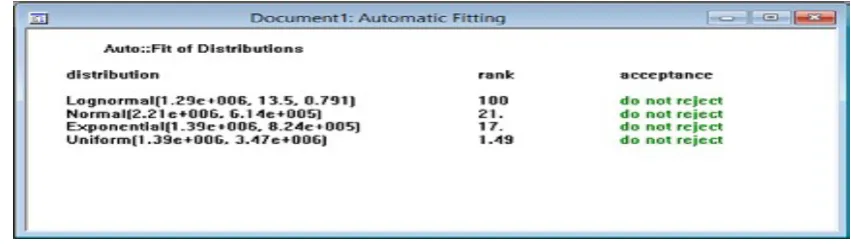
The Analysis of Cement Production and Consumption
[image:7.595.98.496.268.399.2]Using the dynamic system model, it was found that the production of cement are distributed normally which have mean value of 2.223.170 and the standard deviation of 641.070 ( Table 6).
Table 6. Automatic Fitting of Cement Production using ProModel Software Program
In terms of the cement consumption, it was found that the cement consumption are also normally distributed with a mean value of 2.21146 and standard deviation of 643.820 (Table 7). Note that the normal distribution is a bell-shaped function with parameter μ (mean) and σ (standard deviation). Normal random variables used to model many random phenomenon that can be expressed as the number of random variables, based on the central limit theorem. The analysis should be careful in using the normal distribution to model random phenomena which cannot assume a negative value. The normal distribution is generally used to describe process, while model formulation model is a formulation of the problem into mathematical form to represent the real system. Model formulation links variables that have been identified in the conceptual model with symbolic language.
Table 7. Automatic Fitting cement consumption using Promodel 7.5 software program
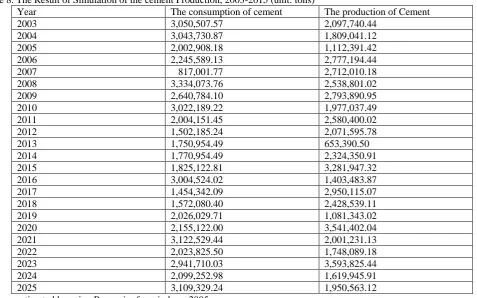
[image:7.595.82.508.555.677.2]of large-scale Maja, the construction of International Port Bojonegara, and the construction of the Sunda Strait Bridge. Table 8 shows the simulation results of the cement production from the year 2003 to 2015.
Table 8. The Result of Simulation of the cement Production, 2003-2015 (unit: tons)
Year The consumption of cement The production of Cement
2003 3,050,507.57 2,097,740.44
2004 3,043,730.87 1,809,041.12
2005 2,002,908.18 1,112,391.42
2006 2,245,589.13 2,777,194.44
2007 817,001.77 2,712,010.18
2008 3,334,073.76 2,538,801.02
2009 2,640,784.10 2,793,890.95
2010 3,022,189.22 1,977,037.49
2011 2,004,151.45 2,580,400.02
2012 1,502,185.24 2,071,595.78
2013 1,750,954.49 653,390.50
2014 1,770,954.49 2,324,350.91
2015 1,825,122.81 3,281,947.32
2016 3,004,524.02 1,403,483.87
2017 1,454,342.09 2,950,115.07
2018 1,572,080.40 2,428,539.11
2019 2,026,029.71 1,081,343.02
2020 2,155,122.00 3,541,402.04
2021 3,122,529.44 2,001,231.13
2022 2,023,825.50 1,748,089.18
2023 2,941,710.03 3,593,825.44
2024 2,099,252.98 1,619,945.91
2025 3,109,329.24 1,950,563.12
Source : estimated by using Powersim for windows 2005.
To validate the model, the application of statistical method was used. This was done by comparing model output (simulation results) with the actual data. The statistical test used was Paired simple t-test. This test can be categorized as parametric statistical group that can be used in testing the hypothesis and to determine whether there is a significant difference of the actual data and the results of the simulation.
If the results of the simulation showed : (a) t- value is more than t- table (- 0,523 <- 2.228) at the level of 5 percent , then H0 is accepted. This means that there is no difference between the average value of the actual cement consumption with the average consumption of cement simulation. Moreover, if the t value is more than t- table (0.351 <2.228) at the level of 5 percent, then H0 is accepted. This means that there is no difference between the average value of the actual cement production with an average of the simulation of cement production.
In terms of cement consumption, the results of simulation towards the cement consumption based on the fiscal budget of Banten, the study found the following results as shown at Table 9. Note that, the data are estimated by multiplying the fiscal value of the province in 2015 and the results of the analysis of cement consumption in the periods 2016-2025.
Table 9. Cement Consumption towards development in Banten Province, 2016-2025
Units: Tons
Year Housing Infrastructural
Programs
Road Development Programs
Water Resources Development Programs
2016 707,905.04 965,325.06 1,391,293.90
2017 335,953.00 458,117.73 660,221.27
2018 363,150.48 495,205.20 713,724.32
2019 468,151.30 638,388.14 920,089.57
2020 497,833.18 678,863.43 978,425.39
2021 721,304.20 983,596.64 1,417,628.17
2022 467,503.58 637,504.88 918,816.60
2023 679,535.01 926,638.65 1,335,536.34
2024 484,927.21 661,264.38 953,060.41
2025 732,114.99 998,338.64 1,438,875.37
[image:8.595.64.534.630.779.2]
V. CONCLUDING NOTES
The results of the dynamic system model simulation confirm that the cement production is influenced by historical data of the cement industry as well as cement consumption data used for both construction and non-construction purposes from 2003-2013 year. However, in terms of the cement production, the study indicated that in 2014-2025 the production of cement will be fluctuated. This fluctuation is estimated to be unable to meet the cement consumption in these years.
To improve the above estimated results of dynamics system model, further studies need to accommodate other variables including the rate of production, production capacity, exports, inflation, exchange rate, growth rate of construction projects, economic growth , global economic and population growth. The inclusion of these variables in the dynamic system model will give a better estimation. In addition, there is also a need to update the period under estimation from the period of 2003-2015 to the period of 2005-2015. Also, there is a need to specify location under study from the provincial level to the city or districts level. This is mainly because a simulation technique using dynamics model at the provincial level needs many assumptions. Therefore, caveat applies towards the findings of this study.
However, this study can be used as the starting point in estimating the future needs of cement production in the province of Banten. Based on the findings, the study suggests the following. First, there is a need to increase the number of cement industries in the province of Banten. Second, the provincial government should introduce conducive policies to attract investors to invest in cement industries to support the sustainability of cement production. Third, the increase of cement industries should be environmentally friendly. Fourth, there is a need to develop a large capacity of cement production. Finally, the government needs to monitor the availability of cements to mitigate the gap between the supply and demand of cements in this region. Thus, much remain to be done by the government of the province of Banten to sustain the availability of cement for infrastructural development.
REFERENCES
(1) Allen, Edward, 2005. Dasar-dasar Konstruksi Bangunan Bahan-bahan dan Metodenya. Erlangga, Jakarta.
(2) Badan Pembinaan Konstruksi Pusat Pembinaan Sumber Daya Investasi. 2012. Kajian Rantai Pasok Semen untuk Mendukung Investasi Infrastruktur.
(3) Balai Jembatan dan Bangunan Pelengkap Jalan,Pengaduan Jalan, 2000. Panduan Pengujian Agregat dan Pembuatan Beton, Pusat Penelitian dan Pengembangan Jalan dan Jembatan.
(4) BonettSatyaLelonoDjati.2007. SimulasiTeoridanAplikasinya.PenerbitAndi, Yogyakarta.
(5) Ilhami, Muhammad Adha.2011. Tutorial PowerSim LM Sipro. FakultasTeknik Universitas Sultan Ageng Tirtayasa, Banten.
(6) Institut Teknologi Bandung dan Lablink, IndocementTunggalPrakasaTbk, 2014. Laporan Tahunan 2014 ,Jakarta.
(7) Jurusan Teknik Sipil. 2012, Pedoman Penulisan Dan Penyusunan Penelitian Mahasiswa, Universitas Sultan Ageng Tirtayasa, Banten.
(8) Kantor Statistik Provinsi Banten 2015. Statistik Daerah Provinsi Banten. Pemerintah Daerah Provinsi Banten, Serang
(9) Kholil,2005. Penelitian Rekayasa Model Sistem Dinamik Pengelolaan Sampah Terpadu Berbasis Nirlimbah (Zero Waste) Studi Kasus di Jakarta Selatan. Jurusan Teknologi Industri Pertanian, Sekolah Pascasarjana, Institut Pertanian Bogor.
(10) Marzuki,Puti Farida, 2007. Sustainability dalam Bidang Material, Rekayasa dan Konstruksi Beton (Prosiding Seminar Nasional).FTSL-ITB, Bandung.
(12) Muhammadi, Erman Aminullah, Budhi Soesilo. 2001. Analisis Sistem Dinamis Lingkungan Hidup, Sosial, Ekonomi, Managjemen.,UMJ Press, Jakarta.
(13) NovitaAnggraeni. 2006. Supply-Chain Management. Yogyakarta.
(14) Nyoman Pujawan, 2011. Supply Chain Management Agroindustri yang Berkelanjutan. Lubuk Agung, Bandung.
(15) RahayuUtami. 2006. Penelitian Simulasi Dinamika Sistem Ketersedian UbiKayu di Bogor.Jurusan Teknologi Industri Pertanian, Institut Pertanian Bogor.
(16) Rosman, Ahmad. 2007. Bahan Bangunan Sebagai Dasar Pengetahuan.Bangun Cipta, Jakarta.
(17) Suryawan, A,2009, Perkerasan Beton Semen Portland (Rigid Pavement)- Perencanaan Metode AASHTO 1993 Spesifikasi Parameter Desain.Beta Offset, Yogyakarta.
(18) TetenW.Avianto. 2007. Tutorial PowerSim, Publikasi System Dynamics.Lablink,Jakarta.
(19) Tirta,DanuG. 1999. Teknologi Beton Lanjut. Universitas Katolik Parahyangan, Bandung.
(20) Thomas J. Kakiay.2004. Pengantar Sistem Simulasi.Penerbi Andi, Yogyakarta.
(21) Tomy Perdana dan Teten W.A 2014. Analisis Kebijakan Pengembangan Sistem Rantai pasok Industri perberasan dengan pendekatan system Dynamic.Laboratorium Fakultas Agribisnis, Universitas Padjajaran, Magister Study.
http://www.bappenas.go.id/id/id/ [4 April 2016, 20.00 WIB]
http://www.semenindonesia.com[27 Maret2016, 14.00 WIB]