FEB-MAR, 2016, VOL. 3/14 www.srjis.com Page 3401 PROBLEMS OF SCHOOL EDUCATION IN PUNJAB
Neerja Gautam, Ph.D.
(Asso.Prof.) D.A.V.College of Education for women,Amritsar.
Education is a core sector for achieving the objective of employment, human resourcedevelopment and bringing about much needed change in social environment, leading to overall progress through efficient use of resources. An appropriate education system cultivates knowledge, skill, positive attitude, awareness and sense of responsibility towards rights and duties and imparts inner strength to face oppression, humiliation and inequality. (Ninth Five Year Plan, 1997-2002) A person who is able to read and write with understanding in any language is recordedas literate. Literacy is the best possible barometer to judge the level of educational awakening in a state, leading to a minimum capacity for self-learning.
Punjab is in the most unenviable position with respect to literacy and education. There has been an increase in total literacy rate by 11.4 per cent points between 1991-2001. Male literacy has improved by 9.97 per cent points, female literacy by 13.1 per cent points and rural literacy by 12 per cent points during this period. Although the absolute number of illiterates has decreased from 70.43 lakh in 1991 to 63.80 lakh in 2001 (excluding the 0-6 age-group), the number continues to be alarmingly high. The state has universal access at the primary level. It has a significantly high ratio of primary sections. Except some remote areas/new habitations with small populations, there is a government primary school in almost every village. However, there are 61 per cent villages without a middle section. In fact, 16 per cent habitations do not have an elementary school even within the norm of 3 km. Nearly one-fourth of the children are either not enrolled in schools or are in unrecognized schools.
FEB-MAR, 2016, VOL. 3/14 www.srjis.com Page 3402 Financing Of Secondary Education
The expenditure on education in general and secondary education in particular consistently increased during the period 1950-51 to 1997-98. The expenditure increased from a low Rs. 114 crore in 1950-51 to Rs. 42,027 crore in 1997-98; thus showing an increase of 17.84 per cent per annum. The expenditure on education by other departments, if included, comes out more than Rs. 52,465 crore in 1997-98. But much of the increase in the expenditure is eaten by the high inflation. Compared to 369-fold increase at current prices, the increase in constant prices during 1950-51 to 1997-98 was only 18 times. The per capita and per pupil cost (at constant prices) in 1997-98 were only Rs. 104 and Rs. 553 (Azad, 2001).
The percentage expenditure on education to GDP in 1997-98 was much lower (3.7 per cent) than the targeted GDP (6 per cent) recommended by the Kothari Commission (1964-66). The plan expenditure on education increased from Rs. 153 crore in the first plan to Rs. 24,909 crore in the ninth plan. But percentage of plan allocation on education during the same period declined from 7.86 to 2.90 percent. The plan allocation on secondary education increased from Rs. 20 crore during the first plan to Rs. 2,604 crore in the ninth plan. During the same period, the percentage to total allocation on secondary education declined from 13 to 10.5 percent. However, allocation to elementary education increased from 56 per cent in the first plan to 66 per cent during the ninth plan.
In 1989-90, government and local body schools together contributed more than 95 per cent of the total expenditure on education. During 1950-51 to 1989-90, allocation on account of fees and other private sources declined sharply from 32 per cent in 1950-51 to 6.6 per cent in 1989-90. In 1989-90, more than 79 per cent of the total expenditure on higher secondary education was incurred on salaries of teaching staff. Together with the salaries of non-teaching staff, it comes out to be about 92 per cent. A significant decline is also noticed in the budgetary allocation for education under both the state and union governments. While the state government budgets declined from 21.4 per cent in 1970-71 to 19.7 percent in 1997-98, central government budget estimates declined from 28 per cent in 1970-71 to 2.1 per cent in 1991-92 but increased to 3.4 per cent in 1997-98.
FEB-MAR, 2016, VOL. 3/14 www.srjis.com Page 3403 of the private unaided (Rs. 3,061) managements followed by private aided (Rs.1,861), local body (Rs. 1,349) and government (Rs. 1,236) managements. A further break-up of annual expenditure per secondary/higher secondary student reveals that chunk of the amount was incurred on private coaching (Rs. 326). While a student in the government and local body school incurred (all levels) Rs. 84, students under private aided and unaided schools incurred an expenditure of Rs. 284 and Rs. 186 respectively. Further, it has been noticed that on an average a secondary/higher secondary student incurred an amount of Rs. 272 on account of books and another Rs. 248 on uniforms. The same on account of tuition fee and stationery was Rs. 197 and Rs. 190. Other major items of expenditure were the examination (Rs. 66) and transport (Rs. 98) fee.
The analysis presented above clearly indicates that secondary education has never been the priority area of investment. It was the elementary education, which has got the lion’s share all through the plan periods. The second area of concern is the expenditure incurred on salaries (92 per cent). Practically no money is left for the developmental work. Third, the share of secondary education in the ninth plan stands only at 10.5 per cent. In 1997-98, its percentage to GNP was well below the one per cent. Whatever meager increase the secondary education has got was eroded by the inflation and in real terms the increase is somewhat illusory. The UEE by 2010 will generate rapid demand for secondary education to expand. In that case, it would demand a quantum jump in allocation than what is it receiving today.
Growth In Enrolment
Enrolment during 1950-51 to 1999-2000 at different levels of school education is presented in Table 15. A perusal of table reveals that irrespective of the level of education, enrolment has shown consistent and significant increase throughout the period 1950-51 to 1999-2000. This is also true for the increase in girl’s enrolment, which increased at much faster rate than the increase in boy’s enrolment. Enrolment at the primary level increased from 19.2 million in
FEB-MAR, 2016, VOL. 3/14 www.srjis.com Page 3404 enrolment data is available. The share of girl’s enrolment at upper primary and high/higher secondary level increased from 16.13 to 40.38 per cent and 13.33 to 38.99 per cent during the same period. In the latest decade (1991 to 2000), enrolment at the primary level increased at an annual rate of 1.72 per cent compared to 2.40 and 4.43 per cent increase in the upper primary and high and higher secondary enrolment.
Like the increase in primary enrolment, upper primary enrolment is also increased but at much faster rate which is because of the low enrolment base in the initial year. Enrolment in upper primary classes increased from 3.1 million in 1950-51 to 34.0 million in 1990-91 and further to 42.1 million in 1999-2000. During the last decade, upper primary enrolment increased at the rate of 2.46 per cent per annum, which is slightly higher than the increase in the primary enrolment. During the same period, girls enrolment 2.97 lakh children of 6-14 age group who are out of school. Among those enrolled in schools, the dropout rate is very high. Out of 100 children enrolled in class 1, only 22 reach senior secondary level. The condition of facilities and infrastructure available in the primary schools is pitiable. More than 1,000 schools do not have buildings of their own. Even such basic necessities as drinking water and toilets are conspicuous by their absence in a large number of schools. Students do not have proper
sitting arrangements and teachers do not have sufficient numbers of black-boards to teach
and chairs to sit on. Apart from physical inputs, the most glaring weaknesses are lack of
motivation, outdated teaching methodology and unskilled teachers. Although Punjab has a
respectable teacher-pupil ratio of about 1:42 at primary level, a one-way dialogue between
teachers and students has remained the norm and learning by rote the only methodology.
The prevalent teaching-learning process is inadequate for the first generation students,
who are not supported by the home environment. Further, there is lack of relevance of
education to day to day life. A commitment to create specific and stated levels of learning
and competence at different stages of education, is absent. At present, there is no reliable
system of concurrent monitoring or evaluation at the state level. Planning is vague and
indicative, with no commitment to fulfillment of stated specific targets. The main stress has
only been on formulation of schemes and almost no action-research to discover what will
work. Total lack of accountability towards pupils and their performance is further
hindering educational development. The time has indeed come for introspection and
FEB-MAR, 2016, VOL. 3/14 www.srjis.com Page 3405 Education Policy and Plans
The Government of India’s National Policy on Education, 1986 (modified in the year 1992) is a
forthright statement on education as an empowering agent. While making certain modifications in NPE (1986) in 1992, the Central Government took a significant decision to direct the State Governments to have their own state programmes of action for implementing the thrust areas of the policy, keeping in view local conditions as also the spirit of NPE. NPE gives priority to universalization of elementary education (UEE) and identifies it as the major goal. It lays emphasis on the following aspects of education:
(i)universal access; (ii) universal enrollment and universal retention of children upto 14
years of age; (iii) a substantial improvement in the quality of education. The policy relating
to secondary education implies: (i) Providing access to secondary schools in the unserved
areas. (ii) Establishing open schools for children who cannot attend full-time schools. (iii)
Enhancing the options by ensuring a vocational stream along with the three streams of
humanity, science, commerce in higher secondary schools. (iv) Consolidating the facilities:
a) Improvement in curriculum and evaluation methods. b) Improvement in infrastructural
facilities, such as building, classrooms and playgrounds, etc.
Adhering to the national policy, Punjab aims to achieve the goal of universalization of elementary education. For this, separate Directorates of Primary Education and Secondary Education have been set up. Till now, we had been adhering to the national policy. This is, however, for the first time that Punjab has initiated its own policy wherein the major objective is to universalize implementation of the national policy. A perusal of the Five Year Plans of Punjab reveal that although the First Five Years Plan did recognize quality as the key area of concern for educational reforms, the pressures for expansion were such that most of the development expenditure was consumed for opening new schools and appointment of additional
teachers, rather than in making concentrated efforts to improve the quality of education.
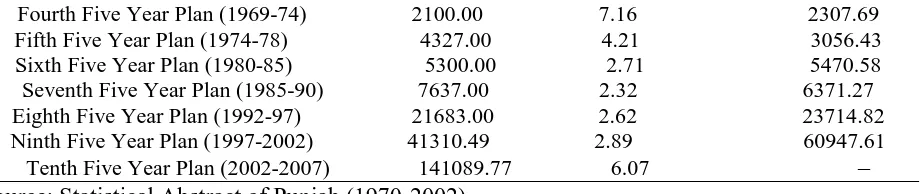
FEB-MAR, 2016, VOL. 3/14 www.srjis.com Page 3406 During the Tenth Plan, it is envisaged that the main stress will be laid on providing/upgrading infrastructural facilities in the existing schools by providing buildings/furniture. It will also cater to decentralization to the village level, training of manpower, which includes teaching personnel and leadership. The focus of the state administration in the Tenth Plan is mainly on improving the quality of education. A study of the outlay and expenditure in different five-year plans on general education (all stages) reveals picture shown in Table 7.
Table 7 Punjab: Outlay and Expenditure in Different Five Year Plans on General
Education (Rs. in lakh)Plans, Approved outlay on education, Percentage of total outlay,
Expenditure on Education .
Fourth Five Year Plan (1969-74) 2100.00 7.16 2307.69 Fifth Five Year Plan (1974-78) 4327.00 4.21 3056.43 Sixth Five Year Plan (1980-85) 5300.00 2.71 5470.58 Seventh Five Year Plan (1985-90) 7637.00 2.32 6371.27 Eighth Five Year Plan (1992-97) 21683.00 2.62 23714.82 Ninth Five Year Plan (1997-2002) 41310.49 2.89 60947.61 Tenth Five Year Plan (2002-2007) 141089.77 6.07 –
Source: Statistical Abstract of Punjab (1970-2002)
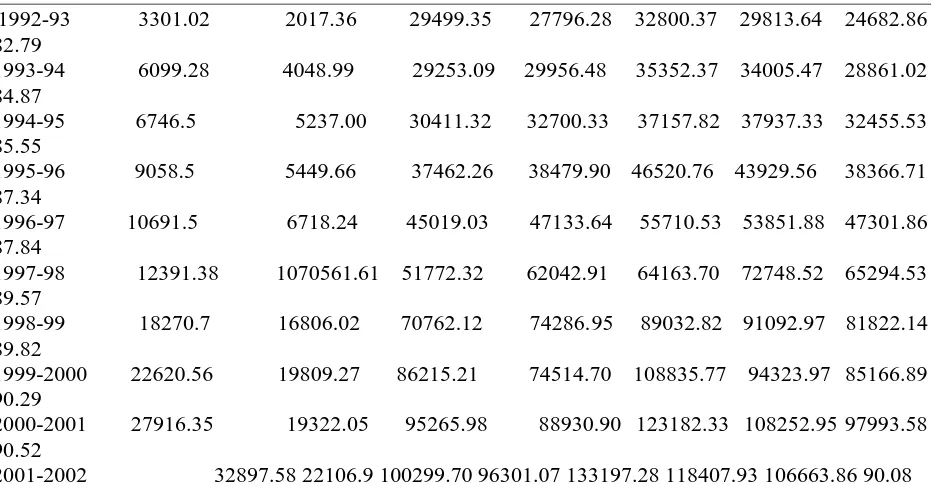
FEB-MAR, 2016, VOL. 3/14 www.srjis.com Page 3407 Table 8 Expenditure and Budget of School Education in Punjab,
Secondary Education Year, Plan/ Non-Plan Budget Allocation Expenditure, Budget Allocation Expenditure, Total Budget Allocation, Total Expenditure, Expenditure on Salaries, % Expd. on Salaries
1992-93 3301.02 2017.36 29499.35 27796.28 32800.37 29813.64 24682.86 82.79
1993-94 6099.28 4048.99 29253.09 29956.48 35352.37 34005.47 28861.02 84.87
1994-95 6746.5 5237.00 30411.32 32700.33 37157.82 37937.33 32455.53 85.55
1995-96 9058.5 5449.66 37462.26 38479.90 46520.76 43929.56 38366.71 87.34
1996-97 10691.5 6718.24 45019.03 47133.64 55710.53 53851.88 47301.86 87.84
1997-98 12391.38 1070561.61 51772.32 62042.91 64163.70 72748.52 65294.53 89.57
1998-99 18270.7 16806.02 70762.12 74286.95 89032.82 91092.97 81822.14 89.82
1999-2000 22620.56 19809.27 86215.21 74514.70 108835.77 94323.97 85166.89 90.29
2000-2001 27916.35 19322.05 95265.98 88930.90 123182.33 108252.95 97993.58 90.52
2001-2002 32897.58 22106.9 100299.70 96301.07 133197.28 118407.93 106663.86 90.08
Source: Directorate of Education, Punjab
In spite of the fact that educational expenditure continues to be the highest item next only to defence, the resource gap for educational needs is still one of the major problems. Punjab is spending 2.88 per cent of the SGDP on education in comparison to 3.62 per cent at the national level. However, this percentage is really less, as there was a clear indication in the NPE 1986 that the investment on education should reach six per cent of the national income. Not only is the allocation for education very low, but, according to present data, 90 per cent of the expenditure at the secondary level are spent on salaries. At the secondary level, the expenditure on salaries has been consistently rising from 83 per cent in 1992-93 to 87 per cent in 1995, 89 per cent in 1998 and has finally reached 90 per cent in 2000-01. Such a high percentage of expenditure on salaries clearly reveals that very little is left for development of education itself.
Secondary and Senior Secondary levels of education are also considered very essential in a child’s life. Classes XI and XII give the children the choice of joining different courses,
FEB-MAR, 2016, VOL. 3/14 www.srjis.com Page 3408 towards a place of work. The present section provides an overview of the current quantitative and qualitative status of school education in Punjab, in the light of the major goals of education identified by the national policy, along with some interventions/recommendations for policy alternatives in education. The major variables, which have been described here, are: growth of institutions by levels, enrollment, retention and dropout rate, quality of school education, non-formal education and infrastructure. This section also discusses educational policy/plans and expenditure.
Problems of School Education in Punjab
FEB-MAR, 2016, VOL. 3/14 www.srjis.com Page 3409 to day life. A commitment to create specific and stated levels of learning and competence at different stages of education, is absent. At present, there is no reliable system of concurrent monitoring or evaluation at the state level. Planning is vague and indicative, with no commitment to fulfillment of stated specific targets. The main stress has only been on formulation of schemes and almost no action-research to discover what will work. Total lack of accountability towards pupils and their performance is further hindering educational development. The time has indeeed come for introspection and diagnosis, consolidation of existing resources and planning for bridging the gaps. Education Policy and Plans The Government of India’s National Policy on
Education, 1986 (modified in the year 1992) is a forthright statement on education as an empowering agent. While making certain modifications in NPE (1986) in 1992, the Central Government took a significant decision to direct the State Governments to have their own state programmes of action for implementing the thrust areas of the policy, keeping in view local conditions as also the spirit of NPE.
NPE gives priority to universalisation of elementary education (UEE) and identifies it as the major goal. It, inter alia, lays emphasis on the following aspects of education: (i) universal access; (ii) universal enrollment and universal retention of children upto 14 years of age; (iii) a substantial improvement in the quality of education. The policy relating to secondary education implies: (I) Providing access to secondary schools in the unserved areas. (ii) Establishing open schools for children who cannot attend full-time schools. (iii) Enhancing the options by ensuring a vocational stream along with the three streams of humanity, science, commerce in higher secondary schools. (iv) Consolidating the facilities: a) Improvement in curriculum and evaluation methods. b) Improvement in infrastructural facilities, such as building, classrooms and playgrounds, etc.
FEB-MAR, 2016, VOL. 3/14 www.srjis.com Page 3410 rather than in making concentrated efforts to improve the quality of education. Moreover, opening of new schools and appointment of additional teachers were more attractive as a populist measure. Statistically too, the data on the number of schools reveal that the maximum increase was during 1970-80. It was only during the Seventh Plan (1985-90) that the focus shifted from expansion and upgradation of education to consolidation of qualitative improvement. However, during the Ninth Plan (Punjab), the main focus was on both qualitative improvement and expansion and upgradation of schools, to meet the target of universalisation. During the Tenth Plan, it is envisaged that the main stress will be laid on providing/upgrading infrastructural facilities in the existing schools by providing buildings/furniture. It will also cater to decentralization to the village level, training of manpower, which includes teaching personnel and leadership. The focus of the state administration in the Tenth Plan is mainly on improving the quality of education. The present outlay has come down to 2.89 per cent in the Ninth Plan from 7.16 per cent in the Fourth and 4.21 per cent in Fifth Plan. The percentage of the total outlay to the education sector had been consistently decreasing until the Seventh Plan. In the Eighth and the Ninth Five Year Plans, although there has been a marginal increase in the outlay i.e. it increased to 2.62 per cent in the Eighth Plan and 2.89 per cent in the Ninth Plan, but the percentage is still very low as compared to the Fourth Plan and even the Fifth Plan. Hence, it is obvious that the education sector is not being given as much priority as it was given earlier. However, the expenditure during the Ninth Plan, i.e., from 1997 to 2000 has really exceeded the given outlay. Rs.60,947.61 lakh has been spent on education in 1997-2001 as against the allotted amount of Rs. 41,310.49 lakh. The main reason was the implementation of the recommendations of the Fifth Pay Commission, wherein again the major amount was spent on salaries/state liabilities rather than educational development. In the Tenth Plan a major jump to Rs. 1,41,089.77 lakh is envisaged for the education sector and the state government claims that besides meeting the state liabilities, during this plan period, care is being taken to ensure that the money released is utilized to meet the objectives of development.
FEB-MAR, 2016, VOL. 3/14 www.srjis.com Page 3411 allocation for education very low, but, according to present data, 99 per cent of the expenditure at the primary level and 90 per cent at the secondary level are spent on salaries. The expenditure on salaries at the primary level has increased from 97.8 per cent in 1992-93 to 100 per cent in 1995-96. It dropped to 97 per cent in 1996 but has again increased and reached 99 per cent in 2000-01. At the secondary level, the expenditure on salaries has been consistently rising from 83 per cent in 1992-93 to 87 per cent in 1995, 89 per cent in 1998 and has finally reached 90 per cent in 2000-01. Such a high percentage of expenditure on salaries clearly reveals that very little is left for development of education itself.
Secondary and Senior Secondary levels of education are also considered very essential in a child’s life. Classes XI and XII give the children the choice of joining different courses,
including science, commerce and mathematics to facilitate their entry into the world of work, as this stage is terminal in nature and has been considered a turning point for the child to move towards a place of work. Let us have an overview of the current quantitative and qualitative status of school education in Punjab, in the light of the major goals of education identified by the national policy, along with some interventions/recommendations for policy alternatives in education. The major variables, which have been described here, are: growth of institutions by levels, enrollment, retention and dropout rate, quality of school education, non-formal education and infrastructure.
According to the 1991 Census, 51 per cent of the population in Punjab were completely illiterate. Nearly one-fourth of the population had studied only up to the primary level or below, nine per cent up to the middle level and 10 per cent up to matriculation. Only three per cent of the total population had studied up to graduate level or above. These figures are alarming and show that the overall picture of education in Punjab is very poor.
A major conclusion can be drawn from the above discussion that if a child is ensured education till elementary level, enrollment at the secondary level is inevitable. Another fact revealed is the failure of the education system at the secondary level, as the desired dispersal to the various streams has not taken place, which is obvious from the low figures of diploma holders.
FEB-MAR, 2016, VOL. 3/14 www.srjis.com Page 3412 Punjab, the real increase in the number of schools has been just at the primary level. However, according to the present data, following the norm that there should be one secondary section for every 1.8 elementary section, the shortage comes to nearly 6,000 secondary schools. This indicates that even if all the secondary schools are upgraded upto the senior secondary level, there will still be a shortage of nearly 3,000 schools
Alternate Schooling(Non-formal education/ Open school programme)
for children in the 6-14 age-group:
In pursuance of the National Policy on Education, 1986, the Central Government provides help for the establishment of non-formal education centers. But in Punjab, neither the government, nor NGOs, nor voluntary agencies run any such centers. Non-formal education was carried on until 1991, but there are no data available. However, since 1991, Punjab has no facility for non-formal education at the primary or upper primary level for children in the age group 6-14. In only one district of Amritsar, a Chandigarh- based NGO applied to the Centre for starting NFE centers in 90 slums of the district. This project has been approved. But at present, no non-formal educational centre is operational. It is, however, proposed that under the Sarv Shiksha Abhiyan, in the Tenth Plan, the Education Guarantee Scheme and alternative innovative education will be initiated.
for children in the 14-18 age-group:
The National Policy 1986, had proposed alternative education/open schools at the secondary level to provide access to dropouts, working children and girls. However, the state’s effort so far
FEB-MAR, 2016, VOL. 3/14 www.srjis.com Page 3413 The open school in Punjab is dependent only on student fees. In the absence of any financial support and requisite publicity, it has not realized its full potential. Recently, the state government claims to have formed VEDCs in the villages to check drop-out rates under SSA. However till date, Punjab Open School has hardly been able to cover even one per cent of the out of-school children at the matriculation level. The open schools in fact have lost their orientation and become a haven for unrecognized schools which wish to expand up to the secondary level of education and get their pupils certified through these open schools. To restore the essential character of the open schools, steps have to be taken urgently to rescue these from the stranglehold of commercially-run private schools. Further, central funding is required to subsidize the study material and offset publicity costs. At present, the number of study centers is far short of the requirement. Central assistance is essential for the extension and upgradation of the study centre network. But the best way will be to utilize the existing school infrastructure (buildings and teachers) innovatively for such non-formal education.
So the urgent need of the hour is to realize the importance of secondary education for accomplishing the objective of developing the country with a view to keep pace with the other progressive countries of the world.
The improvement of university education will end in fiasco without the improvement of secondary education. So the shortcomings of secondary education should be purged and the evils rampant in the field be eradicated. According to the remark of the distinguished educationist Mr. Jeen Thomas “The education to be offered to young people is not that of yesterday, it is that of
to-day and, as far as possible that of tomorrow. This is the watch word of those, who all over the world are awaiting a reform of education.” The problem of reconstruction of the secondary
education is a stupendous one and unless the factors which impede the progress are not removed the desired result cannot be achieved.
References
Azad, J. L. (2001): ‘Financing of Secondary Education’. Paper presented in National
Conference: Focus Secondary Education, February 14-16, 2001, NIEPA, New Delhi
Mehta, Arun C. (2002): Education for All in India with focus on Elementary Education:
Current Status, Recent Initiatives and future Prospects. NIEPA Occasional Papers,
No. 30, New Delhi.
FEB-MAR, 2016, VOL. 3/14 www.srjis.com Page 3414
NCERT (1992): Fifth All India Educational Survey (Volume I and II). NCERT, New Delhi.
NCERT (1998): Sixth All India Educational Survey Statistics on Schooling
Facilities. NCERT, New Delhi.
NSSO (1998): Attending an Educational Institutions in India: Its Level, Nature and Cost,
52nd Round: July 1995 – June 1996, Department of Statistics, Government of India,
New Delhi.
Report of the Secondary Education Commission: 1952-53, Ministry of Education, Government
of India, 1953, New Delhi.
Varghese, N. V. and Arun C. Mehta (2001): Investment Priorities and Cost Analysis: An
Analysis of Upper Primary Education in India National Institute of Educational
Planning and Administration (NIEPA), New Delhi & Vikas Publishing House, New
Delhi.
Planning commission.nic.in/stateplans/sprpun/ch11/Education/pdf
Mehta, Arun C. (2001) Status of secondary education in India .National Institute of
Educational Planning and Administration (NIEPA), New Delhi & Vikas Publishing