Yield of Maize-Soybean Intercrop and Soil Properties as
Influenced by Fertilizer in the Southern Guinea Savanna
Zone of Nigeria
A. Ali, N.B. Ibrahim
1And M. Usman
2*
Department of Soil Science, University Of Agriculture Makurdi, Benue State-Nigeria
**
Department of Agricultural Science, Federal College of Education (Technical) Potiskum, Yobe State-Nigeria
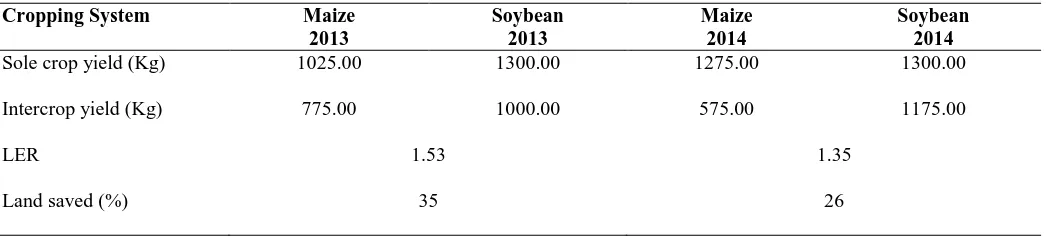
Abstract- Field experiments were conducted at the Teaching and Research Farm, University of Agriculture, Makurdi to determine the effect of fertilizer on soil properties and yield of maize-soybean intercrop. The experimental design consisted of two factors: cropping system at two levels (sole and intercrops) and fertilizer rates at three levels (0, 150 and 300 kg/ha of NPK 20:10:10). The treatments were laid out in a Randomized Complete Block Design (RCBD) in a split plot arrangement and replicated three times. The cropping systems were assigned to the main plots while the fertilizer rates were in the sub plots. A composite soil sample was obtained from a plough layer (0-15 cm) at the beginning and at the end of the experiment according to the treatments and analyzed for particle size distribution, pH, organic carbon, total nitrogen, available phosphorus and exchangeable cations [Mg2+, Ca2+, Na+ and K+] as well as cation exchange capacity (CEC). Data collected for the yield parameters of maize and soybean for both cropping seasons were subjected to the Analysis of Variance (ANOVA) after which significant means were separated using Least Significant Difference (LSD) at P<0.05. Results showed that Intercropping reduced the yields of maize and soybean compared with their sole crops. Soybean yields were generally low due to the shading effect of the maize component. Application of fertilizer significantly (P<0.05) increased the yield of the component crops in both seasons. Intercropping resulted in yield advantage; the land equivalent ratio (LER) was (1.53) in 2013 and (1.35) in 2014 showing 35 % and 26 % land saved in 2013 and 2014 cropping seasons respectively. Based on yield and productivity advantage obtained from the intercropping, the effect of different rates of NPK fertilizer on the growth and yield of maize and soybean intercrop deserve further investigation using higher fertilizer rates. It is recommended that soybean should be integrated into the maize production system to enhance increased soil organic carbon content, N, CEC, Ca, Mg and P level.
Index Terms- Yield, Maize-Soybean Intercrop and Fertilizer Rates
I. INTRODUCTION
he growing of two or more crops simultaneously during the same season on the same piece of land is called intercropping. It is a common feature of production in the developing countries including Nigeria (Mbah et al., 2007; Mehdi, 2013). The system serves as a viable strategy for higher
total crop yield and insurance against crop failure, provides for efficient resource use, reduces cost of production and increases monetary returns to the farmers (Mbah et al., 2003).
Maize is a major staple food of the people and a very important constituent of animal feed that had led to an increase in its utilization resulting in the huge demand to expand production through intercropping (Ayoola and Makinde, 2007; Awe and Abegunrin, 2009). Soybean on the other hand is among the major industrial and food crops grown in every continent. The crop can be successfully grown in many states of Nigeria using low agricultural input (Dugje et al., 2009). Also, it has been found to be agronomically compatible with other common arable crops (Raji, 2007).
In the southern guinea savanna agro-ecology of Nigeria, the commonest crop mixtures practiced involve cassava, okra, sorghum, maize and yam as major food crops in all possible combinations, with each other, with little or no attention given to legumes in the combinations. Cereal-legume mixtures have been adjudged the most productive form of intercropping since the cereals may benefit from the nitrogen fixed in the root nodules of the legumes in the current year (Undie et al., 2012). Intercropping soybean with maize was found suitable under fertilizer combinations but data on the nutrient requirements in intercropping system is very scanty (Adeniyan and Ayoola, 2007).
Responses of soybean and maize to N and P have been documented in soybean growing areas of Nigeria but little has been done to establish the scale of macro (N, P and K) and micronutrient (Zn, Mo) deficiencies. Similarly, little effort has been made in research to establish the best nutrient management strategies in maize-soybean intercrop under variable soil conditions as a way of improving maize/soybean production and productivity (Mbah et al., 2007). Though, a number of studies have been conducted on mono-cropped maize and soybean as affected by fertilizer rates, documented information on the optimum productivity of maize and soybean under intercropping systems in Makurdi is scanty, hence the need for this enquiry. The objective of the study is to determine the effect of fertilizer rates on soil chemical properties and yield of maize-soybean intercrop with a view to identify the appropriate fertilizer rate that will give optimal yield of maize-soybean intercrop in the study area.
International Journal of Scientific and Research Publications, Volume 5, Issue 7, July 2015 2 ISSN 2250-3153
www.ijsrp.org The experiment was conducted during 2013 and 2014
cropping seasons at the Teaching and Research Farm of the University of Agriculture, Makurdi-Nigeria. The study location falls within the Southern Guinea Savanna Zone of Nigeria with mean rainfall of 1, 250 mm per annum and temperature of 25-30
0C. The site had not been cultivated for about two years. It is
located between latitude 7040’N to 7053’N and longitude 8022’E to 8035’E at an elevation of 97 m above mean sea level and with a slope of 4 %. The soil is classified as Typic Ustropepts (USDA) (Fagbemi and Akamigbo, 1986). TGX 1485 – 1D variety of soybeans was sourced from the International Institute for Tropical Agriculture (IITA) Ibadan, Nigeria. Also the maize variety used (TZESR – W) was sourced from the same institute. Both varieties are grown by farmers in the study area.
Experimental treatments and design
The trial consisted of two factors: cropping system at two levels (sole maize, soybean and intercropping) and fertilizer rates at three levels (0 kg/ha, 150 kg/ha and 300 kg/ha of NPK 20:10:10) and were laid out in a split plot in RCBD with cropping system occupying the main plots and fertilizer rates at sub plots and were replicated thrice. The experimental area was cleared manually using cutlass. Thereafter it was demarcated into experimental units. Each plot was measured 4 m x 4 m = 16 m2. Planting was done on 15th July, 2013 and 17th July, 2014 respectively. Soybean and maize seeds were sown the same day after seed treatment with apron-plus. Two maize seeds were sown per hole at an inter and intra row spacing of 0.75 x 0.25 m which were later thinned to 1 plant per hole at 2 weeks after sowing to give a plant population of 53,333 plants ha-1.Soybean seeds were drilled along ridges (and straight lines on flat) and were later thinned to have plants within 5 cm of each other with an inter row spacing of 0.75 m to achieve a population of 266,000 plants ha-1.
Manual weeding was carried out at 3 and 8 weeks after planting (WAP). Fertilizer application was done at 3 WAP by band placement on sole crop soybean / sole crop maize and maize-soybean intercrop in alternate rows. Maize was harvested when the cobs were dry. Further sun-drying of the maize cobs was done before shelling. Soybean was harvested later, when the leaves had turned yellow and pods sufficiently dried.
Soil Data Collection and Analysis
A composite soil sample was obtained from a plough layer (0-15 cm) at the beginning and at the end of the experiment according to the treatments for routine analysis to see if there was a change in the soil properties after the experiment for both cropping seasons. The soil samples taken from each plot according to treatment and the composite were analyzed at NICANSOL Soil Testing Laboratory of the University of Agriculture, Makurdi, for particle size distribution, pH, Organic Carbon, Total Nitrogen, Available phosphorus and exchangeable cations [Mg2+, Ca2+, Na+ and K+] as well as Cation Exchange Capacity (CEC) using standard analytical procedures.
Maize/Soybean Data Collection and Analysis
Data were collected for the yield parameters of maize for both cropping seasons. These include cob length, cob diameter, weight of 100 seeds, number of cobs per plant and grain yield
while that of soybean include number of pods per plant, number of seeds per pod, weight of 100 pods, weight of 100 seeds and grain yield.
Data for the yield parameters of both crops were subjected to the Analysis of Variance (ANOVA) and significant means were separated using Least Significant Difference (LSD) at 5 % level of probability. The productivity from the mean yield data of both sole and intercropping system were determined by the land equivalent ratio (LER), (Willey, 1985).
LER =
--- (1)
Percentage Land Saved = 100-1/LER x 100 --- (2)
Where LER is equal to 1.0, it means that there is no advantage to intercropping over sole crop. LER above 1.0 shows an advantage to intercropping while number below 1.0 shows a disadvantage in intercropping.
Results and Discussion
Effect of Rainfall on Yield Components
Higher amount of rainfall was recorded in 2013 compared to 2014 (Table 1). The total amount of rainfall in 2013 and 2014 were 1287.8 and 1266.1 mm respectively. The low yield of both crops recorded in 2013 as compared to 2014 may be attributed to the high amount of rainfall in 2013 which most probably interfered with the fertilization and root development during flowering stage of the crops and consequently reducing yield. Delouche (1980) and Adeniyan and Ayoola (2007) had suggested that frequent or prolonged rainfall during the post maturation and pre-harvest period results in alternate wetting and drying of the crop seeds and may lead to severe deterioration. This is an indication that the yield of both crops grown during the first cropping season will have been reduced compared to the one grown during the second cropping season. The frequent and or prolonged rainfall during the first season could prevent the ability of the plants to flower; however, this would encourage the vegetative growth to the disadvantage of seed production. Also heavy rainfall which leads to water logging and heavy soil affect germination and establishment of seedlings and hence reduces yield of the crops (Swindale, 1987). This probably could have been responsible for the low yield of both crops in 2013.
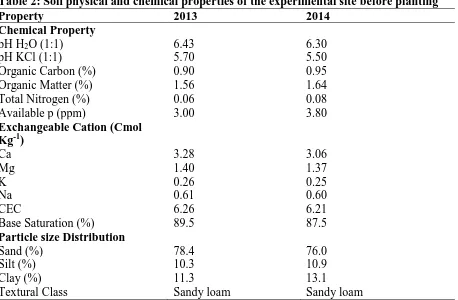
Pre-Planting Soil Analysis
Africa requires adequate soil amendment for good crop production as a result of low inherent soil fertility.
Effect of Fertilizer Rates on Soil Chemical Properties
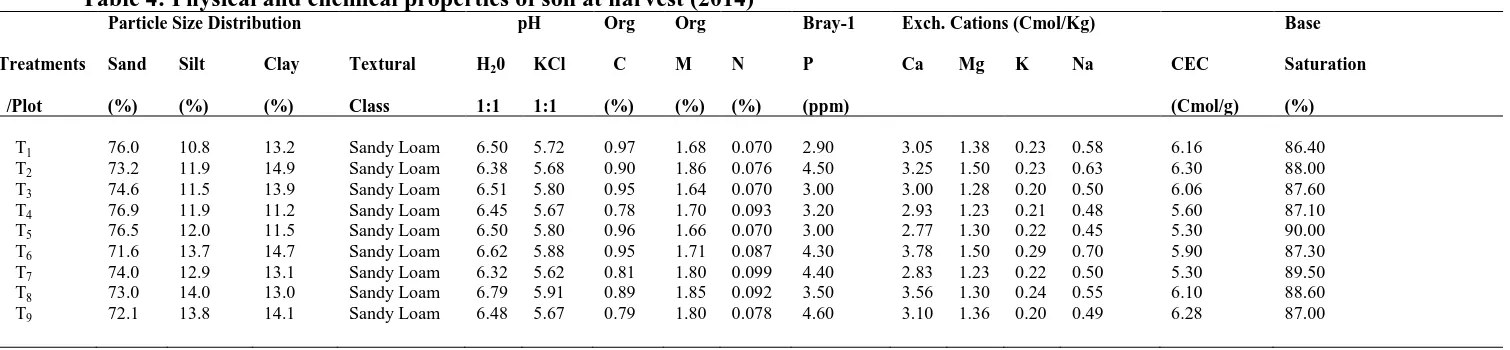
The pH of the soil after harvest in 2013 and 2014 (Tables 3 and 4) decreased in all the treatments but increased with the application of 300 kg/ha NPK fertilizer. The increase in soil pH can be adduced to addition of high inorganic fertilizer and also consistent with the findings of Chuwku et al., (2012) who reported that application of 300 kg/ha of NPK fertilizer could lead to increase in soil pH in the south eastern Nigeria. The decrease in the pH of plots with low application of inorganic fertilizer could be attributed to complete decomposition of organic matter as a result of enhanced activities of micro organisms and low level of inorganic fertilizer application (Agbede, 2009). The use of inorganic fertilizer increased SOM (Table 3 and 4) in both seasons. The soil organic matter was consistently low in plots with zero application of fertilizer. This can be attributed to the absence of fertilizer which would have enhanced the decomposition of organic matter in the soil. According to Plaster (1992), organic matter content of the soil can be maintained through incorporation of crop residues, mulching, and addition of organic and inorganic fertilizers. The total nitrogen status of the soil increased with increased application of NPK fertilizer. The increase in N content of the soil observed with addition of NPK fertilizer can be adduced to release applied of N which further enhanced microbial activities as a result of increased concentration of nutrients (Adeniyan and Ojeniyi, 2003). The depletion in total N observed in the control plots may be attributed to nutrient up take by component crops and absence of fertilizer application.
Similarly, the available P was depleted in the control plots which may be attributed to uptake of the nutrients by component crops and probably due to fixation of the element that usually occur at low soil pH (Brady and Weil, 2007). A higher build up of available P was observed with the application of 300 kg/ha NPK fertilizer. Similar trend was observed with the exchangeable bases. The release of nutrients to the soil by fertilizer application most probably explains the increase in Mg and K. The increases in Mg and K upon application of fertilizer have been reported by Adeniyan and Ojeniyi (2003). The ECEC of the soil was affected by addition of inorganic fertilizer (Tables 3 and 4). This is an indication that soils with high organic matter content will have high ECEC as reported by Plaster (1992) and Agbede (2009). This observation is consistent with Brady and Weil (2007) who reported that inorganic fertilizer application significantly (p<0.05) increased ECEC of soils.
Effect of Fertilizer Rates on the Yield Components of Maize
In 2013 and 2014, cob diameter, cob length and number of cobs per plant were not affected by intercropping while grain yield was significantly (P<0.05) affected by intercropping (Table 5). Maize yield components (100 seeds weight, grain yield and number of cobs per plant) increased with increased application of NPK fertilizer in both seasons. Higher yield components of maize were recorded under sole cropping compared to intercropping indicating that crops in sole plots suffered less from competition. The implication of this finding is that the nutrient requirements of soybean and maize in the intercropping
system were higher than the nutrient need of the sole crops as Baker (1979) and Mbah et al., (2007) reported that the nutrient demand of the component crops were always higher than for sole crops.
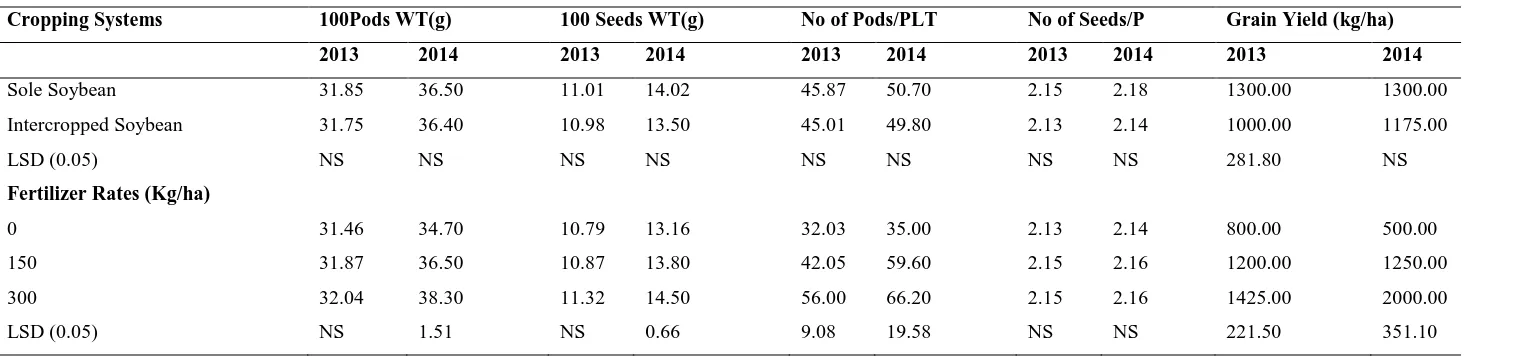
Effect of Fertilizer Rates on the Yield Components of Soybean
The soybean yield components increased with increase in NPK fertilizer application. Similar positive responses of soybean to NPK fertilizer application have been observed by some researchers (Osunde et al., 2004; Mbah et al., 2007). In addition, Kang (1975) reported a significant linear increase in yield of soybean to nitrogen (N) applied at 0, 30, 60 and 120 kg N/ha but noted that N at 30 kg/ha with inoculation gave higher yields. Okpara et al., (2002) in their study with straight nitrogen within the range (0-100 kgN/ha) and potassium (0-80 kg K2O/ha)
fertilizers in the humid rainforest zone reported high response of soybean to fertilizer application and concluded that nitrogen alone was very effective in increasing soybean yield with application of up to 100 Kg N/ha.
Similar work by Chiezey (2001) in the guinea savanna showed increased soybean grain yield with increased nitrogen fertilizer application from 0 to 80 kgN/ha. The results of the present investigation showed that soybean benefited more from the highest fertilizer rate (300 kg/ha) in the two cropping seasons, hence corroborate these reports. The zero NPK treatment gave the least yield components assessed. Averaged over the two cropping seasons, the lowest numbers of pods per plant were obtained from intercropping at zero level of NPK fertilizer application while the highest values (56.00) were obtained under sole cropping at 300 kg/ha NPK fertilizer in 2013. A similar trend was obtained in 2014 cropping season. Intercropping resulted in yield advantage; the total land equivalent ratio (LER) was (1.53) in 2013 and (1.35) in 2014 showing 35 % and 26 % land saved in 2013 and 2014 cropping seasons respectively (Table 7) due to intercropping compared to sole crop of both maize and soybean.
Conclusion and Recommendations
A field experiment was conducted during 2013 and 2014 cropping seasons at the Teaching and Research Farm of the University of Agriculture, Makurdi. Results showed that intercropping reduced the yields of maize and soybean compared with their sole crops. Soybean yields were generally low due to the shading effect of the maize component and excess water in 2013. Fertilizer significantly (P<0.05) increased the yield of the component crops in both seasons than when no fertilizer was applied. Increasing the quantity of NPK fertilizer resulted in significant increase in the yield components of maize and soybean crop in both years.
International Journal of Scientific and Research Publications, Volume 5, Issue 7, July 2015 4 ISSN 2250-3153
www.ijsrp.org rates of NPK fertilizer on soil chemical properties and the growth
Table 1: Meteorological data for Makurdi (2013/2014)
[image:5.612.38.496.399.699.2]
Source:
Tactical Air Command, NAF Base Makurdi.
Table 2: Soil physical and chemical properties of the experimental site before planting
Property
2013
2014
Chemical Property
pH H
2O (1:1)
6.43
6.30
pH KCl (1:1)
5.70
5.50
Organic Carbon (%)
0.90
0.95
Organic Matter (%)
1.56
1.64
Total Nitrogen (%)
0.06
0.08
Available p (ppm)
3.00
3.80
Exchangeable Cation (Cmol
Kg
-1)
Ca
3.28
3.06
Mg
1.40
1.37
K
0.26
0.25
Na
0.61
0.60
CEC
6.26
6.21
Base Saturation (%)
89.5
87.5
Particle size Distribution
Sand (%)
78.4
76.0
Silt (%)
10.3
10.9
Clay (%)
11.3
13.1
Textural Class
Sandy loam
Sandy loam
Month
Rainfall
(mm)
Min Temp
(
0C)
Max. Temp
(
0C)
RH
(%)
2013
2014
2013
2014
2013
2014
2013
2014
6
Table 3: Physical and chemical properties of soil at harvest (2013)
Particle Size Distribution pH Org Org Bray-1 Exch. Cations (Cmol/Kg) Base
Treatments Sand Silt Clay Textural H20 KCl C M N P Ca Mg K Na CEC Saturation
/Plot (%) (%) (%) Class 1:1 1:1 (%) (%) (%) (ppm) (Cmol/kg) (%)
T1 76.6 11.0 12.4 Sandy Loam 6.60 5.88 0.95 1.64 0.080 3.00 3.07 1.40 0.25 0.60 6.12 87.90
T2 72.3 12.4 15.3 Sandy Loam 6.50 5.70 0.88 1.90 0.077 4.20 3.29 1.51 0.26 0.65 6.40 89.10
T3 76.2 11.2 12.6 Sandy Loam 6.65 5.90 0.90 1.56 0.070 3.50 3.01 1.30 0.21 0.52 6.10 88.60
T4 77.6 11.2 11.2 Sandy Loam 6.45 5.65 0.74 1.80 0.091 3.10 2.96 1.26 0.21 0.50 5.80 87.40
T5 77.5 11.3 11.2 Sandy Loam 6.60 5.85 0.90 1.56 0.077 4.60 2.77 1.30 0.23 0.48 5.20 90.20
T6 71.8 11.2 17.0 Sandy Loam 6.65 5.90 0.92 1.75 0.088 4.00 3.80 1.60 0.30 0.71 6.00 86.70
T7 73.3 13.0 13.7 Sandy Loam 6.40 5.60 0.80 1.81 0.097 2.90 2.84 1.28 0.24 0.55 5.40 89.40
T8 72.1 14.0 13.9 Sandy Loam 6.70 5.95 0.87 1.87 0.091 3.30 3.57 1.37 0.26 0.58 6.22 88.50
T9 71.4 13.5 15.1 Sandy Loam 6.45 5.65 0.77 1.88 0.079 4.50 3.11 1.40 0.22 0.50 6.30 87.60
T1 = SMF0, T2 = SMF1, T3 = SMF2, T4 = SSF0, T5 = SSF1, T6 = SSF2,T7 = MSIF0,T8 = MSIF1,T9 = MSIF2, SM= Sole Maize, SS = Sole Soybean, MSI = Maize Soybean Intercrop, F0 = 0kg/ha,
[image:6.792.10.765.319.494.2]F1 = 150kg/ha and F2 = 300kg/ha NPK 20:10:10
Table 4: Physical and chemical properties of soil at harvest (2014)
Particle Size Distribution pH Org Org Bray-1 Exch. Cations (Cmol/Kg) Base
Treatments Sand Silt Clay Textural H20 KCl C M N P Ca Mg K Na CEC Saturation
/Plot (%) (%) (%) Class 1:1 1:1 (%) (%) (%) (ppm) (Cmol/g) (%)
T1 76.0 10.8 13.2 Sandy Loam 6.50 5.72 0.97 1.68 0.070 2.90 3.05 1.38 0.23 0.58 6.16 86.40
T2 73.2 11.9 14.9 Sandy Loam 6.38 5.68 0.90 1.86 0.076 4.50 3.25 1.50 0.23 0.63 6.30 88.00
T3 74.6 11.5 13.9 Sandy Loam 6.51 5.80 0.95 1.64 0.070 3.00 3.00 1.28 0.20 0.50 6.06 87.60
T4 76.9 11.9 11.2 Sandy Loam 6.45 5.67 0.78 1.70 0.093 3.20 2.93 1.23 0.21 0.48 5.60 87.10
T5 76.5 12.0 11.5 Sandy Loam 6.50 5.80 0.96 1.66 0.070 3.00 2.77 1.30 0.22 0.45 5.30 90.00
T6 71.6 13.7 14.7 Sandy Loam 6.62 5.88 0.95 1.71 0.087 4.30 3.78 1.50 0.29 0.70 5.90 87.30
T7 74.0 12.9 13.1 Sandy Loam 6.32 5.62 0.81 1.80 0.099 4.40 2.83 1.23 0.22 0.50 5.30 89.50
T8 73.0 14.0 13.0 Sandy Loam 6.79 5.91 0.89 1.85 0.092 3.50 3.56 1.30 0.24 0.55 6.10 88.60
T9 72.1 13.8 14.1 Sandy Loam 6.48 5.67 0.79 1.80 0.078 4.60 3.10 1.36 0.20 0.49 6.28 87.00
T1 = SMF0, T2 = SMF1,T3 = SMF2, T4 = SSF0, T5 = SSF1, T6 = SSF2,T7 = MSIF0,T8 = MSIF1,T9 = MSIF2, SM= Sole Maize, SS = Sole Soybean, MSI = Maize Soybean Intercrop, F0 = 0kg/ha, F1
Table 5: Main effect of cropping systems and fertilizer rates on yield and yield parameters of maize
COB DIA COB LNT (cm) COB/PLT 100 S WT(g) Grain Yield (kg/ha)
Cropping Systems 2013 2014 2013 2014 2013 2014 2013 2014 2013 2014
Sole maize 11.98 12.10 11.50 12.20 1.06 1.47 19.40 22.80 1025.00 1275.00
Intercropped maize 8.97 11.20 11.00 12.00 0.73 1.41 17.40 21.30 775.00 575.00
LSD (0.05) NS NS NS NS NS NS NS NS 231.0 682.5
Fertilizer Rates (Kg/ha)
0 9.23 10.99 8.61 9.61 0.79 1.41 16.45 20.40 800.00 375.00
150 10.06 11.77 11.45 12.45 0.89 1.46 19.42 21.70 900.00 1125.00
300 12.14 12.27 13.36 14.36 1.01 1.49 19.45 24.12 975.00 1250.00
LSD (0.05) 1.07 NS 1.09 2.09 0.13 NS 1.23 1.29 NS 121.0
NS = Not Significant
Table 6: Main effect of cropping systems and fertilizer rates on yield and yield parameters of soybean
Cropping Systems 100Pods WT(g) 100 Seeds WT(g) No of Pods/PLT No of Seeds/P Grain Yield (kg/ha)
2013 2014 2013 2014 2013 2014 2013 2014 2013 2014
Sole Soybean 31.85 36.50 11.01 14.02 45.87 50.70 2.15 2.18 1300.00 1300.00
Intercropped Soybean 31.75 36.40 10.98 13.50 45.01 49.80 2.13 2.14 1000.00 1175.00
LSD (0.05) NS NS NS NS NS NS NS NS 281.80 NS
Fertilizer Rates (Kg/ha)
0 31.46 34.70 10.79 13.16 32.03 35.00 2.13 2.14 800.00 500.00
150 31.87 36.50 10.87 13.80 42.05 59.60 2.15 2.16 1200.00 1250.00
300 32.04 38.30 11.32 14.50 56.00 66.20 2.15 2.16 1425.00 2000.00
LSD (0.05) NS 1.51 NS 0.66 9.08 19.58 NS NS 221.50 351.10
[image:7.792.31.792.347.526.2]8
Table 7: Productivity from mean yield data of sole and intercropping system
Cropping System Maize 2013 Soybean 2013 Maize 2014 Soybean 2014
Sole crop yield (Kg) 1025.00 1300.00 1275.00 1300.00
Intercrop yield (Kg) 775.00 1000.00 575.00 1175.00
LER 1.53 1.35
Land saved (%) 35 26
REFERENCES
[1] Adeniyan, O. N. and Ayoola, O. T. (2007). Evaluation of four improved soybean varieties under different planting dates in relayed cropping system with maize under soybean/maize/cassava intercrop. African Journal of Biotechnology. 6(19): 2220 – 2224.
[2] Adeniyan, O.N. and Ojeniyi, S.O. (2003). Comparative effectiveness of different levels of poultry manure with NPK fertilizer on residue soil fertility, nutrient uptake and yield of maize. Moor Journal of Agriculture. Ibadan 2: 191-197.
[3] Agbede, O.O. (2009). Understanding Soil and Plant Nutrition. Lafia: Salman Press. 2nd Edition. Pp 42-66.
[4] Agboola, A.A. (1975). The problem of improving soil fertility by the use of green manure in tropical farming system. FAO Soil Bulletin. 27: 147-163. [5] Awe, G. O. and Abegunrin, T. P. (2009). Effect of low input tillage and
amaranth intercropping systems on growth and yield of maize (Zea mays). African Journal of Agricultural Research. 4(7): 578-583.
[6] Ayoola, O. T. and Makinde, E. A. (2007). Fertilizer treatment effects on performance of cassava under two planting patterns in a cassava based cropping system in south west Nigeria. Research Journal of Agriculture and Biological Science. 3(1): 13-20.
[7] Baker, E. F. I. (1979). Mixed cropping in northern Nigeria. III. Mixtures of cereals. Experimental Agriculture. 15: 41 – 48..
[8] Brady, N.C. and Weil, R.R. (2007). The Nature and Properties of Soils (13th Ed.) Prentice Hall, New Jersey.
[9] Chiezey, U.F.( 2001). Pod abortion and grain yield of soybean (Glycine max (L.) Merrill) as influenced by nitrogen and phosphorus nutrition in the northern guinea savanna zone of Nigeria. Tropical Oilseeds Journal. 6: 1 – 10.
[10] Chukwu, L.I., Ano, A.O. and Asawalam, D.O. (2012). Effects of poultry manure and NPK fertilizer on soil properties and nutrient uptake of maize (Zea mays L.) plants growth in an Ultisol. Proceedings of the 36th Annual Conference of the Soil Science Society of Nigeria (SSSN) on 7th – 11th March. University of Nigeria Nsukka.
[11] Delouche, J.C. (1980). Physiological changes during storage that affect soybean seed quality and stand establishment. INTSOY Series 22: 12-19. [12] Dugje, I. Y., Omoigui, L. O., Ekeleme, F., Bandy Opadhyay, R. Lava
Kumar, P. and Kamara, A.Y. (2009). Farmers Guide to Soybean Production in Northern Nigeria. International Institute of Tropical Agricuture, IITA Ibadan, Nigeria. Pp. 21.
[13] Fagbemi, A. and Akamigbo, F.O.R. (1986). Soils of Benue State and their capabilities. Proceedings of the 14th Annual Conference of Soil Science Society Nigeria. Held at Makurdi on the 4th -7th November. Pp. 49-52. [14] Kang. T.A.(1975). Effects of inoculation and nitrogen fertilizer on soybean
in western Nigeria. Experimental Agriculture. 11: 23 -31.
[15] Mbah, E.U., Muoneke, C.O. and Okpara, D. A. (2003). Evaluation of Cassava/Soybean intercropping system as influenced by cassava genotypes. Nigerian Agricultural Journal. 34:11-18.
[16] Mbah, E.U., Muoneke, C. O. and Okpara, D. A. (2007). Effect of Compound fertilizer on the yield and productivity of soybean and maize in soybean/maize intercrop in southeastern Nigeria. Tropical and Subtropical Agroecosystems. 7:87-95.
[17] Mehdi, D. (2013). Intercropping two varieties of maize (Zea mays L.) and Peanut (Arachis hypogea L.): Biomass yield and intercropping advantages. International Journal of Agriculture and Forestry. 3:7-11
[18] Okpara, D.A., Nwajiugo, U.C. and Ibiam, B. (2002).The response of soybean to nitrogen and potassium fertilization in the forest belt of south eastern Nigeria. Tropical Oilseeds Journal. 7: 53 – 61.
[19] Olatunji, O. and Ayuba, S.A (2012). Effect of combined applications of poultry manure and NPK 20-10-10 fertilizer on soil chemical properties and yield of maize (Zea mays L.). Proceedings of the 35th Annual Conference of the Soil Science Society of Nigeria (SSSN). 7th – 11th March. Federal University of Technology Minna.
[20] Osunde, A.O., Tsado, P.A., Bala, A. and Sanginga, N. (2004). Productivity of a maize – promiscuous soybean intercrop as affected by fertilizer in the southern Guinea Savanna Zone of Nigeria. West African Journal of Applied Ecology. 5:51- 62.
[21] Plaster, E.J. (1992). Soil Science and Management. Newyork: Delmar Publishers Inc. Pp 173- 320.
[22] Prasad, B. and Singh, S.K. (2000). Long term effects of fertilizers and organic manures on crop yields, nutrients balance and soil properties in rice-wheat cropping system in Bihar. In: Long- term soil fertility Experiments in Rice-Wheat Cropping System. Advances in Soil Science. 20:105-119.
[23] Raji, J. A. (2007). Intercropping soybean and maize in a derived savanna ecology. African Journal of Biotechnology. 6(16): 1885 – 1887
[24] Swindale, L.D. (1987). Conference Introduction. In: Proceedings of the International Pearl Millet Workshop. 7-11 April, ICRISAT Centre, India. 37: 29-38.
[25] Undie, U. L. Uwah, D. F and Attoe, E. E (2012). Effect of intercropping and crop arrangement on yield and productivity of late season maize/soybean mixtures in the humid environment of south southern Nigeria. Journal of Agricultural Science. 4(4): 37-40.
[26] Willey, R. W. (1985). Evaluation and presentation of intercropping advantages. Journal of Experimental Agriculture. 21:119-133.
AUTHORS
First Author – Dr. A. Ali, Dr. N.B. Ibrahim, Department of Soil
Science, University of Agriculture Makurdi, Benue State-Nigeria