INTRODUCTION
Osteoporosis is a disease characterized by low bone mass and structural deterioration of bone tissue, leading to bone
fragili-ty and an increased vulnerabilifragili-ty to fractures.1 As osteoporosis and related fractures occur primarily due to aging, they are a increasing health care burden in the aging population.2 Ac-cording to the 2009 Korean Health Statistics, the prevalence of osteoporosis was 8.1% in men aged 50 years or older.3 However, osteoporosis is presently under-diagnosed and under-treated. Among men with osteoporosis, 6.4% were diagnosed with os-teoporosis by a physician, and only 4.3% reported being treat-ed.3 Although men have a relatively lower risk of having osteo-porosis compared to women, men with osteoporotic fracture demonstrated a higher rate of mortality and correspondingly a greater economic impact.4-6 Thus, earlier intervention of os-teoporosis is needed in men.7 It is, therefore, crucial that effort is given to finding more effective methods for prevention and early detection of osteoporosis for men.
Development and Validation of Osteoporosis
Risk-Assessment Model for Korean Men
Sun Min Oh
1*, Bo Mi Song
1,2*, Byung-Ho Nam
3, Yumie Rhee
4, Seong-Hwan Moon
5,
Deog Young Kim
6, Dae Ryong Kang
7, and Hyeon Chang Kim
1,81Cardiovascular and Metabolic Disease Etiology Research Center, Yonsei University College of Medicine, Seoul; 2Department of Public Health, Yonsei University Graduate School, Seoul;
3Biometric Research Branch, National Cancer Center, Goyang;
Departments of 4Internal Medicine, 5Orthopedics Surgery, 6Research Institute of Rehabilitation Medicine, and 8Preventive Medicine,
Yonsei University College of Medicine, Seoul;
7Department of Medical Humanities and Social Medicines, Ajou University School of Medicine, Suwon, Korea.
Purpose: The aim of the present study was to develop an osteoporosis risk-assessment model to identify high-risk individuals among Korean men.
Materials and Methods: The study used data from 1340 and 1110 men ≥50 years who participated in the 2009 and 2010 Korean
National Health and Nutrition Examination Survey, respectively, for development and validation of an osteoporosis risk-assess-ment model. Osteoporosis was defined as T score ≤-2.5 at either the femoral neck or lumbar spine. Performance of the candidate models and the Osteoporosis Self-assessment Tool for Asian (OSTA) was compared with sensitivity, specificity, and area under the receiver operating characteristics curve (AUC). A net reclassification improvement was further calculated to compare the devel-oped Korean Osteoporosis Risk-Assessment Model for Men (KORAM-M) with OSTA.
Results: In the development dataset, the prevalence of osteoporosis was 8.1%. KORAM-M, consisting of age and body weight, had a sensitivity of 90.8%, a specificity of 42.4%, and an AUC of 0.666 with a cut-off score of -9. In the validation dataset, similar results were shown: sensitivity 87.9%, specificity 39.7%, and AUC 0.638. Additionally, risk categorization with KORAM-M showed im-proved reclassification over that of OSTA up to 22.8%.
Conclusion: KORAM-M can be simply used as a pre-screening tool to identify candidates for dual energy X-ray absorptiometry tests.
Key Words: Osteoporosis, risk assessment, men, Korea Yonsei Med J 2016 Jan;57(1):187-196
http://dx.doi.org/10.3349/ymj.2016.57.1.187 pISSN: 0513-5796 · eISSN: 1976-2437
Received: March 6, 2015 Revised: May 18, 2015
Accepted: June 5, 2015
Corresponding author: Dr. Hyeon Chang Kim, Department of Preventive Medi-cine, Yonsei University College of MediMedi-cine, 50-1 Yonsei-ro, Seodaemun-gu, Seoul 03722, Korea.
Tel: 82-2-2228-1873, Fax: 82-2-392-8133, E-mail: [email protected] *Sun Min Oh and Bo Mi Song contributed equally to this work.
•The authors have no financial conflicts of interest.
© Copyright: Yonsei University College of Medicine 2016
Currently, dual-energy X-ray absorptiometry (DXA) is the most commonly used method of diagnosing osteoporosis and of monitoring changes in bone density over time.8 However, DXA is not recommended as a routine screening test for the general population because of its relatively high cost.9 Most guidelines limit the use of DXA for men aged 70 years or older, with the exception of younger adults with known risk factors.10 Therefore, some osteoporosis risk-assessment models have been developed for pre-screening, using simple variables. How-ever, most tools have been developed and validated for wom-en.11-15 In a nationwide dataset of Korean postmenopausal women, we recently developed and validated an osteoporosis risk-assessment model. Details of the study have previously been published.16 For men, relatively fewer osteoporosis risk-assessment models are available. The Male Osteoporosis Scr-eening Tool with body weight and quantitative ultrasound in-dex was developed in Hong Kong Chinese men.17 It provides a sensitivity of 94% and a specificity of 46%. Mscore with age, body weight, gastrectomy, emphysema, and prior fracture and a reduced Mscoreage-weight were developed in Caucasian and African American men.18 Mscore and Mscore
age-weight had a sensitivity of 88% and 100%, and a specificity of 57% and 73%, respectively. The Male Osteoporosis Risk Estimation Score (MORES) with age, body weight, and history of chronic ob-structive pulmonary disease was developed in the US men.19 MORES had a sensitivity of 93% and a specificity of 59%.
In addition, the Osteoporosis Self-assessment Tool, similar to the Osteoporosis Self-assessment Tool for Asian (OSTA), has also been widely validated in American men,20 African Ameri-can men,21 American and Hong Kong Chinese men,22 Filipino men,23 and Korean men.24 However, the subjects used in the Korean OSTA studies were limited to patients at a few clinics. Meanwhile, the Korea National Health and Nutrition Examina-tion Survey (KNHANES) included DXA tests since the middle of 2008,25 which is the first nationwide bone mineral density (BMD) dataset for the Korean population.
Therefore, we aimed to develop and validate an osteoporo-sis risk-assessment model, based on a nationwide dataset to identify high-risk Korean men who may benefit from further evaluation of osteoporosis.
MATERIALS AND METHODS
Study participants
The study is based on the data acquired in the KNHANES, which is conducted by the Korea Centers for Disease Control and Prevention and the Ministry of Health and Welfare. The KNHANES is a nationwide survey to assess the health and nu-tritional status of a non-institutionalized representative sam-ple of the Korean population. A stratified, multi-stage, clustered probability sampling design was used to select participants from residential districts throughout; for the 2009 survey
(KN-HANES IV-3), household units were selected using the 2005 census in Korea.3 For the 2010 survey (KNHANES V-1), sam-pling was either based on the registered market value of apart-ment building complexes or a registered database of the Ko-rean government system that includes all registered citizens.26 For development of the osteoporosis risk-assessment model, 1592 men aged 50 years or older who participated in the 2009 KNHANES were included. Of them, 252 men were excluded from the current analysis because of at least one of the follow-ing reasons: absence of BMD measurement (n=149), previ-ously diagnosed osteoporosis or treatment for osteoporosis (n=34), missing blood tests (n=144), and being in a bed-ridden state (n=14). Finally, data from 1340 men were used for this study. For validation of the developed model, the 2010 KNA-HNES dataset was used. Of 1353 men aged 50 years or older, 243 men were excluded in the same manner as the develop-ment dataset: absence of BMD measuredevelop-ment (n=112) and missing blood tests (n=147). Finally, 1110 participants were eli-gible for validation of the model developed. This study was ap-proved by the Institutional Review Board of Korea Centers for Diseases Control and Prevention (2009-01CON-03-2C, 2010- 02CON-21-C) and Yonsei University Health System (4-2011-0222) and was monitored by the Human Research Protection Center of Severance Hospital, Yonsei University Health System. All participants provided written informed consent.
Measurement
within 24 h after transportation. Serum 25-hydroxyvitamin D [25(OH)D] concentrations were assessed using a gamma counter (1470 Wizard, Perkin-Elmevr, Turku, Finland) with a radioimmunossay (Diasorin, Stillwater, MN, USA).27 Low vita-min D was defined as a serum 25(OH)D concentration of less than 20 ng/mL.27 Serum parathyroid hormone (PTH) concen-trations were measured using a chemiluminescence assay (Diasorin) for the measurement of intact PTH. Elevated PTH was operationally defined as a serum PTH concentration of 80 pg/mL or greater. Elevated alkaline phosphatase (ALP) was operationally defined as a serum ALP concentration of 300 IU/ L or greater. BMD (g/cm2) was measured at total femur, femoral neck, and L1–4 spine using a QDR Discovery fan beam densi-tometer (Hologic Inc., Bedford, MA, USA) equipment located in the mobile examination centers. We analyzed the results of the DXA using industry standard techniques at the Korean Society of Osteoporosis and performed analysis using Hologic Discovery software (version 13.1; Hologic Inc., Bedford, MA, USA).28 The stability of the DXA measurements was main-tained by daily calibration.29 T scores were calculated using gender-specific normal values for young Japanese men; the ref-erence means (standard deviations) of BMD at the femoral neck and lumbar were 0.846 (0.124) and 1.024 (0.120), respec-tively. Osteoporosis and low BMD were defined as a T score less than or equal to -2.5 and -2.0, respectively, at either the fem-oral neck or lumbar spine.
Statistical analyses
We selected potential risk and protective factors for osteopo-rosis based on previous studies and statistical investigation of the development dataset. Age,18-24 body weight,17-24 quantita-tive ultrasound index,17,22 gastrectomy,18 emphysema,18 previ-ous (low impact) fracture,18 and history of chronic obstructive pulmonary disease19 were evaluated because they were com-ponents of previously developed osteoporosis risk-assessment models.17-24 Additionally, all components of the World Health Organization Fracture Risk Assessment Tool (FRAX®)30 except corticosteroid use, secondary osteoporosis, and parent fractured hip were evaluated. There were no relevant data available to evaluate these variables in the KNHANES. In addition, regular exercise,31 history of type 2 diabetes,32 depression,33 and bio-markers34,35 including 25(OH)D, PTH, and ALP were evaluat-ed. Simple linear regression analyses were performed to de-tect variables that achieved borderline statistical significance (p<0.15). Among the identified potential risk factors, covari-ates for the multiple linear regression model were selected by 10-fold cross-validation.36 In detail, the development dataset was randomly divided into 10 subsamples. Nine subsamples were used to select significant covariates using stepwise addi-tion and deleaddi-tion (p<0.15), and the remaining one subsample was used for validation. This process was repeated ten times with different subsamples to determine the optimal number of covariates. Variables that did not reach a statistical
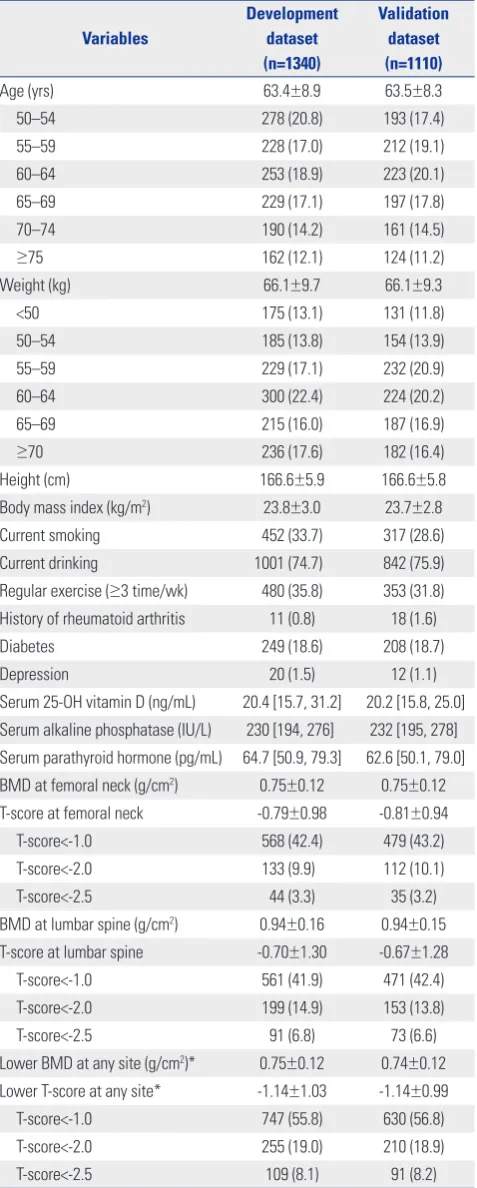
signifi-Table 1. Baseline Characteristics of Participants in the Development and the Validation Dataset
Variables
Development dataset (n=1340)
Validation dataset (n=1110)
Age (yrs) 63.4±8.9 63.5±8.3
50–54 278 (20.8) 193 (17.4)
55–59 228 (17.0) 212 (19.1)
60–64 253 (18.9) 223 (20.1)
65–69 229 (17.1) 197 (17.8)
70–74 190 (14.2) 161 (14.5)
≥75 162 (12.1) 124 (11.2)
Weight (kg) 66.1±9.7 66.1±9.3
<50 175 (13.1) 131 (11.8)
50–54 185 (13.8) 154 (13.9)
55–59 229 (17.1) 232 (20.9)
60–64 300 (22.4) 224 (20.2)
65–69 215 (16.0) 187 (16.9)
≥70 236 (17.6) 182 (16.4)
Height (cm) 166.6±5.9 166.6±5.8
Body mass index (kg/m2) 23.8±3.0 23.7±2.8
Current smoking 452 (33.7) 317 (28.6)
Current drinking 1001 (74.7) 842 (75.9)
Regular exercise (≥3 time/wk) 480 (35.8) 353 (31.8) History of rheumatoid arthritis 11 (0.8) 18 (1.6)
Diabetes 249 (18.6) 208 (18.7)
Depression 20 (1.5) 12 (1.1)
Serum 25-OH vitamin D (ng/mL) 20.4 [15.7, 31.2] 20.2 [15.8, 25.0] Serum alkaline phosphatase (IU/L) 230 [194, 276] 232 [195, 278] Serum parathyroid hormone (pg/mL) 64.7 [50.9, 79.3] 62.6 [50.1, 79.0] BMD at femoral neck (g/cm2) 0.75±0.12 0.75±0.12 T-score at femoral neck -0.79±0.98 -0.81±0.94
T-score<-1.0 568 (42.4) 479 (43.2)
T-score<-2.0 133 (9.9) 112 (10.1)
T-score<-2.5 44 (3.3) 35 (3.2)
BMD at lumbar spine (g/cm2) 0.94±0.16 0.94±0.15 T-score at lumbar spine -0.70±1.30 -0.67±1.28
T-score<-1.0 561 (41.9) 471 (42.4)
T-score<-2.0 199 (14.9) 153 (13.8)
T-score<-2.5 91 (6.8) 73 (6.6)
Lower BMD at any site (g/cm2)* 0.75±0.12 0.74±0.12 Lower T-score at any site* -1.14±1.03 -1.14±0.99
T-score<-1.0 747 (55.8) 630 (56.8)
T-score<-2.0 255 (19.0) 210 (18.9)
T-score<-2.5 109 (8.1) 91 (8.2)
BMD, bone mineral density.
Data are expressed as mean±standard error or number (%) or median [inter-quartile range].
[image:3.595.315.554.96.691.2]cance (p≥0.05) were excluded based on the results of the mul-tiple linear regression analysis with the selected covariates. Multicollinearity among the investigated variables was as-sessed using a variance inflation factor. Then, a final multiple linear regression model with the selected covariates was com-puted. The regression coefficient of each covariate was used to calculate its index weight. To standardize the effect of each variable, a ratio using a coefficient for each covariate divided by the reference value, the absolute value of the coefficient for age (per 10 years), was calculated. Each standardized coeffi-cient was then multiplied by an integer that was able to discrim-inate the effect of each variable and the final value was round-ed off as an integer.
Three candidate models were tested to develop a simple and effective model; Model 1 included age and body weight, Model 2 added health behavior, and Model 3 added blood test(s). In addition, these three models were compared to OSTA, which was a model available in the Korean population. Corre-lations of the scores from the three candidate models and OSTA with actual BMD T scores (lower values at either the femoral neck or lumbar spine) were evaluated using Spearman’s cor-relation analyses. The goodness of fit of each model was as-sessed using the Hosmer-Lemeshow test.37 The ability of each model to discriminate those with osteoporosis from those with-out osteoporosis was compared using receiver operating char-acteristic curves and the area under the curves (AUC) with sensitivity on the y-axis and (1-specificity) on the x-axis for all possible cut-off values. Next, a cut-off score was chosen which yielded 90% sensitivity or greater for detecting those with os-teoporosis in each model. The cut-off score was applied for each model and the final model was selected based on sensi-tivity, specificity, positive predictive value (PPV), negative predictive value (NPV), positive likelihood ratio, and negative likelihood ratio with their exact binomial confidence intervals (CIs). Additionally, the number of missed cases that repre-sents the number of undetected osteoporotic subjects per 1000 subjects (i.e., false negatives), the number of unnecessary DXA tests that represents the number of subjects without osteopo-rosis referred for DXA testing per 1000 subjects (i.e., false posi-tives), and AUC were compared. The model that showed the best performance using the fewest variables was selected and named as the Korean Osteoporosis Risk-Assessment Model for Men (KORAM-M). KORAM-M was then validated using an
independent dataset, KNAHNES V-1. Sensitivity analyses were performed with an outcome of low BMD T score of -2.0 or lower at either the femoral neck or lumbar spine.
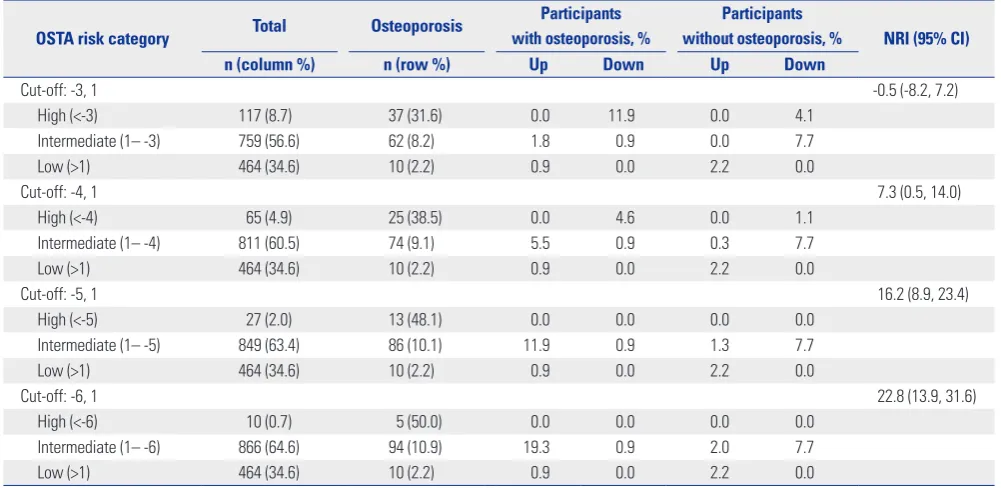
Three risk categories were created operationally according to the KORAM-M scores: low, intermediate, and high risk of having osteoporosis. Low risk was defined as having a less than 10% probability of osteoporosis, high risk was defined as hav-ing more than 70% probability, and intermediate risk was de-fined as in between these values. The net reclassification im-provement (NRI)38 was then calculated to assess whether the KORAM-M risk categories provided a benefit in discriminat-ing participants with osteoporosis from those without osteo-porosis over the risk categories of OSTA. NRI was calculated by constructing 3×3 tables according to the risk categories of KORAM-M and OSTA, separately in participants with or with-out osteoporosis. Any upward movement in categories for participants with osteoporosis meant improved tion, and any downward movement implied poor reclassifica-tion. For participants without osteoporosis, the interpretation was opposite.38
NRI=[P(up|D=1)-P(down|D=1)]-[P(up|D=0)-P(down|D=0)] (where D represents osteoporosis, 1 for osteoporosis, and 0 for normal)
All statistical analyses were performed using SAS version 9.2 (SAS Institute, Cary, NC, USA), and statistical significance was defined as a two-sided p value less than 0.05.
RESULTS
Characteristics of study participants
[image:4.595.43.538.633.724.2]Table 1 presents the baseline characteristics of Korean men in the development dataset (2009 KNHANES) and the validation data-set (2010 KNHANES). A total of 1340 and 1110 men in the devel-opment dataset and the validation dataset, respectively, were eli-gible for the current study. The mean age was 63.4 years in the development dataset and 63.5 years in the validation dataset. The prevalence of osteoporosis was 8.1% in the development dataset and 8.2% in the validation dataset. Old age, low body weight, short height, current smoking, diabetes, depression, low serum 25(OH)D, elevated ALP, and elevated PTH were selected as po-tential risk factors of osteoporosis. Meanwhile, protective factors were current alcohol drinking and regular exercise.
Table 2. Regression Coefficients and Index Weights in the Final Multiple Regression Model
Variable Regression coefficient Standard error p value Index weight
Intercept -2.847 0.299 <0.0001 −
Age (10 yrs) -0.161 0.029 <0.0001 -3
Weight (10 kg) 0.441 0.027 <0.0001 8
No regular exercise -0.112 0.051 0.027 -2
Low vitamin D* -0.119 0.049 0.015 -2
Elevated ALP† -0.320 0.067 <0.0001 -6
Table 3.
Discriminatory Performance of OST
A and the Candidate Models to Identify Men with Osteoporosis and Low BMD
Sensitivity Specificity PPV NPV NMC NUDT LR (+) LR (-) ROC
% (95% CI)
% (95% CI)
% (95% CI)
% (95% CI)
(95% CI) (95% CI) AUC (SE) Statistical difference Osteoporosis (T FN ≤
-2.5 or T
LS
≤
-2.5)
Development dataset OST
A (
≤
0)
86.2 (78.3, 92.1)
49.7 (46.9, 52.6)
13.2 (10.8, 15.9)
97.6 (96.1, 98.7)
138
503
1.72 (1.56, 1.88)
0.28 (0.17, 0.44)
0.680 (0.018)
OST
A (
≤1)
90.8 (83.8, 95.5)
36.9 (34.2, 39.7)
11.3 (9.3, 13.6)
97.8 (96.1, 99.0)
92
632
1.44 (1.34, 1.55)
0.25 (0.14, 0.45)
0.639 (0.016)
(ref)
Model 1 (
≤
-9)
90.8 (83.8, 95.5)
42.4 (39.6, 45.2)
12.3 (10.1, 14.7)
98.1 (96.6, 99.1)
92
576
1.58 (1.46, 1.70)
0.22 (0.12, 0.39)
0.666 (0.016)
<0.001
(ref)
Model 2 (
≤-10)
91.7 (84.9, 96.2)
41.2 (38.4, 44.0)
12.1 (10.0, 14.6)
98.3 (96.7, 99.2)
83
589
1.56 (1.45, 1.68)
0.20 (0.11, 0.38)
0.665 (0.015)
0.004
0.780
(ref)
Model 3 (
≤
-12)
90.8 (83.8, 95.5)
43.3 (40.5, 46.1)
12.4 (10.2, 14.9)
98.2 (96.6, 99.1)
92
567
1.60 (1.48, 1.73)
0.21 (0.12, 0.38)
0.671 (0.016)
<0.001
0.559
0.311
Validation dataset OST
A (
≤
0)
84.6 (75.5, 91.3)
48.4 (45.3, 51.5)
12.8 (10.2, 15.7)
97.2 (95.4, 98.5)
154
517
1.64 (1.47, 1.82)
0.32 (0.20, 0.52)
0.665 (0.021)
(ref)
OST
A (
≤1)
92.3 (84.8, 96.9)
33.2 (30.3, 36.2)
11.0 (8.9, 13.4)
98.0 (95.9, 99.2)
77
669
1.38 (1.28, 1.49)
0.23 (0.11, 0.48)
0.627 (0.016)
(ref)
Model 1 (
≤
-9)
87.9 (79.4, 93.8)
39.7 (36.7, 42.8)
11.5 (9.3, 14.1)
97.4 (95.3, 98.7)
121
603
1.46 (1.33, 1.60)
0.30 (0.17, 0.53)
0.638 (0.019)
0.365
(ref)
Model 2 (
≤-10)
85.7 (76.8, 92.2)
37.9 (34.9, 40.9)
11.0 (8.8, 13.5)
96.7 (94.5, 98.3)
143
622
1.38 (1.25, 1.52)
0.38 (0.23, 0.63)
0.618 (0.020)
0.506
0.017
(ref)
Model 3 (
≤
-12)
89.0 (80.7, 94.6)
39.5 (36.4, 42.5)
11.6 (9.3, 14.2)
97.6 (95.6, 98.8)
110
606
1.47 (1.35, 1.60)
0.28 (0.15, 0.50)
0.642 (0.018)
0.272
0.703
0.017
Low BMD (T
FN
≤-2.0 or T
LS
≤-2.0)
Development dataset OST
A (
≤
0)
80.0 (74.6, 84.7)
53.1 (50.1, 56.1)
28.6 (25.3, 32.1)
91.9 (89.4, 93.9)
200
470
1.71 (1.56, 1.86)
0.38 (0.29, 0.48)
0.665 (0.015) (ref) OST A ( ≤ 1)
88.2 (83.6, 91.9)
40.0 (37.1, 43.0)
25.7 (22.8, 28.7)
93.5 (90.9, 95.6)
118
600
1.47 (1.38, 1.57)
0.29 (0.21, 0.41)
0.642 (0.013)
(ref)
Model 1 (
≤
-9)
85.5 (80.6, 89.6)
45.6 (42.6, 48.6)
27.0 (24.0, 30.2)
93.1 (90.5, 95.1)
146
544
1.57 (1.46, 1.69)
0.32 (0.23, 0.43)
0.656 (0.013)
0.091
(ref)
Model 2 (
≤
-10)
85.5 (80.6, 89.6)
44.2 (41.2, 47.2)
26.5 (23.5, 29.6)
92.8 (90.3, 94.9)
146
559
1.53 (1.42, 1.65)
0.33 (0.24, 0.45)
0.648 (0.013)
0.434
0.142
(ref)
Model 3 (
≤
-12)
85.1 (80.1, 89.2)
46.5 (43.5, 49.6)
27.2 (24.2, 30.5)
93.0 (90.5, 95.0)
149
535
1.59 (1.48, 1.71)
0.32 (0.24, 0.43)
0.658 (0.014)
0.071
0.749
0.160
Validation dataset OST
A (
≤
0)
77.1 (70.1, 82.6)
51.0 (47.7, 54.3)
26.9 (23.4, 30.1)
90.5 (88.0, 92.9)
229
490
1.57 (1.43, 1.74)
0.45 (0.35, 0.58)
0.641 (0.017) (ref) OST A ( ≤ 1)
86.7 (81.3, 91.0)
35.2 (32.1, 38.4)
23.8 (20.8, 27.0)
91.9 (88.5, 94.5)
134
648
1.34 (1.25, 1.44)
0.38 (0.27, 0.54)
0.609 (0.014)
(ref)
Model 1 (
≤
-9)
84.8 (79.2, 89.3)
42.7 (39.4, 46.0)
25.7 (22.4, 29.1)
92.3 (89.3, 94.7)
153
574
1.48 (1.36, 1.60)
0.36 (0.26, 0.50)
0.637 (0.015)
0.004
(ref)
Model 2 (
≤
-10)
86.2 (80.8, 90.6)
41.1 (37.9, 44.4)
25.5 (22.3, 28.8)
92.7 (89.7, 95.1)
139
589
1.46 (1.36, 1.58)
0.34 (0.24, 0.48)
0.636 (0.015)
0.009
0.931
(ref)
Model 3 (
≤
-12)
86.7 (81.3, 91.0)
42.7 (39.4, 46.0)
26.1 (22.9, 29.5)
93.2 (90.3, 95.4)
134
574
1.50 (1.39, 1.63)
0.32 (0.23, 0.46)
0.647 (0.014)
0.001
0.287
0.218
OST
A, Osteoporosis Self-assessment T
ool for Asians; BMD, bone mineral density; PPV , positive predictive value; NPV , negative predictive value; NMC, the
number of missed
cases which represents the
number of
undetected osteoporotic subjects (i.e., false negatives) per 1000 subjects; NUDT
, the number of unnecessary DXA tests which represents the number of subjects referred for DXA testing (i.e., false positives)
per 1000
subjects; ROC, receiver operation characteristics; AUC, area under the curve; SE, standard error; T
FN
, T
-score at femoral neck; T
LS
, T
-score at lumbar spine; DXA, dual-energy X-ray absorptiometry; ALP
, alkaline phos
-phatase. Model 1 included age and weight, model 2 added regular exercise, and model 3 added low vitamin D and an elevated ALP
Development and validation of KORAM-M
Five variables associated with BMD T scores were selected ac-cording to 10-fold cross-validation: age, body weight, regular exercise, low serum 25(OH)D, and serum ALP concentrations. After adjustment for covariates, all variables had significant and independent associations with BMD T scores. Multicol-linearity among those variables was not significant. Table 2 presents regression coefficient, standard error, and index weight of each variable in the final multiple regression model. Based on the selected variables and their index weights, three candidate models were developed as follows:
• Model 1=[(age in years/10)×(-3)+(weight in kilograms/ 10)×8]
• Model 2=[(age in years/10)×(-3)+(weight in kilograms/ 10)×8+(if no regular exercise)×(-2)]
• Model 3=[(age in years/10)×(-3)+(weight in kilograms/ 10)×8+(if no regular exercise)×(-2)+(if low vitamin D)× (-2)+(if elevated ALP)×(-6)]
The ranges of scores in Model 1, Model 2, and Model 3 in men were from 6 to 61 (median 34), from 4 to 61 (median 33), and from -2 to 59 (median 31), respectively. The range of scores in the candidate models in men (-2 to 59) was different from that in postmenopausal women’s candidate models (-27 to 9) previously published.16 Therefore, the scores for the models used for men were adjusted by subtracting 45 from the scores for the men’s models:
• Model 1=[(age in years/10)×(-3)+(weight in kilograms/ 10)×8-45]
• Model 2=[(age in years/10)×(-3)+(weight in kilograms/ 10)×8+(if no regular exercise)×(-2)-45]
• Model 3=[(age in years/10)×(-3)+(weight in kilograms/ 10)×8+(if no regular exercise)×(-2)+(if low vitamin D)×(-2)+(if elevated ALP)×(-6)-45]
In the development dataset, all models for men showed reasonable fitness according to the Hosmer-Lemeshow test (p for OSTA=0.969, p for Model 1=0.776, p for Model 2=0.717, and p for Model 3=0.630). In correlation analysis between the predicted scores and actual BMD T scores, Spearman’s corre-lation coefficients were 0.320 for OSTA, 0.480 for Model 1, 0.482 for Model 2, and 0.494 for Model 3 (p for all <0.001). In terms of discriminative performance, Model 1 and Model 2 demonstrated significantly higher values of AUC compared to that of OSTA. Additionally, Model 2 showed a significantly higher value than that of Model 1, but comparable to that of
Model 3. However in the validation dataset, AUC of each model was not significantly different. For sensitivity analysis, model fitness, correlation, and AUC were also evaluated with outcome of low BMD.
Table 3 presents the discriminatory performance of OSTA and the candidate models with the selected cut-off scores to yield 90% or greater sensitivity based on sensitivity, specificity, PPV, NPV, false negative, false positive, positive likelihood ratio, negative likelihood ratio, and AUC. In the case of OSTA, the predefined cut-off score of 0 showed a relatively low sensitivity (86.2%). Therefore, a cut-off score of 1 to yield 90% or greater sensitivity was used as a reference. Model 1 showed an im-proved specificity, PPV, NPV comparable to OSTA, but compa-rable to Model 2 and Model 3. Additionally, the AUC of Model 1 was significantly higher than that of OSTA, with a cut-off score of 1, but comparable to that of Model 2, with a cut-off score of -10, and Model 3, with a cut-off score of -12. Therefore, Model 1, only based on age and body weight, with a cut-off score of -9 was finally selected and named as the KORAM-M.
Performance of KORAM-M by risk category
Table 4 presents the performance of KORAM-M to predict os-teoporosis according to its risk categories. To define the clini-cal implications of KORAM-M, three risk categories were for-med with cut-off values of -9 and -27: greater than -9 for low risk, between -27 and -9 for intermediate risk, and less than -27 for high risk. In the development dataset, 39.7, 56.1, and 4.2% were classified into low-, intermediate-, and high-risk catego-ries, respectively. Among the participants in the low-, interme-diate-, and high-risk categories, 1.9, 9.7, and 46.4%, respective-ly, had osteoporosis. In the validation dataset, the percentage of men in the low-, intermediate-, and high-risk categories was 37.5, 60.4, and 2.2%, respectively. The prevalence of osteopo-rosis was 2.6, 10.1, and 50.0% in the low-, intermediate-, and high-risk categories, respectively. We additionally analyzed men aged less than 70 years and those at 70 or more separate-ly. In the development dataset, in men aged less than 70 years, 50.5, 48.9, and 0.6% were classified into low-, intermediate-, and high-risk categories, respectively. Among men in the low-, intermediate-, and high-risk categories, 2.0, 7.9, and 66.7%, re-spectively, had osteoporosis. In men aged 70 years or older, 9.4, 76.4, and 14.2% were classified into low-, intermediate-, and high-risk categories, respectively. Among men in the low-, in-termediate-, and high-risk categories, 0.0, 13.0, and 44.0%,
re-Table 4. Performance of KORAM-M to Predict Osteoporosis According to Its Risk Categories
Risk category Development dataset Validation dataset
Total, n (column %) Osteoporosis, n (row %) Total, n (column %) Osteoporosis, n (row %)
High (<-27) 56 (4.2) 26 (46.4) 24 (2.2) 12 (50.0)
Intermediate (-27– -9) 752 (56.1) 73 (9.7) 670 (60.4) 68 (10.1)
Low (>-9) 532 (39.7) 10 (1.9) 416 (37.5) 11 (2.6)
Total 1340 (100.0) 109 (8.1) 1110 (100.0) 91 (8.2)
[image:6.595.42.537.647.724.2]spectively, had osteoporosis (Supplementary Table 1, only online).
The net improvement of KORAM-M compared to OSTA with the suggested cut-off scores (-4 and -1) was 0.9% (1 out of 109) for participants with osteoporosis, 6.3% (78 out of 1231) for those without osteoporosis, and 7.3% (95% CI 0.5–14.0) overall. Furthermore, the NRIs of KORAM-M showed improved classification up to 22.8%, compared to OSTA, across the dif-ferent cut-off scores of OSTA: -3 and 1, -4 and 1, -5 and 1, and -6 and 1 (Table 5).
Comparison of KORAM-M with the current Korean NHIC guidelines
At present, Korean National Health Insurance Corporation (NHIC) guidelines for osteoporosis screening using DXA tests are limited to men aged 70 years or older with exceptions be-ing younger men with low BMI (<18.5), past history or family history of non-traumatic fracture. KORAM-M was developed
using each individual’s age and body weight; thus, it may pro-vide an efficient targeting guideline for the use of DXA tests. The number of recommended DXA tests of KORAM-M would be more than double that of the NHIC guidelines; 60.3% vs. 27.8% of men, respectively. KORAM-M could identify 90.8% of men with osteoporosis, but the NHIC guidelines classify only 60.0% of men with osteoporosis as screening targets. Accord-ingly, false negative rate of KORAM-M was 9.2%, which is much lower than the rate of the NHIC guidelines, 39.4%. However, KORAM-M was inferior to NHIC guidelines in terms of speci-ficity. According to the NHIC guidelines, 24.9% of men with-out osteoporosis are recommended to screen for the disease. On the other hand, when we apply KORAM-M, 57.6% of men without osteoporosis are recommended to screen. Both PPV and NPV were similar between KORAM-M and NHIC guide-lines (Table 6). We repeated these analyses separately for men aged less than 70 years and for those at 70 or more. In a sub-group analysis of men aged less than 70 years, KORAM-M
clas-Table 5. Net Reclassification Improvement of KORAM-M Compared to OSTA Risk Categories with the Different Cut-Off Values
OSTA risk category Total Osteoporosis
Participants with osteoporosis, %
Participants
without osteoporosis, % NRI (95% CI)
n (column %) n (row %) Up Down Up Down
Cut-off: -3, 1 -0.5 (-8.2, 7.2)
High (<-3) 117 (8.7) 37 (31.6) 0.0 11.9 0.0 4.1
Intermediate (1– -3) 759 (56.6) 62 (8.2) 1.8 0.9 0.0 7.7
Low (>1) 464 (34.6) 10 (2.2) 0.9 0.0 2.2 0.0
Cut-off: -4, 1 7.3 (0.5, 14.0)
High (<-4) 65 (4.9) 25 (38.5) 0.0 4.6 0.0 1.1
Intermediate (1– -4) 811 (60.5) 74 (9.1) 5.5 0.9 0.3 7.7
Low (>1) 464 (34.6) 10 (2.2) 0.9 0.0 2.2 0.0
Cut-off: -5, 1 16.2 (8.9, 23.4)
High (<-5) 27 (2.0) 13 (48.1) 0.0 0.0 0.0 0.0
Intermediate (1– -5) 849 (63.4) 86 (10.1) 11.9 0.9 1.3 7.7
Low (>1) 464 (34.6) 10 (2.2) 0.9 0.0 2.2 0.0
Cut-off: -6, 1 22.8 (13.9, 31.6)
High (<-6) 10 (0.7) 5 (50.0) 0.0 0.0 0.0 0.0
Intermediate (1– -6) 866 (64.6) 94 (10.9) 19.3 0.9 2.0 7.7
Low (>1) 464 (34.6) 10 (2.2) 0.9 0.0 2.2 0.0
[image:7.595.55.556.329.573.2]KORAM-M, Korean Osteoporosis Risk-Assessment Model for Men; OSTA, Osteoporosis Self-assessment Tool for Asians; NRI, net reclassification improvement; CI, confidence interval.
Table 6. Comparison between the Current NHIC Guideline and the KORAM-M
NHIC guideline (%) KORAM-M (%)
No. of subjects recommended for DXA testing 373/1340 (27.8) 808/1340 (60.3)
Sensitivity 66/109 (60.6) 99/109 (90.8)
Specificity 924/1231 (75.1) 522/1231 (42.4)
Positive predictive value 66/373 (17.7) 99/808 (12.3)
Negative predictive value 924/967 (95.6) 522/532 (98.1)
False negative rate 43/109 (39.4) 10/109 (9.2)
False positive rate 307/1231 (24.9) 709/1231 (57.6)
[image:7.595.56.553.620.727.2]sified 80.8% of men with osteoporosis as screening targets, while the NHIC guidelines recommended only 17.3% of them to screen. Accordingly, false negative rate of KORAM-M was estimated to be 19.2%, which is much lower than that of NHIC guidelines, 82.7% (Supplementary Table 2, only online).
DISCUSSION
In the present study, the Korean osteoporosis risk-assessment model for men was developed and validated in a Korean pop-ulation based on a nationally representative BMD and health examination dataset: KORAM-M=[(age in years/10)×(-3)+ (weight in kilograms/10)×8-45].
To develop KORAM-M, we examined clinically or statisti-cally significant factors that were associated with BMD: age, body weight, height, current smoking status, currently alcohol drinking status, regular exercise, diabetes, depression, low se-rum 25(OH)D, elevated ALP, and elevated PTH. Of these fac-tors, five variables were selected as potential components of the risk-assessment models including age, body weight, regular exercise, serum 25(OH)D, and serum ALP concentrations. To develop a simple and effective model, we first defined a base-line model for age and body weight, which were fundamental factors in the previously developed models.18-24 We then inves-tigated the incremental effect of adding regular exercise to pre-dict osteoporosis. The effect of regular exercise on BMD is still controversial. In the present study, a positive association be-tween regular exercise and BMD was shown. Although only a few studies are available, our findings are consistent with pre-vious studies that found positive effects of exercise on BMD in men.39,40 Therefore, we assessed regular exercise as a compo-nent of osteoporosis risk-assessment model, even though it has never been used in previous models. Additionally, in this study, serum ALP concentrations were negatively correlated with BMD, and vitamin D concentrations were positively cor-related to BMD. Vitamin D deficiency is known to exacerbate osteoporosis41 and osteoporotic fracture.42 Thus, we evaluated whether an invasive laboratory test further improved the pre-diction of osteoporosis. As evaluating performance of each model using sensitivity, specificity, PPV, NPV, false positive, false negative, positive likelihood ratio, negative likelihood ratio, and AUC, the baseline model with age and body weight was com-parable to other models adding regular exercise and laborato-ry tests. Therefore, KORAM-M was developed based on simple variables including age and body weight. KORAM-M can be easily used in a primary care setting for pre-screening to de-cide whether to use DXA testing as well as in the general pop-ulation for self-screening purposes.
In this study, we assessed both linear and logistic regression models to calculate an index weight of each variable to make a scoring system to predict osteoporosis. However, when we compared the performance of the models, the scoring system
using the weights from linear regression analyses slightly out-performed those from logistic regression analyses (data not shown).
In addition, all candidate models were compared with OSTA, which has been validated in many countries.21,22,24 Overall, KORAM-M indicated better performance for the detection of osteoporosis than OSTA. The discriminative performance of KORAM-M was significantly superior to that of OSTA (AUC= 0.666 and 0.639, respectively, p<0.001). Additionally, KORAM-M showed improved net reclassification up to 22.8% over OSTA across different cut-off scores. Furthermore, KORAM-M showed higher sensitivity than the current Korean NHIC guide-lines (90.8% vs. 60.6%). The difference of sensitivity was more prominent among men younger than 70 years: 80.8% for KO-RMA-M vs. 17.3% for NHIC guidelines. Thus, we can propose a combined strategy. Screening with DXA can be recommend-ed to men 70 years or older, and to men younger than 70 years at high risk according to KORAM-M. Osteoporosis itself pres-ents no specific symptoms, but the burden of osteoporotic frac-ture continues to grow with age. Accordingly, the potential risks and benefits of DXA testing should be assessed. Howev-er, no clinical trials are available to investigate the effectiveness of osteoporosis screening or any potential risks that can result from screening.9 In false-negative cases, a diagnosis of osteo-porosis can be overlooked and further treatment can be de-layed. In opposition, false-positive cases can lead to unneces-sary DXA tests, unnecesunneces-sary exposure to radiation, and incre-ased health care costs. However, even though participants who underwent DXA testing did not have osteoporosis (false-posi-tive cases), the result of the DXA test will still evaluate the sta-tus of their bone health and help obtain the proper interval for BMD testing.
studies with the Korean population. Lastly, to estimate gender-specific T scores at the femoral neck and lumbar spine, site and gender-specific reference means and standard deviations were adopted from the Japanese data because no Korean reference data are currently available. Thus, KORAM-M should be addi-tionally adjusted when Korean reference BMD data are avail-able.
To our knowledge, the current study is the first to develop an osteoporosis risk-assessment model for Korean men using a nationally representative dataset that includes BMD measure-ments and other relevant risk factors of osteoporosis. Our find-ings suggest that KORAM-M is a useful pre-screening tool for screening osteoporosis by DXA in the Korean men. Since KO-RAM-M is easy to calculate with simple variables, it can be used in either a primary care setting or in general use as a self-screen-ing tool. However, prior to usself-screen-ing KORAM-M in these settself-screen-ings, its cost-effectiveness, especially compared to current NHIC guidelines, should be investigated. Additionally, replication studies using other Korean BMD datasets are recommended. Finally, further adjustment of KORAM-M using BMD data as a reference in the Korean population is necessary.
ACKNOWLEDGEMENTS
This study was supported by grants from the Korean Health Tech-nology R&D Project, Ministry of Health & Welfare (HI13C0715).
REFERENCES
1. World Health Organization. Prevention and management of os-teoporosis Switzerland. Geneva: WHO Press; 2003.
2. Ström O, Borgström F, Kanis JA, Compston J, Cooper C, McClos-key EV, et al. Osteoporosis: burden, health care provision and op-portunities in the EU: a report prepared in collaboration with the International Osteoporosis Foundation (IOF) and the European Federation of Pharmaceutical Industry Associations (EFPIA). Arch Osteoporos 2011;6:59-155.
3. MOHW and KCDC. Korea Health Statistics 2009: Korean National Health and Nutrition Examination Survey (KNHANES IV-3). Os-ong: Ministry of Health and Social Welfare and Korea Centers for Disease Control & Prevention; 2010.
4. Kiebzak GM, Beinart GA, Perser K, Ambrose CG, Siff SJ, Hegge-ness MH. Undertreatment of osteoporosis in men with hip frac-ture. Arch Intern Med 2002;162:2217-22.
5. Haney EM, Bliziotes MM. Male osteoporosis: new insights in an understudied disease. Curr Opin Rheumatol 2008;20:423-8. 6. Seeman E. Unresolved issues in osteoporosis in men. Rev Endocr
Metab Disord 2001;2:45-64.
7. Chang KP, Center JR, Nguyen TV, Eisman JA. Incidence of hip and other osteoporotic fractures in elderly men and women: Dubbo Osteoporosis Epidemiology Study. J Bone Miner Res 2004;19:532-6. 8. Krieg MA, Barkmann R, Gonnelli S, Stewart A, Bauer DC, Del Rio
Barquero L, et al. Quantitative ultrasound in the management of osteoporosis: the 2007 ISCD Official Positions. J Clin Densitom 2008;11:163-87.
9. Nelson HD, Haney EM, Dana T, Bougatsos C, Chou R. Screening for osteoporosis: an update for the U.S. Preventive Services Task Force. Ann Intern Med 2010;153:99-111.
10. Lim LS, Hoeksema LJ, Sherin K. Screening for osteoporosis in the adult U.S. population: ACPM position statement on preventive practice. Am J Prev Med 2009;36:366-75.
11. Michaëlsson K, Bergström R, Mallmin H, Holmberg L, Wolk A, Ljunghall S. Screening for osteopenia and osteoporosis: selection by body composition. Osteoporos Int 1996;6:120-6.
12. Cadarette SM, Jaglal SB, Kreiger N, McIsaac WJ, Darlington GA, Tu JV. Development and validation of the Osteoporosis Risk As-sessment Instrument to facilitate selection of women for bone den-sitometry. CMAJ 2000;162:1289-94.
13. Richy F, Deceulaer F, Ethgen O, Bruyère O, Reginster JY. Develop-ment and validation of the ORACLE score to predict risk of osteo-porosis. Mayo Clin Proc 2004;79:1402-8.
14. Koh LK, Sedrine WB, Torralba TP, Kung A, Fujiwara S, Chan SP, et al. A simple tool to identify asian women at increased risk of os-teoporosis. Osteoporos Int 2001;12:699-705.
15. Park HM, Sedrine WB, Reginster JY, Ross PD. Korean experience with the OSTA risk index for osteoporosis: a validation study. J Clin Densitom 2003;6:247-50.
16. Oh SM, Nam BH, Rhee Y, Moon SH, Kim DY, Kang DR, et al. De-velopment and validation of osteoporosis risk-assessment model for Korean postmenopausal women. J Bone Miner Metab 2013; 31:423-32.
17. Lynn HS, Lau EM, Wong SY, Hong AW. An osteoporosis screening tool for Chinese men. Osteoporos Int 2005;16:829-34.
18. Zimering MB, Shin JJ, Shah J, Wininger E, Engelhart C. Validation of a novel risk estimation tool for predicting low bone density in Caucasian and African American men veterans. J Clin Densitom 2007;10:289-97.
19. Shepherd AJ, Cass AR, Carlson CA, Ray L. Development and in-ternal validation of the male osteoporosis risk estimation score. Ann Fam Med 2007;5:540-6.
20. Adler RA, Tran MT, Petkov VI. Performance of the Osteoporosis Self-assessment Screening Tool for osteoporosis in American men. Mayo Clin Proc 2003;78:723-7.
21. Sinnott B, Kukreja S, Barengolts E. Utility of screening tools for the prediction of low bone mass in African American men. Osteopo-ros Int 2006;17:684-92.
22. Lynn HS, Woo J, Leung PC, Barrett-Connor EL, Nevitt MC, Cauley JA, et al. An evaluation of osteoporosis screening tools for the os-teoporotic fractures in men (MrOS) study. Osteoporos Int 2008; 19:1087-92.
23. Li-Yu JT, Llamado LJ, Torralba TP. Validation of OSTA among Fili-pinos. Osteoporos Int 2005;16:1789-93.
24. Lee CH, Oh SW, Seung JH, Do HJ, Lym YL, Choi JK, et al. Evalua-tion of Osteoporosis Self-Assessment Tool Usefulness as a Screen-ing Test for Osteoporosis in Korean Men. Korean J Fam Med 2009;30:944-50.
25. Park EJ, Joo IW, Jang MJ, Kim YT, Oh K, Oh HJ. Prevalence of Os-teoporosis in the Korean Population Based on Korea National Health and Nutrition Examination Survey (KNHANES), 2008-2011. Yonsei Med J 2014;55:1049-57.
26. MOHW and KCDC. Korea Health Statistics 2010: Korean National Health and Nutrition Examination Survey (KNHANES V-1). Os-ong: Ministry of Health and Social Welfare and Korea Centers for Disease Control & Prevention; 2012.
27. Choi HS, Oh HJ, Choi H, Choi WH, Kim JG, Kim KM, et al. Vita-min D insufficiency in Korea--a greater threat to younger genera-tion: the Korea National Health and Nutrition Examination Sur-vey (KNHANES) 2008. J Clin Endocrinol Metab 2011;96:643-51. 28. Hong S, Oh HJ, Choi H, Kim JG, Lim SK, Kim EK, et al.
1599-605.
29. KCDC. Education and quality control of bone mineral density in the Fourth National Health and Nutrition Examination Survey (KNHANES IV-3). Osong: Korea Centers for Disease Control & Prevention; 2009.
30. Kanis JA, Hans D, Cooper C, Baim S, Bilezikian JP, Binkley N, et al. Interpretation and use of FRAX in clinical practice. Osteoporos Int 2011;22:2395-411.
31. Langsetmo L, Hitchcock CL, Kingwell EJ, Davison KS, Berger C, Forsmo S, et al. Physical activity, body mass index and bone min-eral density-associations in a prospective population-based co-hort of women and men: the Canadian Multicentre Osteoporosis Study (CaMos). Bone 2012;50:401-8.
32. Ma L, Oei L, Jiang L, Estrada K, Chen H, Wang Z, et al. Association between bone mineral density and type 2 diabetes mellitus: a meta-analysis of observational studies. Eur J Epidemiol 2012;27: 319-32.
33. Wu Q, Magnus JH, Liu J, Bencaz AF, Hentz JG. Depression and low bone mineral density: a meta-analysis of epidemiologic stud-ies. Osteoporos Int 2009;20:1309-20.
34. Lee J, Vasikaran S. Current recommendations for laboratory test-ing and use of bone turnover markers in management of osteo-porosis. Ann Lab Med 2012;32:105-12.
35. Joo NS, Dawson-Hughes B, Kim YS, Oh K, Yeum KJ. Impact of calci-um and vitamin D insufficiencies on sercalci-um parathyroid hormone
and bone mineral density: analysis of the fourth and fifth Korea Na-tional Health and Nutrition Examination Survey (KNHANES IV-3, 2009 and KNHANES V-1, 2010). J Bone Miner Res 2013;28:764-70. 36. Kohavi R. A study of cross-validation and bootstrap for accuracy
estimation and model selection. California: IJCAI; 1995.
37. Hosmer D, Lemeshow S. Applied logistic regression. 2nd ed. New York: Wiley; 2000.
38. Pencina MJ, D’Agostino RB Sr, D’Agostino RB Jr, Vasan RS. Evaluat-ing the added predictive ability of a new marker: from area under the ROC curve to reclassification and beyond. Stat Med 2008;27:157-72.
39. Maddalozzo GF, Snow CM. High intensity resistance training: ef-fects on bone in older men and women. Calcif Tissue Int 2000;66: 399-404.
40. Forwood MR, Burr DB. Physical activity and bone mass: exercises in futility? Bone Miner 1993;21:89-112.
41. Holick MF. Sunlight and vitamin D for bone health and preven-tion of autoimmune diseases, cancers, and cardiovascular dis-ease. Am J Clin Nutr 2004;80:1678S-88S.
42. van Schoor NM, Visser M, Pluijm SM, Kuchuk N, Smit JH, Lips P. Vitamin D deficiency as a risk factor for osteoporotic fractures. Bone 2008;42:260-6.