GE-INTERNATIONAL JOURNAL OF ENGINEERING RESEARCH
VOLUME -2, ISSUE -8 (October 2014) IF-3.022 ISSN: (2321-1717)
MANGO FRUIT RIPPLE PREMIX: DEVELOPMENT AND
OPTIMISATION USING RESPONSE SURFACE METHODOLOGY
Tanmay A. Nalawade,
R&D Executive, Truli Foods, India Food Park, KIADB Phase 3, Vasanthanarsapura Industrial Area, Korahavali, Tumkur District, Karnataka.
Rupesh S. Chavan,
Department of Food Science and Technology, Assistant Professor, National Institute of Food Technology Entrepreneurship and Management (NIFTEM), Kundli, Sonepat, Haryana, India.
Anit Kumar,
Department of Food Science and Technology, Ph.D. Scholar, National Institute of Food Technology Entrepreneurship and Management (NIFTEM), Kundli, Sonepat, Haryana, India
ABSTRACT
The optimum formulation for production of premix for fruit ripple was determined using Response Surface Methodology (RSM Design Expert DX 6) in two phases with variables (sweeteners, gums, acid regulator, fruit powders, titbits, flavours and colours). Effect of amount of xanthan gum, pectin, guar gum, sugar, glucose powder, citric acid, fruit powder, fruit titbits, fruit flavour and colour on viscosity, pH, water activity, total soluble solids and sensory attributes (colour, flavour, texture and overall acceptability) of fruit ripple were investigated. Significant regression model was determined which explained the effect of changes in the concentration of the variables on responses of the fruit ripple. The coefficient of determination, R2 of all response variables were higher than 0.8. The optimized formulation given by RSM, based on response surfaces and superimposed plots, was further analysed for sensory analysis and physicochemical properties.
GE-INTERNATIONAL JOURNAL OF ENGINEERING RESEARCH
VOLUME -2, ISSUE -8 (October 2014) IF-3.022 ISSN: (2321-1717)
1. IntroductionFruits are an important component of diet and are a well established fact by dieticians
and also occupy the second place in food pyramid (Cano-Higuita et al., 2013). Fruits
alongwith vegetables, cereals, fish and olive oil, are one of the principal components of the
Mediterranean diet (L'homme et al., 2003). Fresh and processed fruits-derived products are very susceptible to enzymatic browning upon contact with oxygen in air, impairing
organoleptic and nutritional qualities of the finished products (Louarme and Billaud, 2012).
For this reason, producing convenient and healthy food products similar to the fresh ones,
without reducing their sensorial and nutritional properties, has been the focus of numerous
studies for many years.
Desserts, bakery and confectionary products when added/filled with fruit ripples
increases acceptance level by the consumers. Fruit ripples/fillings are generally used in
toppings, doughnuts, pies, cakes, and other products and are manufactured either using whole
fruit/fruit pieces or on rare occasion from fruit purees/concentrates. The fruit preparations are
also added with sweetening agents, thickening agents (gums), buffering salts and acidifying
agents (Pichle et al., 2012). Flowability is the major quality attribute for consumer’s
acceptance of the fruit fillings in the above mentioned products (Chantaro and
Pongsawatmanit, 2010). Hydrocolloids are widely used in fruit preparation and are well
known for their functional properties like; to stabilise the insoluble particles and offer a
thickening effect which ultimately improves the consistency (Young et al., 2003).
Hydrocolloids are also used to control the formation of ice crystals in the frozen products
(Fernndez et al., 2007). Gelation is of primary importance in fruit fillings as a means of
controlling texture (Agudelo et al., 2014). Pectin, a polyuronan is primarily used in the food
industry as a gelling agent during manufacturing of jams, jellies, and other foods (Igual et al.,
2014). Xanthan gum, a microbial heteropolysaccharide, composed of 1-4-linked β-D-glucose
and Guar gum (Cyamposis teragonolobus), is a member of galactomannan family which
contains 1-4 linked β-D-mannose and exhibits a pseudo-plastic and thixotropic behaviour
which offers high viscosity even at lower usage levels. The gums are more beneficial when a
thin, pourable consistency is desired in the fruit fillings (Ahmed et al., 2005). Guar gum and
GE-INTERNATIONAL JOURNAL OF ENGINEERING RESEARCH
VOLUME -2, ISSUE -8 (October 2014) IF-3.022 ISSN: (2321-1717)
0.8–1% (Fernndez et al., 2007).Wei et al. (2001) studied the flow properties of the fluid portion of fruit filling to investigate the effects of gums.
Addition of simple sugars alters polysaccharides gelling properties, by stabilising
junction zones and increasing melting temperature. Typically for hydrocolloids, high sugar
concentrations (55–70%) stabilises the junction zones within the gel network by a complex
mixture of hydrogen bonds, hydrophobic and electrostatic interactions. Thus, in terms of gel
strength, an important parameter for the bake-stable fillings, the breaking strength generally
increases with increasing sugar contents up to 70% (Young et al., 2003).
At present, limited studies on the optimization of premix for fruit ripple have been
published. Although the amounts of ingredient for fruit ripple have been recommended in
various homemade recipe books, no scientific study of the optimization of the basic
formulation of fruit ripple premix has been previously reported.
The effectiveness of response surface methodology (RSM) in optimization of
ingredient levels, formulations and processing conditions in food technology from raw to
final products such as cassava baked cake have been documented by Gan et al. (2007). RSM
includes a group of statistical and mathematical procedures which can be used to analyse the
relationships between one or more responses (dependent variables) and factors (independent
variables) (Gan et al., 2007). RSM is used to minimize the numbers of trials and provide multiple regression approach to achieve optimization.
The objective of the present study was to develop and optimize the basic formulation
for mango fruit ripple premix using response surface methodology.
2. Materials and methods
2.1 Materials
For preparation of mango fruit ripple premix base, low methoxy pectin, xanthan gum
and guar gum were supplied by M/s Gulati, Delhi with an average moisture content of 12, 11
and 12 %, respectively (AOAC, 2000). Mango fruit powder and mango fruit titbits were
supplied by M/s Aarkay Food Products Ltd., Ahmedabad and M/s Yeshraj Enterprises, Pune
respectively. Mango pulp was purchased from Delhi local market with a total soluble solid
GE-INTERNATIONAL JOURNAL OF ENGINEERING RESEARCH
VOLUME -2, ISSUE -8 (October 2014) IF-3.022 ISSN: (2321-1717)
range 0.0 ~ 90 % manufactured by ATAGO, Japan. Other ingredients used during the present
investigation were glucose powder, citric acid were supplied by M/s Gulati, Delhi. Synthetic
food grade colour (Sunset Yellow E 110) and synthetic mango flavour powder used were
purchased from M/s Ganapati Additives Pvt. Ltd., Delhi.
2.2 Experimental design
RSM was used to determine the experimental design and to optimize the ingredients
levels in preparation of mango fruit ripple premix. Experimental central composite
(face-centered) design was done by using Design Expert (DX) version 6 with three coded levels.
The RSM was done in two phases. The first phase was carried out for optimization of
stabilizers/ gums, acid regulators and sweetener level for fruit ripple premix base and second
phase was conducted for optimisation of fruit ripple premix base from first phase, mango
fruit powder, mango fruit titbit, colour and mango flavour level for mango fruit ripple
premix.
2.2.1. Optimization of stabilizer, acidity regulator and sugar level for preparation of fruit ripple premix base: For preparation of fruit ripple premix base six basic ingredients including a blend of three stabilizers, one each of acidity regulator, sugar and glucose powder
were evaluated. The levels of the different ingredients and the coded values are given in
Table 1. The coded values were incorporated into the design and were analysed in different
combinations with two blocks. The central point of the design was repeated eight times to
calculate the reproducibility of the method. The effect of independent variables on the
responses (Y) was modelled using the second-order polynomial response surface.
Table 1: Extreme level of independent variables used for optimization of stabilizer, acidity regulator and sugar level for preparation of fruit ripple premix base
Independent Variable Coded value Unit Levels
-1 0 +1
Xanthan Gum A gm 0.10
0
0.01 5
0.11
Pectin B gm 0.56 0.56
5
0.57
Guar Gum C gm 0.03
0
0.03 5
0.04 0
Sugar D gm 15.0
0
20.0 0
GE-INTERNATIONAL JOURNAL OF ENGINEERING RESEARCH
VOLUME -2, ISSUE -8 (October 2014) IF-3.022 ISSN: (2321-1717)
Citric Acid E gm 0.00
3
0.00 5
0.00 7
Glucose F gm 6.00 8.00 10.0
0
The equation derived using RSM for the prediction of the response variables is as follows:
𝑌 =
𝛽0+ 𝛽1𝐴 + 𝛽2𝐵 + 𝛽3𝐶 + 𝛽4𝐷 + 𝛽5𝐸 + 𝛽6𝐹 + 𝛽11A2+𝛽22𝐵2+𝛽
33C2+𝛽44D2+𝛽55E2+𝛽66 F2 +𝛽12𝐴. 𝐵 + 𝛽13𝐴. 𝐶 + 𝛽14𝐴. 𝐷 + 𝛽15𝐴. 𝐸 + 𝛽16𝐴. 𝐹 + 𝛽23𝐵. 𝐶 + 𝛽24𝐵. 𝐷 + 𝛽25𝐵. 𝐸 + 𝛽26𝐵. 𝐹 + 𝛽34𝐶. 𝐷 + 𝛽35𝐶. 𝐸 + 𝛽36𝐶. 𝐹 + 𝛽45𝐷. 𝐸 + 𝛽46𝐷. 𝐹 + 𝛽56𝐸. 𝐹 + 𝜀
Where, 𝛽0 is the value of the fixed response at the central point of the experiment (0,0);
β1, β2, β3, β4, β5, and β6, are the linear, β11, β22, β33, β44, β55, and β66, are the quadratic, β12, β13,
β14, β15, β16, β23, β24, β25, β26, β34, β35, β36, β45, β46, and β56,are the interactions regression
terms.
2.2.2. Optimization of addition level of fruit ripple premix base, mango fruit powder, mango titbit, mango flavour and color for preparation of mango fruit ripple premix: For preparation of mango fruit ripple premix base, five ingredients were incorporated in fruit
ripple premix base selected from first phase (2.2.1) and the coded values of ingredients in
second phase are given in Table 2. The coded values were incorporated into the design and
analysed in different combinations with two blocks and the central point was repeated eight
times to calculate the reproducibility. Second-order polynomial response surface was used to
estimate the effect of independent variables on the responses (Y). The equation derived using
RSM:
Y=β0+β1A+β2B+β3C+β4D+β5E+β11A2+𝛽22𝐵2+𝛽33C2+𝛽44D2+𝛽55E2+𝛽12𝐴. 𝐵 +
𝛽13𝐴. 𝐶 + 𝛽14𝐴. 𝐷 + 𝛽15𝐴. 𝐸 + 𝛽23𝐵. 𝐶 + 𝛽24𝐵. 𝐷 + 𝛽25𝐵. 𝐸 + 𝛽34𝐶. 𝐷 + 𝛽35𝐶. 𝐸 +
𝛽45𝐷. 𝐸 + 𝜀
Where, 𝛽0 is the value of the fixed response at the central point of the experiment (0,0);
β1, β2, β3, β4, and β5, are the linear, β11, β22, β33, β44, and β55 are the quadratic, β12, β13, β14, β15,
GE-INTERNATIONAL JOURNAL OF ENGINEERING RESEARCH
VOLUME -2, ISSUE -8 (October 2014) IF-3.022 ISSN: (2321-1717)
Table 2: Extreme level of independent variables used for optimization of addition level of fruit ripple premix base, mango fruit powder, mango titbit, mango flavour and color for preparation of mango fruit ripple premixIndependent Variable Coded value Unit Levels
-1 0 +1
Fruit ripple premix base A gm 27.00 29.00 31.00
Mango fruit powder B gm 12.00 14.00 16.00
Mango fruit titbit C gm 1.00 2.00 3.00
Colour D gm 0.005 0.007 0.009
Mango Flavour Powder E gm 0.011 0.0135 0.016
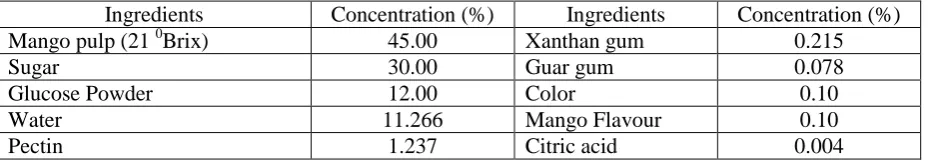
2.3. Preparation of Control mango fruit ripple
Control mango fruit ripple was prepared by using mango pulp and other ingredients as
given Table 3 and the protocol which is shown in Figure 1.
Add 65 % of total water to be used + 90 % of total added sugar + glucose powder
Dissolve the ingredients in water heated up to 450 C
Add mango pulp and heat the mixture to 500 C with regular stirring
Dissolve into water (30 % of total added water) a dry mixture of low methoxyl pectin, xanthan gum and guar gum, dry mixed with sugar (10 % of total added sugar) into the
wet mixture
Heat the wet mixture up to 800 C with regular stirring
Add colour with continuous agitation
Hold the mixture at 800 C for 5 min with intermediate stirring
Add citric acid dissolved in 5 % of total water
Cool the mixture till 500 C
Add flavour with continuous agitation
Cool the mango ripple to room temperature followed by filling and sealing in LDPE stand-up pouch
GE-INTERNATIONAL JOURNAL OF ENGINEERING RESEARCH
VOLUME -2, ISSUE -8 (October 2014) IF-3.022 ISSN: (2321-1717)
Figure 1. Flowchart for the preparation of Control mango rippleTable 3: Composition of the Control Mango fruit ripple
Ingredients Concentration (%) Ingredients Concentration (%)
Mango pulp (21 0Brix) 45.00 Xanthan gum 0.215
Sugar 30.00 Guar gum 0.078
Glucose Powder 12.00 Color 0.10
Water 11.266 Mango Flavour 0.10
Pectin 1.237 Citric acid 0.004
2.4. Rheological properties of the mango fruit ripple premix base and control mango fruit
ripple
Rheological properties i.e. viscosity of experimental and control fruit ripple samples
was measured using Modular Compact Rheometer (Model MCR52, Anton Paar Gmbh,
Austria, Europe). The measurements were taken in triplicate by direct yield measurement
program at 100C with plate-plate geometry probe using 50 mm diameter PP50 probe and gap
between surface and the probe was adjusted to 1mm. Sample were allowed to stabilize
between the plates for 10 min before commencement of test (Basu and Shivhare, 2010).
2.5 Physico-chemical properties of the mango fruit ripple premix base and control mango
fruit ripple
Experimental and control mango fruit ripple samples were subjected for
compositional analysis; fat content was determined by using Soxhlet method, protein with
Kjeldahl method (Distillation and digestion unit Model: KjelFlex K-360 and Seed Digester
K-439 respectively developed by Butchi, Switzerland, Automatic Titrator unit model: 877
Titrino developed by Metrohm, Switzerland) (AOAC 2000). Moisture and ash content of
sample was determined using hot air oven method (AOAC, 2000). Total carbohydrate was
calculated by deducting the sum of the values for moisture, crude protein, crude fat, crude
fibre and ash from 100 (Raghuramulu, 1983). Total soluble solids (TSS) of the freshly
prepared and the freeze thaw ripple samples was determined using handheld refractometer
(HSR-500 of range 0.0 ~ 90 % manufactured by ATAGO, Japan) and expressed in 0Brix.
The energy value of the sample was calculated by using the formula as given by
GE-INTERNATIONAL JOURNAL OF ENGINEERING RESEARCH
VOLUME -2, ISSUE -8 (October 2014) IF-3.022 ISSN: (2321-1717)
pH is the critical attribute that mainly affect the consistency of the fruit ripple. pH
analysis was done for freeze thaw sample and freshly prepared sample using Digital pH meter
(Systronic, Ahmedabad, India).
Water activity, is a useful parameter for predicting shelf life of the product and it was
measured using Due Point Water Activity meter 4TE (Aqua Lab) and expressed as Wa.
2.6. Sensory analysis of the mango fruit ripple premix and Control mango fruit ripple
Sensory analysis of the prepared mango fruit ripple sample was conducted by a
trained panel of 10 members from National Institute of Food Technology Entrepreneurship
and Management (NIFTEM). The sensory evaluations of ripples were carried out on fresh
sample after a storage period of 24 hrs at 10 0C. Nine point hedonic scale was used to evaluate color, flavour, texture, and overall acceptability of samples (Basu and Shivhare,
2010). All samples were presented before the panellists at room temperature under normal
lighting conditions in 50 ml cups coded with random, two alphanumeric numbers. Drinking
water was provided for oral rinsing. At each session, the panellists evaluated 3–5 samples.
The average values of the sensory scores were used in the analysis.
3. Results and Discussions
3.1. Optimization of stabilizer, acidity regulator and sugar level for preparation of fruit
ripple premix base
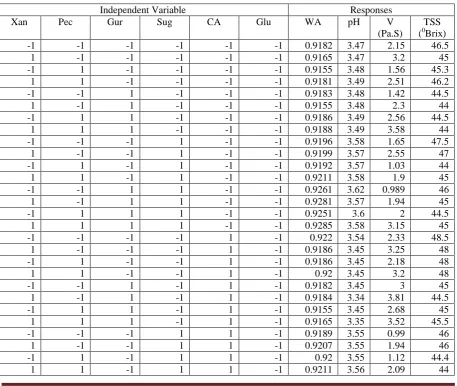
3.1.1. Model Fitting: The effects of xanthan gum, pectin, guar gum, sugar, citric acid and glucose powder on water activity (Wa), pH, viscosity (V) and total soluble solids (TSS) of
fruit ripple premix base is given in Table 4a,b. The independent and dependent variables were
fitted to the second-order model equation and examined for the goodness of fit.
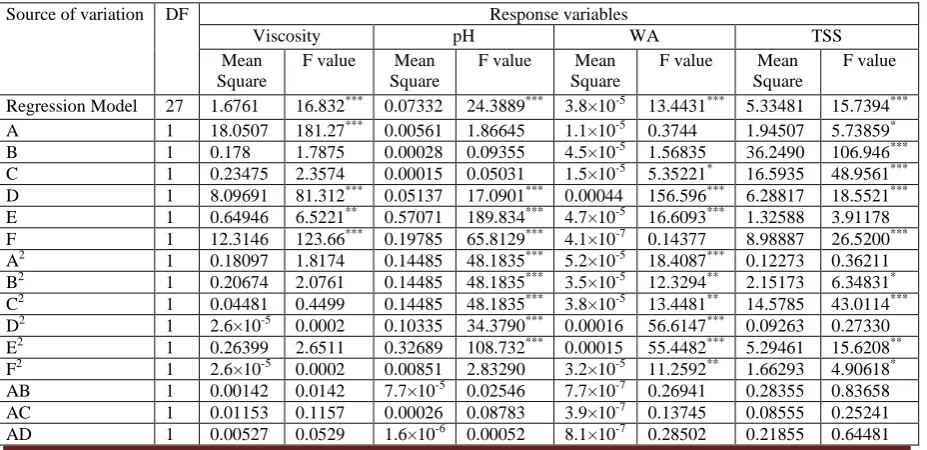
The analyses of variance (ANOVA) was performed to determine the lack of fit
and the significance of the linear, quadratic and interaction effects of the independent
variables on the dependent variables (Table 5). The lack of fit test, which is a measure for the
failure of a model to represent data in the experimental domain at which points were not
included in the regression (Gan et. al., 2007). The results showed that the models for all the
response variables were highly adequate as they had satisfactory levels of coefficient of
GE-INTERNATIONAL JOURNAL OF ENGINEERING RESEARCH
VOLUME -2, ISSUE -8 (October 2014) IF-3.022 ISSN: (2321-1717)
response variables. Therefore, the response surface models developed were adequate.
Regression coefficients (Table 6) and the equations for each of the response variables could
be derived from the predicted values of each response variable. The R2 values of all of the responses exceeded 80% indicating a high proportion of variability as explained by the data.
3.1.2 Effect of process variables on responses of fruit ripple premix base: The effect of different amounts of process variables (xanthan gum, guar gum, pectin, citric acid, sugar and
glucose powder) on responses (viscosity, pH, water activity and total soluble solids) fruit
ripple premix base are reported in Table 5 with the coefficient of second order polynomials
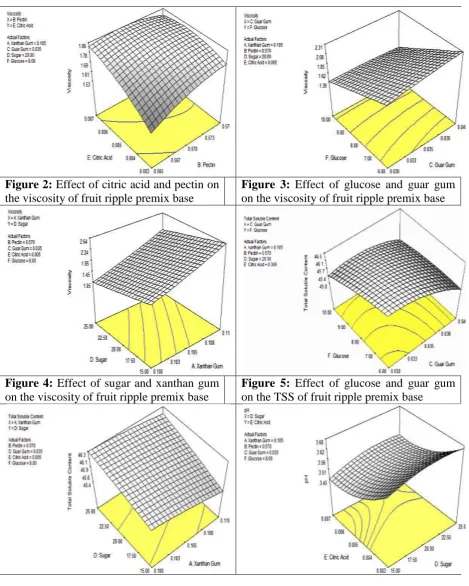
[image:9.595.69.527.313.699.2]and are shown in Figures 2-7.
Table 4a. Central composite design arrangement and experimental results for the response variables of fruit ripple premix base
Independent Variable Responses
Xan Pec Gur Sug CA Glu WA pH V
(Pa.S)
TSS (0Brix)
-1 -1 -1 -1 -1 -1 0.9182 3.47 2.15 46.5
1 -1 -1 -1 -1 -1 0.9165 3.47 3.2 45
-1 1 -1 -1 -1 -1 0.9155 3.48 1.56 45.3
1 1 -1 -1 -1 -1 0.9181 3.49 2.51 46.2
-1 -1 1 -1 -1 -1 0.9183 3.48 1.42 44.5
1 -1 1 -1 -1 -1 0.9155 3.48 2.3 44
-1 1 1 -1 -1 -1 0.9186 3.49 2.56 44.5
1 1 1 -1 -1 -1 0.9188 3.49 3.58 44
-1 -1 -1 1 -1 -1 0.9196 3.58 1.65 47.5
1 -1 -1 1 -1 -1 0.9199 3.57 2.55 47
-1 1 -1 1 -1 -1 0.9192 3.57 1.03 44
1 1 -1 1 -1 -1 0.9211 3.58 1.9 45
-1 -1 1 1 -1 -1 0.9261 3.62 0.989 46
1 -1 1 1 -1 -1 0.9281 3.57 1.94 45
-1 1 1 1 -1 -1 0.9251 3.6 2 44.5
1 1 1 1 -1 -1 0.9285 3.58 3.15 45
-1 -1 -1 -1 1 -1 0.922 3.54 2.33 48.5
1 -1 -1 -1 1 -1 0.9186 3.45 3.25 48
-1 1 -1 -1 1 -1 0.9186 3.45 2.18 48
1 1 -1 -1 1 -1 0.92 3.45 3.2 48
-1 -1 1 -1 1 -1 0.9182 3.45 3 45
1 -1 1 -1 1 -1 0.9184 3.34 3.81 44.5
-1 1 1 -1 1 -1 0.9155 3.45 2.68 45
1 1 1 -1 1 -1 0.9165 3.35 3.52 45.5
-1 -1 -1 1 1 -1 0.9189 3.55 0.99 46
1 -1 -1 1 1 -1 0.9207 3.55 1.94 46
-1 1 -1 1 1 -1 0.92 3.55 1.12 44.4
GE-INTERNATIONAL JOURNAL OF ENGINEERING RESEARCH
VOLUME -2, ISSUE -8 (October 2014) IF-3.022 ISSN: (2321-1717)
-1 -1 1 1 1 -1 0.9215 3.55 1.22 45
1 -1 1 1 1 -1 0.9243 3.56 2.08 45.8
-1 1 1 1 1 -1 0.9218 3.55 1.25 44
1 1 1 1 1 -1 0.9215 3.55 2.3 43.5
-1 -1 -1 -1 -1 1 0.9155 3.54 1.02 45.3
1 -1 -1 -1 -1 1 0.9155 3.54 1.98 44.5
-1 1 -1 -1 -1 1 0.9168 3.54 0.99 44
1 1 -1 -1 -1 1 0.9181 3.54 2.01 43
-1 -1 1 -1 -1 1 0.9188 3.54 0.35 43.5
1 -1 1 -1 -1 1 0.9188 3.54 1.4 43
-1 1 1 -1 -1 1 0.9182 3.54 1.1 42.5
1 1 1 -1 -1 1 0.9175 3.54 1.73 43
-1 -1 -1 1 -1 1 0.9201 3.54 0.65 47
1 -1 -1 1 -1 1 0.9215 3.44 1.78 46.5
-1 1 -1 1 -1 1 0.9282 3.54 0.56 45
1 1 -1 1 -1 1 0.9265 3.45 1.8 44.5
Xan: Xanthan gum; Pec: Pectin; Gur: Guar gum; Sug: Sugar; CA Citric acid; Glu: Glucose powder; Wa: Water
[image:10.595.67.529.68.265.2]activity; V: Viscosity
Table 4b. Central composite design arrangement and experimental results for the response variables of fruit ripple premix base
Independent Variable Responses
Xan Pec Gur Sug CA Glu WA pH V
(Pa.S)
TSS (0Brix)
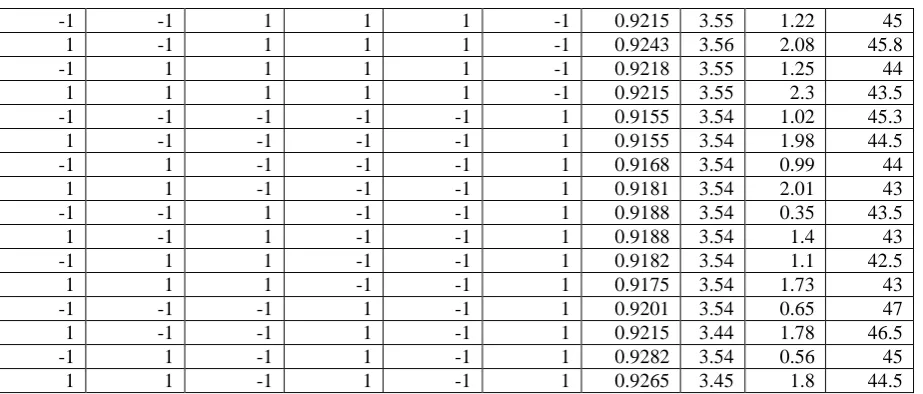
-1 -1 1 1 -1 1 0.9215 3.55 0.5 46.5
1 -1 1 1 -1 1 0.9218 3.54 1.78 46.7
-1 1 1 1 -1 1 0.93 3.54 0.98 45
1 1 1 1 -1 1 0.9281 3.45 1.79 44
-1 -1 -1 -1 1 1 0.9186 3.31 1.1 46
1 -1 -1 -1 1 1 0.9182 3.31 2.2 45
-1 1 -1 -1 1 1 0.9181 3.32 1.01 44
1 1 -1 -1 1 1 0.9185 3.3 2.18 43
-1 -1 1 -1 1 1 0.9155 3.31 1.5 45.5
1 -1 1 -1 1 1 0.92 3.3 2.5 45
-1 1 1 -1 1 1 0.9155 3.31 1.18 44
1 1 1 -1 1 1 0.9166 3.3 2.5 43
-1 -1 -1 1 1 1 0.9215 3.31 0.5 46.9
1 -1 -1 1 1 1 0.9218 3.31 1.78 46.5
-1 1 -1 1 1 1 0.922 3.3 0.99 44
1 1 -1 1 1 1 0.9215 3.31 1.92 43.5
-1 -1 1 1 1 1 0.923 3.31 0.79 46.53
1 -1 1 1 1 1 0.9215 3.31 1.85 46.07
-1 1 1 1 1 1 0.92 3.31 0.78 43.5
1 1 1 1 1 1 0.9215 3.3 1.67 43.1
-2.8284 0 0 0 0 0 0.9218 3.25 0.8 46
2.82843 0 0 0 0 0 0.9199 3.25 2.9 45.5
0 -2.8284 0 0 0 0 0.9198 3.25 1.1 46.5
0 2.82843 0 0 0 0 0.9199 3.25 1.26 43.3
0 0 -2.8284 0 0 0 0.92 3.25 1.32 44
0 0 2.82843 0 0 0 0.9201 3.25 1.41 42.22
GE-INTERNATIONAL JOURNAL OF ENGINEERING RESEARCH
VOLUME -2, ISSUE -8 (October 2014) IF-3.022 ISSN: (2321-1717)
0 0 0 2.82843 0 0 0.93 3.39 0.51 47.77
0 0 0 0 -2.8284 0 0.93 4.45 1.01 44
0 0 0 0 2.82843 0 0.9198 3.5 1.26 44.53
0 0 0 0 0 -2.8284 0.9197 3.76 2.38 45.25
0 0 0 0 0 2.82843 0.9196 3.46 0.68 44.82
0 0 0 0 0 0 0.9154 3.54 1.7 46
Xan: Xanthan gum; Pec: Pectin; Gur: Guar gum; Sug: Sugar; CA Citric acid; Glu: Glucose powder; Wa: Water
activity; V: Viscosity
The magnitude of F value in the Table 5 indicated that the linear terms of process
variables xanthan gum (P ≤ 0.001), citric acid (P ≤ 0.05) had a significantly positive effect
while sugar (P ≤ 0.001), and glucose (P ≤ 0.001) had a significantly negative effect on the
response variable of fruit ripple premix base. Viscosity of the fruit ripple premix base was
observed to be affected positively by the interaction between pectin-guar gum (P ≤ 0.05) and
sugar-glucose (P ≤ 0.001) while interaction between sugar-citric acid (P≤ 0.05) had a
significantly negative effect. Further it was observed that the viscosity of fruit ripple premix
base increased with increase in concentration of xanthan gum, pectin, guar gum (figure 2, 3,
4). Change in viscosity with respect to the increase in concentration of gums is in agreement
with the results reported by Basu and Shivhare, (2010), Ahmed et. al. (2005), Agudelo et. al.
(2014) for modified waxy corn starch; and Chantaro and Pongsawatmanit, (2010) for a
[image:11.595.69.533.473.698.2]mixture of tapioca starch and xanthan gum.
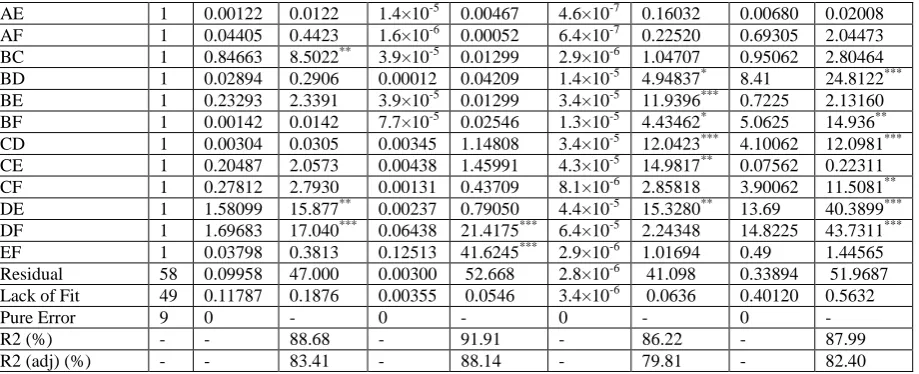
Table 5: Analysis of variance (ANOVA) showing the linear, quadratic interaction and the lack of fit of the response variables of fruit ripple premix base
Source of variation DF Response variables
Viscosity pH WA TSS
Mean Square
F value Mean Square
F value Mean Square
F value Mean Square
F value
Regression Model 27 1.6761 16.832*** 0.07332 24.3889*** 3.8×10⁻⁵ 13.4431*** 5.33481 15.7394*** A 1 18.0507 181.27*** 0.00561 1.86645 1.1×10⁻⁵ 0.3744 1.94507 5.73859* B 1 0.178 1.7875 0.00028 0.09355 4.5×10⁻⁵ 1.56835 36.2490 106.946*** C 1 0.23475 2.3574 0.00015 0.05031 1.5×10⁻⁵ 5.35221* 16.5935 48.9561*** D 1 8.09691 81.312*** 0.05137 17.0901*** 0.00044 156.596*** 6.28817 18.5521*** E 1 0.64946 6.5221** 0.57071 189.834*** 4.7×10⁻⁵ 16.6093*** 1.32588 3.91178 F 1 12.3146 123.66*** 0.19785 65.8129*** 4.1×10⁻⁷ 0.14377 8.98887 26.5200*** A2 1 0.18097 1.8174 0.14485 48.1835*** 5.2×10⁻⁵ 18.4087*** 0.12273 0.36211 B2 1 0.20674 2.0761 0.14485 48.1835*** 3.5×10⁻⁵ 12.3294** 2.15173 6.34831* C2 1 0.04481 0.4499 0.14485 48.1835*** 3.8×10⁻⁵ 13.4481** 14.5785 43.0114*** D2 1 2.6×10⁻⁵ 0.0002 0.10335 34.3790*** 0.00016 56.6147*** 0.09263 0.27330 E2 1 0.26399 2.6511 0.32689 108.732*** 0.00015 55.4482*** 5.29461 15.6208** F2 1 2.6×10⁻⁵ 0.0002 0.00851 2.83290 3.2×10⁻⁵ 11.2592** 1.66293 4.90618*
GE-INTERNATIONAL JOURNAL OF ENGINEERING RESEARCH
VOLUME -2, ISSUE -8 (October 2014) IF-3.022 ISSN: (2321-1717)
AE 1 0.00122 0.0122 1.4×10⁻⁵ 0.00467 4.6×10⁻⁷ 0.16032 0.00680 0.02008 AF 1 0.04405 0.4423 1.6×10⁻⁶ 0.00052 6.4×10⁻⁷ 0.22520 0.69305 2.04473 BC 1 0.84663 8.5022** 3.9×10⁻⁵ 0.01299 2.9×10⁻⁶ 1.04707 0.95062 2.80464 BD 1 0.02894 0.2906 0.00012 0.04209 1.4×10⁻⁵ 4.94837* 8.41 24.8122*** BE 1 0.23293 2.3391 3.9×10⁻⁵ 0.01299 3.4×10⁻⁵ 11.9396*** 0.7225 2.13160 BF 1 0.00142 0.0142 7.7×10⁻⁵ 0.02546 1.3×10⁻⁵ 4.43462* 5.0625 14.936** CD 1 0.00304 0.0305 0.00345 1.14808 3.4×10⁻⁵ 12.0423*** 4.10062 12.0981*** CE 1 0.20487 2.0573 0.00438 1.45991 4.3×10⁻⁵ 14.9817** 0.07562 0.22311 CF 1 0.27812 2.7930 0.00131 0.43709 8.1×10⁻⁶ 2.85818 3.90062 11.5081** DE 1 1.58099 15.877** 0.00237 0.79050 4.4×10⁻⁵ 15.3280** 13.69 40.3899*** DF 1 1.69683 17.040*** 0.06438 21.4175*** 6.4×10⁻⁵ 2.24348 14.8225 43.7311***
EF 1 0.03798 0.3813 0.12513 41.6245*** 2.9×10⁻⁶ 1.01694 0.49 1.44565 Residual 58 0.09958 47.000 0.00300 52.668 2.8×10⁻⁶ 41.098 0.33894 51.9687 Lack of Fit 49 0.11787 0.1876 0.00355 0.0546 3.4×10⁻⁶ 0.0636 0.40120 0.5632
Pure Error 9 0 - 0 - 0 - 0 -
R2 (%) - - 88.68 - 91.91 - 86.22 - 87.99
[image:12.595.72.532.71.258.2]R2 (adj) (%) - - 83.41 - 88.14 - 79.81 - 82.40
Table 6: Estimated regression coefficients of the fitted second-order polynomial for the response variables in fruit ripple premix base
Coefficients Estimated coefficients
Viscosity pH Water
Activity
Total Soluble Solids
β0 1.82 3.54 +0.92 45.99
β1 0.48
-8.375×10
-3
1.153×10⁻⁴ -0.16
β2 0.047
-1.875×10
-3
2.360×10⁻⁴ -0.67
β3 0.054
-1.375×10
-3
4.360×10⁻⁴ -0.46
β4 -0.32 0.025 2.359×10⁻³ +0.28
β5 0.090 -0.084 7.681×10⁻⁴ 0.13
β6 -0.39 -0.050 7.146×10⁻⁵ -0.34
β11 0.040 -0.036 6.883×10⁻⁴ -0.033
β22 -0.043 -0.036 5.633×10⁻⁴ -0.14
β33 -0.020 -0.036 5.883×10⁻⁴ -0.36
β44 -004 -0.031 1.207×10⁻³ -0.029
β55 -0.049 0.054 1.195×10⁻³ -0.22
β66 4.819×10
-4 8.782×10
-3 5.383×10
-4
-0.12
β12
-4.703×10
-1.094×10
-3 1.094×10
-4
GE-INTERNATIONAL JOURNAL OF ENGINEERING RESEARCH
VOLUME -2, ISSUE -8 (October 2014) IF-3.022 ISSN: (2321-1717)
Increase in concentration of citric acid in the fruit ripple premix base causes decrease in pH
whbich ultimatley increases the viscosity (Figure 2) and the change in viscosity with increase
in citric acid is in full agreement wth the results reported by Basu and Shivhare, (2010) and
Agudelo et. al. (2014), with modified waxy corn starch. Viscosity decreases with increase in
pH due to replacement of methyl groups from pectin structure with H+ ions, leading to reduced inter-chain repulsion. This condition facilitates easy binding of pectin with sugar,
leading to denser network formation and increased viscosity. Higher pH results in greater
3
β13 -0.013
-2.031×10
-3
7.812×10⁻⁵ 0.037
β14 9.078×10
-3
-1.563×10
-4
1.125×10⁻⁴ 0.058
β15 4.359×10
-3 4.687×10
-4 8.437×10
-5
-0.010
β16 0.026 1.562×10
-4
-1.000×10⁻⁴ -0.10
β23 0.12
-7.813×10
-4
-2.156×10⁻⁴ 0.12
β24 0.021
-1.406×10
-3
4.687×10⁻⁴ -0.36
β25 -0.060
-7.813×10
-4
-7.281×10⁻⁴ -0.11
β26
-4.703×10
-3
-1.094×10
-3
4.437×10⁻⁴ -0.28
β34
-6.891×10
-3
7.344×10
-3
7.312×10⁻⁴ 0.25
β35 0.057 -8.281×10
-3
-8.156×10⁻⁴ -0.034
β36 0.066 4.531×10
-3 -3.563×10
-4
0.25
β45 -0.16 6.094×10
-3
-8.250×10⁻⁴ -0.46
β46 0.16 -0.032 3.156×10⁻⁴ 0.48
GE-INTERNATIONAL JOURNAL OF ENGINEERING RESEARCH
VOLUME -2, ISSUE -8 (October 2014) IF-3.022 ISSN: (2321-1717)
inter-chain repulsion, less dense network formation, and reduced viscosity (Basu and
[image:14.595.67.537.107.694.2]Shivhare, 2010).
Figure 2: Effect of citric acid and pectin on the viscosity of fruit ripple premix base
Figure 3: Effect of glucose and guar gum on the viscosity of fruit ripple premix base
Figure 4: Effect of sugar and xanthan gum on the viscosity of fruit ripple premix base
GE-INTERNATIONAL JOURNAL OF ENGINEERING RESEARCH
VOLUME -2, ISSUE -8 (October 2014) IF-3.022 ISSN: (2321-1717)
Figure 6: Effect of sugar and xanthan gumon the TSS of fruit ripple premix base
Figure 7: Effect of citric acid and sugar on the pH of fruit ripple premix base
Viscosity of fruit ripple premix base decreased with an increase in concentration of
sugar and glucose powder (Figure 3, 4) and the same trend is reported by Basu and Shivhare,
(2010), Pichler et. al. (2012) and Wei et. al. (2001). Viscosity of fruit ripple premix base decreased with increase in the sugar concentration at all pH levels and hydrocolloids
concentrations. The reason for change in viscosity with respect to sugar/glucose powder is
that the gums forms a network of fibrils with water, and sugar acts as a dehydrating agent
which can disturb the equilibrium existing between water and pectin. The barrier to
self-association of pectin chains into gel junctions is intermolecular electrostatic repulsion
between charged carboxyl groups in pectin/ gums, and polymeric pectin–water interactions
acting in competition with polymer–polymer interactions. Progressive increase in sugar
concentration partially reduces the water available in pectin–sugar–acid mix and thus reduces
the chance of formation of hydrogen bonds and other possible association of water with
polymeric pectin chain. Sucrose provides additional hydroxyl groups to stabilize the structure
of junction zones and promote hydrogen bonds to immobilize free water. However, this
phenomenon can be predicted up to a certain level of sugar concentration (i.e. 60%). Higher
sucrose concentrations (65% to 70%), however, weakenes the pectin gel network. It appears,
therefore, that the water shortage and the enhanced hydrogen bonding between the polyhydric
sucrose and remaining water molecules destabilized the rigid pectin gel network above a
sugar concentration of 60%. As the amount of sugar increased above 60%, more amount of
water was released in ripple and thereby makingthe rippleless viscous (Basu and Shivhare,
2010). Same results were obtained by Agudelo et. al. (2014) with modified waxy corn starch
and tapioca starch, Chantaro and Pongsawatmanit, (2010) with tapioca starch and xanthan
gum mixture, Martínez-Cervera et. al. (2014) and by Alzamora (1997, 1998).
The magnitude of F (Table 5) indicated that xanthan gum, pectin, and guar gum had a
significantly negative effect while sugar and glucose powder had a significantly positive
effect on total soluble solids of fruit ripple premix base. Quadratic terms of pectin, guar gum,
citric acid and glucose had a significant effect on TSS. Total soluble solids increased as the
GE-INTERNATIONAL JOURNAL OF ENGINEERING RESEARCH
VOLUME -2, ISSUE -8 (October 2014) IF-3.022 ISSN: (2321-1717)
of xanthan gum, pectin and guar gum (Figure 5, 6). The pattern of change in TSS values was
also reported by Jane and Onweluzo (1999) and by Alzamora (1997, 1998).
pH of the fruit ripple premix base increased as the concentration of sugar increased
(Figure 7) and the same was observed by Pichler et al. (2012). While, the coefficient value of
linear term citric acid was negative this justified that any increase in value of citric acid will
decrease the pH. Same results were obtained by Young et. al. in 2003, Jane and Onweluzo
(1999) and by Alzamora (1997, 1998). Water activity of fruit ripple premix base was not
affected significantly by the change in the concentration of the variables.
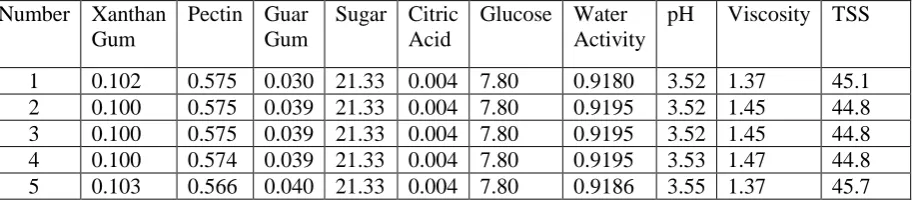
3.1.3 Optimization of stabilizer, acidity regulator and sugar level for preparation of fruit ripple premix base and its verification from RSM: The compromised optimum condition for the development of fruit ripple premix base was determined using Design expert Software
(DX 6). Compromised optimum conditions criteria applied for numerical technique
optimization was taken maximum for sugar, glucose powder concentration to achieve
maximum TSS, and minimum in the response of Wa, pH and viscosity. The compromised
optimum conditions obtained for the development of fruit ripple premix base are depicted in
Table 7. It was found that there was very less deviation in calculated values of responses and
the predicted values for compromised optimum solution no 1 (Table 8) and hence was
finalised. The optimum formulation of fruit ripple premix base was then used to produce
[image:16.595.73.530.486.588.2]mango fruit ripple premix using RSM.
Table 7: Compromised optimum conditions for fruit ripple premix basegiven by RSM
Number Xanthan Gum
Pectin Guar Gum
Sugar Citric Acid
Glucose Water Activity
pH Viscosity TSS
1 0.102 0.575 0.030 21.33 0.004 7.80 0.9180 3.52 1.37 45.1 2 0.100 0.575 0.039 21.33 0.004 7.80 0.9195 3.52 1.45 44.8 3 0.100 0.575 0.039 21.33 0.004 7.80 0.9195 3.52 1.45 44.8 4 0.100 0.574 0.039 21.33 0.004 7.80 0.9195 3.53 1.47 44.8 5 0.103 0.566 0.040 21.33 0.004 7.80 0.9186 3.55 1.37 45.7
Table 8: Comparison of response values given by RSM and actually calculated values for fruit ripple premix base
Sr N o
Viscosity pH TSS Water activity
RS M Actua l Deviatio n RS M Actua l Deviatio n RS M Actua l Deviatio n
RSM Actual Deviatio n
1 1.37 1.03 0.34 3.52 3.53 0.01 45.1 46.00 0.90 0.918 0
0.911 1
GE-INTERNATIONAL JOURNAL OF ENGINEERING RESEARCH
VOLUME -2, ISSUE -8 (October 2014) IF-3.022 ISSN: (2321-1717)
2 1.45 1.85 0.40 3.52 3.51 0.01 44.8 45.7 0.90 0.919 5
0.915 6
0.0039
3 1.45 1.86 0.41 3.52 3.54 0.02 44.8 46.3 1.50 0.919 5
0.964 7
0.0452
4 1.47 1.82 0.35 3.53 3.57 0.04 44.8 45.3 0.50 0.919 5
0.964 7
0.0452
5 1.37 1.93 0.56 3.55 3.58 0.03 45.7 47.5 1.80 0.918 6
0.916 7
0.0019
3.2. Optimization level of fruit ripple premix base, mango fruit powder, mango titbit,
mango flavour and color level for preparation of mango fruit ripple premix
3.2.1 Model fitting: The effects of fruit ripple premix base, mango fruit powder, mango fruit titbits, mango powder flavour and colour on viscosity (V) and sensory attributes (colour,
flavour, texture and overall acceptability) of mango fruit ripple premix are shown in Table 9.
The independent and dependent variables were fitted to the second-order model equation and
examined for the goodness of fit and results showed that the models for all the response
variables were highly adequate with R2 of more than 80%. The regression coefficients
(Table 10) and the equations for each of the response variables could be derived from the
predicted values of each response variable. The R2 values of all of the responses exceeded 80% indicating a high proportion of variability hence the developed response surface models
were found adequate.
The magnitude of F value (Table 10) indicated that linear terms of process variables
fruit ripple premix base (P ≤ 0.001) showed a significant positive effect. Further quadratic
term of fruit ripple premix base (P ≤ 0.001) and of mango fruit powder (P >0.05) had a
significantly positive and negative effect respectively on viscosity of mango fruit ripple.
Viscosity of the fruit ripple was not affected significantly (P ≤ 0.05) by the interaction
between fruit ripple premix base-mango fruit powder and mango fruit powder-colour.
Viscosity of the fruit ripple increased with increase in concentration of fruit ripple premix
base (Figure 8) and was in agreement in the results observed in 3.1.2. Viscosity was also
found to be increased with increase in concentration of the mango fruit powder but the effect
was not significant. Mango fruit ripple was added with dehydrated fruit produced for
confectionery application which were found to have uniform particle size which could
consequently control the viscosity of the ripple. The variability of ripple viscosity could be
due to the fruit titbits and powders, resulting in a variation in particle sizes (Miquelim et. al.,
GE-INTERNATIONAL JOURNAL OF ENGINEERING RESEARCH
VOLUME -2, ISSUE -8 (October 2014) IF-3.022 ISSN: (2321-1717)
Colour acceptability of the mango fruit ripple premix was significantly affected by
linear terms (Table 10) of process variables mango fruit powder (P ≤ 0.05) and colour (P ≤
0.001) which had a significantly positive and negative effect respectively. From Figure 9, it
can be concluded that the colour should be optimum for maximum colour acceptability of the
[image:18.595.69.541.211.700.2]mango fruity ripple.
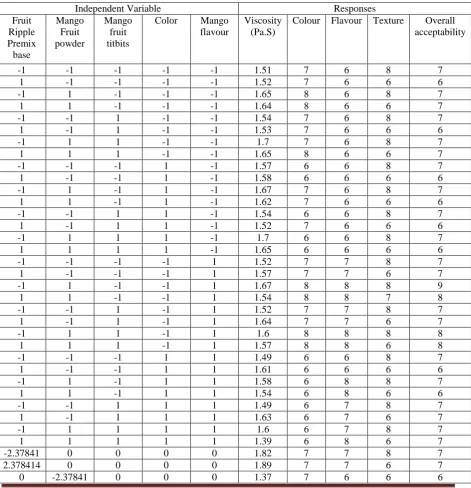
Table 9: Central composite design arrangement and experimental results for the response variables of Mango fruit ripple premix
Independent Variable Responses
Fruit Ripple Premix base Mango Fruit powder Mango fruit titbits
Color Mango flavour
Viscosity (Pa.S)
Colour Flavour Texture Overall acceptability
-1 -1 -1 -1 -1 1.51 7 6 8 7
1 -1 -1 -1 -1 1.52 7 6 6 6
-1 1 -1 -1 -1 1.65 8 6 8 7
1 1 -1 -1 -1 1.64 8 6 6 7
-1 -1 1 -1 -1 1.54 7 6 8 7
1 -1 1 -1 -1 1.53 7 6 6 6
-1 1 1 -1 -1 1.7 7 6 8 7
1 1 1 -1 -1 1.65 8 6 6 7
-1 -1 -1 1 -1 1.57 6 6 8 7
1 -1 -1 1 -1 1.58 6 6 6 6
-1 1 -1 1 -1 1.67 7 6 8 7
1 1 -1 1 -1 1.62 7 6 6 6
-1 -1 1 1 -1 1.54 6 6 8 7
1 -1 1 1 -1 1.52 7 6 6 6
-1 1 1 1 -1 1.7 6 6 8 7
1 1 1 1 -1 1.65 6 6 6 6
-1 -1 -1 -1 1 1.52 7 7 8 7
1 -1 -1 -1 1 1.57 7 7 6 7
-1 1 -1 -1 1 1.67 8 8 8 9
1 1 -1 -1 1 1.54 8 8 7 8
-1 -1 1 -1 1 1.52 7 7 8 7
1 -1 1 -1 1 1.64 7 7 6 7
-1 1 1 -1 1 1.6 8 8 8 8
1 1 1 -1 1 1.57 8 8 6 8
-1 -1 -1 1 1 1.49 6 6 8 7
1 -1 -1 1 1 1.61 6 6 6 6
-1 1 -1 1 1 1.58 6 8 8 7
1 1 -1 1 1 1.54 6 8 6 6
-1 -1 1 1 1 1.49 6 7 8 7
1 -1 1 1 1 1.63 6 7 6 7
-1 1 1 1 1 1.6 6 7 8 7
1 1 1 1 1 1.39 6 8 6 7
-2.37841 0 0 0 0 1.82 7 7 8 7
2.378414 0 0 0 0 1.89 7 7 6 7
GE-INTERNATIONAL JOURNAL OF ENGINEERING RESEARCH
VOLUME -2, ISSUE -8 (October 2014) IF-3.022 ISSN: (2321-1717)
0 2.378414 0 0 0 1.56 7 6 7 7
0 0 -2.37841 0 0 1.57 7 7 7 7
0 0 2.378414 0 0 1.57 7 7 7 7
0 0 0 -2.37841 0 1.6 7 7 7 7
0 0 0 2.378414 0 1.57 6 7 6 7
0 0 0 0 -2.37841 1.53 7 6 6 6
0 0 0 0 2.378414 1.58 7 8 6 7
0 0 0 0 0 1.58 8 8 8 9
Quadratic terms of mango fruit ripple premix had signifcantly negative effect on
colour acceptability of mango fruit ripple, which suggested that the model is quadratic. The
interaction term fruit powder-colour powder (P ≤ 0.05) had a significant negative effect on
the colour acceptability of the mango fruit ripple. In case of colour acceptability of the
experimental samples, same results were also reported by Bugaud et. al. (2013) and Igual et.
[image:19.595.18.573.348.699.2]al. (2014).
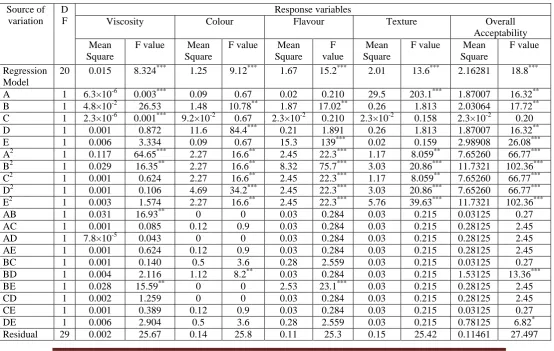
Table 10: ANOVA showing the linear, quadratic interaction and the lack of fit of the response variables for mango fruit ripple premix.
Source of variation
D F
Response variables
Viscosity Colour Flavour Texture Overall
Acceptability Mean
Square
F value Mean Square
F value Mean Square
F value
Mean Square
F value Mean Square
F value
Regression Model
20 0.015 8.324*** 1.25 9.12*** 1.67 15.2*** 2.01 13.6*** 2.16281 18.8***
A 1 6.3×10⁻⁶ 0.003*** 0.09 0.67 0.02 0.210 29.5 203.1*** 1.87007 16.32**
B 1 4.8×10⁻² 26.53 1.48 10.78** 1.87 17.02** 0.26 1.813 2.03064 17.72**
C 1 2.3×10⁻⁶ 0.001*** 9.2×10⁻² 0.67 2.3×10⁻² 0.210 2.3×10⁻² 0.158 2.3×10⁻² 0.20
D 1 0.001 0.872 11.6 84.4*** 0.21 1.891 0.26 1.813 1.87007 16.32**
E 1 0.006 3.334 0.09 0.67 15.3 139*** 0.02 0.159 2.98908 26.08***
A2 1 0.117 64.65*** 2.27 16.6** 2.45 22.3*** 1.17 8.059** 7.65260 66.77***
B2 1 0.029 16.35** 2.27 16.6** 8.32 75.7*** 3.03 20.86*** 11.7321 102.36***
C2 1 0.001 0.624 2.27 16.6** 2.45 22.3*** 1.17 8.059** 7.65260 66.77***
D2 1 0.001 0.106 4.69 34.2*** 2.45 22.3*** 3.03 20.86*** 7.65260 66.77***
E2 1 0.003 1.574 2.27 16.6** 2.45 22.3*** 5.76 39.63*** 11.7321 102.36***
AB 1 0.031 16.93** 0 0 0.03 0.284 0.03 0.215 0.03125 0.27
AC 1 0.001 0.085 0.12 0.9 0.03 0.284 0.03 0.215 0.28125 2.45
AD 1 7.8×10⁻⁵ 0.043 0 0 0.03 0.284 0.03 0.215 0.28125 2.45
AE 1 0.001 0.624 0.12 0.9 0.03 0.284 0.03 0.215 0.28125 2.45
BC 1 0.001 0.140 0.5 3.6 0.28 2.559 0.03 0.215 0.03125 0.27
BD 1 0.004 2.116 1.12 8.2** 0.03 0.284 0.03 0.215 1.53125 13.36***
BE 1 0.028 15.59** 0 0 2.53 23.1*** 0.03 0.215 0.28125 2.45
CD 1 0.002 1.259 0 0 0.03 0.284 0.03 0.215 0.28125 2.45
CE 1 0.001 0.389 0.12 0.9 0.03 0.284 0.03 0.215 0.03125 0.27
DE 1 0.006 2.904 0.5 3.6 0.28 2.559 0.03 0.215 0.78125 6.82*
GE-INTERNATIONAL JOURNAL OF ENGINEERING RESEARCH
VOLUME -2, ISSUE -8 (October 2014) IF-3.022 ISSN: (2321-1717)
Lack of Fit 22 0.002 0.063 0.18 1.81 0.14 1.45 0.19 1.987 0.15107 1.478
Pure Error 7 - - - -
R2 (%) - - 85.17 - 86.28 - 91.27 - 90.53 - 92.86
R2(adj) (%)
- - 74.94 - 76.82 - 85.25 - 84.00 - 87.94
*Significant at P≤0.05; **significant at P≤0.01; *** significant at P≤0.001; DF = degree of freedom
Flavour accpetability of the mago fruit ripple was observed to increase signifciantly
with increase in linear term of mango fruit powder and mango fruit flavour. Flavour
accpetability of the mango fruit ripple was also increased with an increase in fruit ripple
premix base and may be contibuted to the presence of suger as it affects the consumer
perception towards flavour acceptrability (Figure 10). Same results for flavour acceptability
were also obtained by Gan et. al. (2007), Bugaud et. al. (2013) and by Igual et. al. (2014). Texture of the mango fruit ripple was observed to be affected significantly affected by fruit
ripple premix base and was observed to decrease with increase in level of the premix base.
The effect may be contributed to the gums and stabilisers which increases the viscosity and
ultimately affecting the texture (Figure 11) and the results are in conjunction with Ünal et. al.
(2003) in case of set yoghurt and by Fernandez et. al. (2007), Pichler et. al. (2012), Bugaud
(2013) and by Igual et. al. (2014).
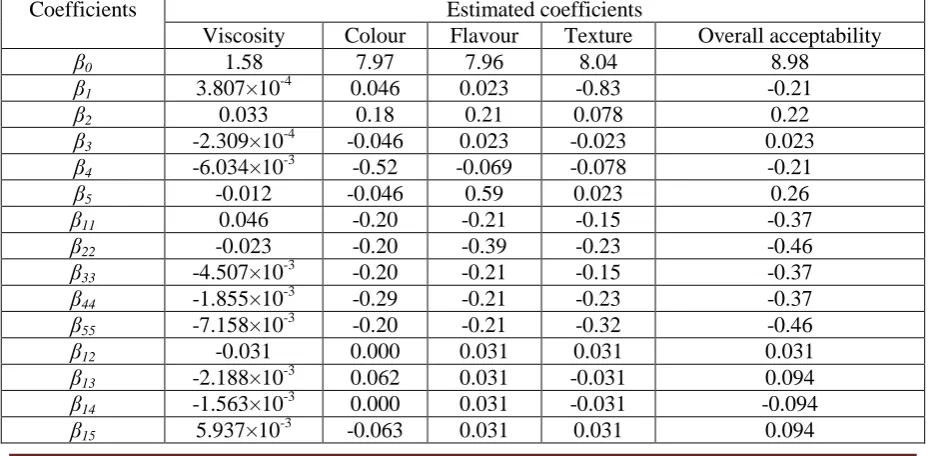
Table 11: Estimated regression coefficients of the fitted second-order polynomial for the response variables for mango fruit ripple premix
Coefficients Estimated coefficients
Viscosity Colour Flavour Texture Overall acceptability
β0 1.58 7.97 7.96 8.04 8.98
β1 3.807×10
-4
0.046 0.023 -0.83 -0.21
β2 0.033 0.18 0.21 0.078 0.22
β3 -2.309×10
-4
-0.046 0.023 -0.023 0.023
β4 -6.034×10
-3
-0.52 -0.069 -0.078 -0.21
β5 -0.012 -0.046 0.59 0.023 0.26
β11 0.046 -0.20 -0.21 -0.15 -0.37
β22 -0.023 -0.20 -0.39 -0.23 -0.46
β33 -4.507×10
-3
-0.20 -0.21 -0.15 -0.37
β44 -1.855×10
-3
-0.29 -0.21 -0.23 -0.37
β55 -7.158×10
-3
-0.20 -0.21 -0.32 -0.46
β12 -0.031 0.000 0.031 0.031 0.031
β13 -2.188×10
-3
0.062 0.031 -0.031 0.094
β14 -1.563×10
-3
0.000 0.031 -0.031 -0.094
β15 5.937×10
-3
[image:20.595.66.533.469.697.2]GE-INTERNATIONAL JOURNAL OF ENGINEERING RESEARCH
VOLUME -2, ISSUE -8 (October 2014) IF-3.022 ISSN: (2321-1717)
β23 -2.813×10
-3
-0.13 -0.094 -0.031 -0.031
β24 -0.011 -0.19 0.031 -0.031 -0.22
β25 -0.030 0.000 0.28 0.031 0.094
β34 -8.438×10
-3
0.000 0.031 0.031 0.094
β35 -4.688×10
-3
0.062 0.031 -0.031 0.031
β45 -0.013 -0.13 -0.094 -0.031 -0.16
Addition level of mango fruit powder and mango fruit flavour increased the overall
acceptability of mango fruit ripple significantly (Table 10), while fruit ripple premix base and
colour showed a negative effect. The entire quadratic term fruit ripple premix base had an
significantly negative effect on overall acceptability of fruit ripple, suggesting the model to
be quadratic. The interactions of mango fruit powder and colour (P ≤ 0.001) and colour and
mango fruit flavour (P ≤ 0.05) had significant negative effect on the overall acceptability of
the mango fruit ripple. Other interaction terms were not significant (P > 0.05). According to
Figures 12 and 13, it was observed that fruit ripple premix base, mango fruit powder, mango
flavour and colour affected the overall acceptability of mango fruit ripple more positively.
Fruit ripple premix consists of sugar and glucose powder which increases the consumer
acceptance and the same results were obtained by Basu and Shivhare, (2010) and by
Fernandez et. al. (2007), Bugaud et. al. (2013) and by Igual et. al. (2014).
3.2.2 Effect of process variables on responses of mango fruit ripple premix: The effect of different amounts of fruit ripple premix base, mango powder, mango titbits, mango flavour
and colour on responses viz., viscosity and sensory attributes of phase mango fruit ripple
premix are reported in Table 11 with the coefficient of second order polynomials. To improve
the understanding, the response surfaces for these response variables are shown in Figures
GE-INTERNATIONAL JOURNAL OF ENGINEERING RESEARCH
VOLUME -2, ISSUE -8 (October 2014) IF-3.022 ISSN: (2321-1717)
Figure 8: Effect of fruit powder and premix base on the viscosity of mango fruit ripple
Figure 9: Effect of colour powder and fruit titbits on the colour acceptability of mango fruit ripple
Figure 10: Effect of flavour powder and fruit powder on the flavour acceptability of mango fruit ripple
[image:22.595.67.536.61.520.2]GE-INTERNATIONAL JOURNAL OF ENGINEERING RESEARCH
VOLUME -2, ISSUE -8 (October 2014) IF-3.022 ISSN: (2321-1717)
Figure 12: Effect of fruit powder and premix base on the overall acceptability of mango fruit ripple
Figure 13: Effect of flavour powder and colour powder on the overall acceptability of mango fruit ripple
3.2.3 Optimization of basic formulation and verification of mango fruit ripple premix: The compromised optimum condition for the development of mango fruit premix was determined
using Design expert Software (DX 6) with a optimum condition criteria of maximum
(colour, flavour, texture and overall acceptability), and viscosity targeted to 1.16 Pas (Table
12). The calculated values of responses and the predicted values for compromised optimum
solutions given by RSM, are tabulated in Table 13. There was very less deviation in
calculated values of responses and the predicted values for compromised optimum solution
[image:23.595.65.535.66.292.2]no 1 which was the finalised optimum solution.
Table 12: Compromised optimum conditions for mango fruit ripple premix given by RSM
No. Premix Fruit powder
Fruit titbits
Color powder
Flavour powder
Colour Flavour Texture Overall Accep tability
Viscosity
1 27.01 15.44 2.00 0.005 0.016 8.05349 8.17598 8.18621 8.54918 1.63 2 27.00 15.57 2.00 0.005 0.016 8.05695 8.1635 8.17102 8.53325 1.63
3 27.00 15.19 2.00 0.005 0.016 8.03826 8.18542 8.2137 8.561 1.63
4 27.00 15.30 1.99 0.005 0.016 8.0468 8.18184 8.20232 8.55663 1.63 5 27.00 15.72 2.00 0.005 0.016 8.06471 8.14008 8.16171 8.5244 1.64
Table 13: Comparison of response values given by RSM and actually calculated values for mango fruit ripple premix
[image:23.595.73.531.516.618.2]GE-INTERNATIONAL JOURNAL OF ENGINEERING RESEARCH
VOLUME -2, ISSUE -8 (October 2014) IF-3.022 ISSN: (2321-1717)
r N o
acceptability RS
M Act
.
Dev. RS M
Ac t.
Dev. RSM Act. Dev. RS M
Act. Dev. RSM Act. Dev.
1 8 7 1 8 7 1 8 6 2 9 8 1 1.63 1.67 0.04
2 8 6 2 8 6 2 8 6 2 9 6 3 1.63 1.49 0.14
3 8 7 1 8 6 2 8 6 2 9 6 3 1.63 1.40 0.23
4 8 6 2 8 6 2 8 6 2 9 6 3 1.63 1.50 0.13
5 8 6 2 8 6 2 8 6 2 9 6 3 1.64 1.53 0.11
Act. = Actual; Dev. = Deviation
3.3. Physicochemical properties of mango fruit ripple premix base and Control mango fruit
ripple
Once the optimum formulation of mango fruit ripple premix was determined, they
were used to produce mango fruit ripple and was compared with control mango ripple in
respect to sensory attributes, rheological, physico-chemical and nutritional characteristics.
pH, TSS and water activity of the mango fruit ripple premix and Control mango fruit
ripple was measured for freshly prepared and freeze thawed samples. From Table 14 it is
observed that there is very less difference between physicochemical characteristics of control
mango ripple and mango ripple prepared from mango fruit ripple premix. As compared to
freshly prepared sample of mango ripple from mango fruit premix base, freeze thawed
sample showed an increase in viscosity and total soluble solids while decrease in pH and
water activity. The reason for decrease in the water content of the mango ripple might be
attributed to the gums and stabilisers as they would have used up the water available in the
system for their full activation. Nutritional values of the developed mango ripple from mango
fruit ripple premix base and other physicochemical properties are depicted in Table 15.
Table 14: pH, TSS and Wa values of mango fruit ripple premix newly and Control mango fruit ripple
Ripple Sample Viscosity at 10
0
C
(Pa.s) pH
TSS
(0 Brix) Wa
Mango fruit ripple premix: Freshly prepared 0.902 4.20 45 0.97
Mango fruit ripple premix: Freeze thaw 2.06 4.05 53.5 0.92
Control mango fruit ripple: Freshly prepared 1.62 3.85 51 0.95
[image:24.595.67.520.68.184.2]Control mango fruit ripple: Freeze thaw 2.34 3.70 60 0.92
[image:24.595.79.517.561.647.2]GE-INTERNATIONAL JOURNAL OF ENGINEERING RESEARCH
VOLUME -2, ISSUE -8 (October 2014) IF-3.022 ISSN: (2321-1717)
Properties gm/100 gm of mango
fruit ripple premix
Energy
Kcal/100 gm of mango fruit ripple premix
Fat 0.27 2.43
Protein 1.04 4.16
Carbohydrate 91.36 365.44
Sugar 87.18
Total energy 372.03
Total moisture 4.25
Total ash 3.07
3.4 Sensory analysis of mango fruit ripple premix base and Control mango fruit ripple
Average scores of sensory attributes in respect of Colour, flavour, texture and overall
acceptability of mango fruit ripple prepared with newly formulated mango fruit premix and
control mango fruit ripple are reported in Figure 14.
Figure 14: Sensory acceptability to consumers of mango fruit ripple prepared from premix and control mango fruit ripple. Dark grey bars: Control mango ripple, White bars: Mango ripple prepared from newly developed mango fruit ripple premix
The overall acceptability scores ranged between 6.4 and 7.8 and 7 and 8 respectively.
In general, the overall acceptability score was comparable to control mango ripple.
4. Conclusion
The fruit ripple premix for bakery and confectionary applications like fillings and
toppings etc is a little studied subject. RSM is a useful tool in formulation and optimisation of
the basic formulation of mango fruit ripple premix by partial differentiating the empirical
model with respect to each parameter, equating to zero and simultaneously solving the
[image:25.595.152.448.322.432.2]GE-INTERNATIONAL JOURNAL OF ENGINEERING RESEARCH
VOLUME -2, ISSUE -8 (October 2014) IF-3.022 ISSN: (2321-1717)
premix base was consisting of 0.102 gm (Xanthan gum), 0.575 gm (Pectin), 0.030 (Guar
gum), 21.33 gm (Sugar), 0.004 gm (Citric acid) and 7.80 gm (Glucose powder). The
optimised fruit ripple premix base can be used for manufacturing of mango fruit ripple
premix by adding mango fruit powder (15.44 gm), mango fruit tit bits (2 gm), color (0.005
gm) and mango flavour powder (0.016 gm) to 27.01 gm of fruit ripple premix base.
References
1. Agudelo, A., Varela, P., Sanz, T. and Fiszman, S. M. (2014), “Native tapioca starch as
a potential thickener for fruit fillings- Evaluation of mixed models containing
low-methoxyl pectin”. Food Hydrocolloids, Vol 35 pp. 297-304.
2. Ahmed, J., Ramaswamy, H. S. and Ngadi, M. O. (2005), “Rheological
Characteristics of Arabic Gum in Combination With Guar and Xanthan Gum Using
Response Surface Methodology: Effect of Temperature and Concentration”.
International Journal of Food Properties. Vol. 8 pp. 179–192.
3. Alzamora, S. N. (1997), “Effect of pH, Temperature and Glucose Addition on Flow
Behaviour of Fruit Purees I. Banana Puree”. Journal of food engineering. Vol. 33 pp.
239-256.
4. Alzamora, S. N. (1998), “Effect of pH, Temperature and Glucose Addition on Flow
Behaviour of Fruit Purees: II. Peach, Papaya and Mango Purres”. Journal of food
engineering. Vol. 37 pp. 71-101.
5. AOAC International (2000), “Official Methods of Analysis”.17th ed. AOAC Int.,
Gaithersbersburg, MD.
6. Basu, S. and Shivhare, U. S. (2010), “Rheological, textural, micro-structural and
sensory properties of mango jam”. Journal of Food Engineering. Vol. 100 pp. 357–
365.
7. Bugaud, C., Cazevieille, P., Daribo M., Telle, N., Julianus, P., Fils-Lycaon, B. and
Mbéguié-A-Mbéguié, D. (2013), “Rheological and chemical predictors of texture and
taste in dessert banana (Musa spp.). Postharvest Biology and Technology. Vol. 84 pp.
GE-INTERNATIONAL JOURNAL OF ENGINEERING RESEARCH
VOLUME -2, ISSUE -8 (October 2014) IF-3.022 ISSN: (2321-1717)
8. Cano-Higuita, D. M., Villa-Véleza, H. A., Telis-Romeroa, J., Váquirob, H. A. and
Telisa, V. R. N. (2013), “Influence of alternative drying aids on watersorption of
spray dried mango mix powders:A thermodynamic approach”. Food and Bioproducts
Processing. In-press.
9. Chantaro, P. and Pongsawatmanit, R. (2010), “Influence of sucrose on thermal and pasting
properties of tapioca starch and xanthan gum mixtures”. Journal of Food Engineering. Vol. 98 pp. 44-50.
10.Fernndez, P. P., Martino, M. N., Zaritzky, N. E., Guignon, B. and Sanz, P.D. (2007),
“Effects of locust bean, xanthan and guar gums on the ice crystals of a sucrose
solution frozen at high pressure”. Food Hydrocolloids. Vol. 21 pp. 507-515.
11.Gan, H.E., Karim, R., Muhammad, S. K. S., Bakar, J. A., Hashim, D. M. Rahman, R.
A. (2007), “Optimization of the basic formulation of a traditional baked cassava cake
using response surface methodology”. LWT- Food Science and Technology. Vol. 40
pp. 611-618.
12.Igual, M., Contreras, C. and Martínez-Navarretea, N. (2014), “Colour and rheological
properties of non-conventional grapefruit jams: Instrumental and sensory
measurement”. LWT - Food Science and Technology. Vol. 56 pp. 200-206.
13.Jane, C. and Onweluzo, M. R. (1999). “Detarium Microcarpum Polysaccharide as a
Stabilizer in Processed Fruit Products”. Lebensm.-Wiss. u.-Technology. Vol. 32 pp.
521-526.
14.L'homme, C., Puigserver, A. and Biagini, A. (2003), “Effect of food-processing on
the degradation of fructooligosaccharides in fruit”. Food Chemistry, Vol. 82
pp.533-537.
15.Louarme, L and Billaud, C. (2012), “Evaluation of ascorbic acid and sugar
degradation products during fruit dessert processing under conventional or ohmic
heating treatment”. LWT - Food Science and Technology. Vol. 49 pp. 184-187.
16.Miquelim, J. N. Alcântara, M. A. and da Silva Lannes, S. C. (2011), “Stability of
fruit bases and chocolate fillings”. Ciência e Tecnologia de Alimentos. Vol. 31 pp.
GE-INTERNATIONAL JOURNAL OF ENGINEERING RESEARCH
VOLUME -2, ISSUE -8 (October 2014) IF-3.022 ISSN: (2321-1717)
17.Pichler, A. Pozderović, A. and Pavlović, J. (2012), “Influence of Sugars, Modified Starches, and Hydrocolloids Additions on the Rheological Properties of Raspberry
Cream Filling”. J. Food Sci. Vol. 30 pp. 227-235.
18.Raghuramulu, N. M. (1983), “A manual of Laboratory Techniques”. National journal
of Nutrition.
19.Sandra Martínez-Cervera, Salvador, A. and Sanz, T. (2014), “Comparison of different
polyols as total sucrose replacers in muffins: Thermal, rheological, texture and
acceptability properties”. Food Hydrocolloids. Vol. 35 pp. 1-8.
20.Ünal, B., Metin, S. and Işıkl, N. D (2003). “Use of response surface methodology to
describe the combined effect of storage time, locust bean gum and dry matter of milk
on the physical properties of low-fat set yoghurt”. International Dairy Journal. Vol. 13 pp. 909-916.
21. Wei, Y. P., Wang, C. S. and Wu, J. S. B. (2001), “Flow properties of fruit fillings”. Food Research International. Vol. 34 pp. 377-381.
22.Young, N. W. G., Kappel, G., and Bladt, T. A. (2003), “Polyuronan blend giving
novel synergistic effects and bake-stable functionality to high soluble solids fruit