A STUDY ON THE ASSOCIATION OF BRAND AWARENESS AND BRAND IMAGE WITH SPECIAL REFERENCE OF PACKAGED MILK IN CHENNAI CITY
Mrs. C. T. Neena Mary,1 Research Scholar
Department of Commerce, S.I.V.E.T College, Gowrivakkam ,Chennai-73.
Dr R Rethina Bai,2 Research Supervisor
Asst prof in Commerce, S.I.V.E.T College,
ABSTRACT
Brand awareness is the familiarity about the availability of the product. Consumers associate the brand with a specific product. It includes both brand recognition and as well as brand recall. Brand awareness is improved to the extent that brand names are selected and are very easy to remember. Building brand awareness is essential for brand equity, to create brand awareness we should have brand image thereby achieving high sales and high market share. In this research study the researcher focuses on a large sample of one thousand and hundred and sixty six consumers is taken and brand awareness and brand image and analyzed through primary data. Various analyses are studied on, Mean and standard deviation, and hypothesis testing using student t test, F test anova and also Friedman test results are also computed.
Key Words: Brand Awareness, Brand Image, consumer behavior, consumers International Research Journal of Management and Commerce
ISSN: (2348-9766)
Impact Factor 5.564 Volume 5, Issue 1, January 2018
Website- www.aarf.asia, Email : [email protected] , [email protected]
I INTRODUCTION:
The importance of brand awareness in the mind of the consumers can be evaluated at various stages like recognition, recalling, topof the mind and brand knowledge. Brand awareness influences consumers perceived risk assessment and their confidence in the purchase intentions and enhances brand awareness. The image of the brand is ultimately the key factor that determines the product sales, and also the beliefs and views about that particular brand.
1.1 NEED OF THE STUDY
Brand awareness andBrand Image towards packaged milk directly impacts consumer behaviour and hence top brands have a strong and positive image in the minds of the consumer. It also gives confidence and sincerity and a very clear vision in the market. Therefore it makes it essential and important for the researcher to study about Brand awareness andBrand Image towards packaged milk in Chennai.
1.2 OBJECTIVES OF THE STUDY
1. To study the brand awareness by recalling from his mind and strong brand image of
the product
2. To determine the impact of brand image and brand awareness on a particular brand through hypothesistesting.
3. To identify the relationship between Brand awareness andBrand Image towards packaged milk.
4. To analyze the mean ranks of Brand awareness andBrand Image towards packaged milk.
II. REVIEW OF LITERATURE
Keller’s (1998)has analysed the role of brand awareness in building brand equity. It was depend on the strength of the brands presence in the consumer’s mind. The level of awareness induced brand recall and recognition. The high level of brand awareness had a considerable impact on the marketing productivity which determined the prospects of brand and being considered as future purchase situations.
Rong Huang, and EmineSarigollu (2012) has examined that the relation between brand awareness and market outcome and explored the relation between brand awareness and brand equity. The study results revealed that consumers’ brand usage experiences had contributed in brand awareness. The results also confirmed that positive association between brand awareness and brand equity. Hence, the price and promotion were influenced on creating the brand awareness of the consumer-packaged goods.
Kim and Kim (2004)have analysed the four elements of brand equity such as brand awareness, brand image, brand loyalty and perceived quality. The study results identified that brand awareness had the strongly influence on revenues, when brand loyalty had the least effect. Hence, brand awareness showed the smallest effect on brand equity than the other dimensions such as brand image, brand loyalty and product quality.
Faircloth, Capella and Alford (2001)have focused on the effect of brand attitude and brand image on brand equity. The study results indicated that brand equity was influenced by brand association or signals to consumers and that these associations influenced in brand image and attitude towards brand equity. The effects of brand attitudes and brand image were essential factors in building brand equity
Aaker (1996)has focused on the brand equity under five major categories such as brand loyalty, perceived quality, differentiation awareness, and market behaviour. Each of these five dimensions were further subdivided into ten specific measurements as a means by which market planners can develop a system to evaluate the equity or brand. He recommended for constructing a summary measure based on the importance of the dimensions for a given brand in a competitive situation.
Keller (2001)hasdeveloped the customer-based brand equity (CBBE) model to assist management in their brand-building efforts. According to this model, the strong brand building involves four steps. They are: (1) establishing the proper brand identity for establishing breadth and depth of brand awareness, (2) creating the appropriate brand meaning through strong, favorable, and unique brand associations, (3) eliciting positive, accessible brand responses, and (4) forging brand relationships with customers that are characterized by intense, active loyalty. Achieving these four steps, in turn, involves establishing six brand-building blocks—brand salience, brand performance, brand imagery, brand judgments, brand feelings, and brand resonance.
Kim, Kim and An (2003)havefocused on the brand equity and its effect on financial performance of hotels. The results indicated that brand loyalty, perceived quality and brand image were important components of brand equity. The result depicted that brand loyalty, perceived quality and brand image were established the customer-based brand equity.
AnupRanaware (2009) has analysed the consumers’ preference towards the packaged milk brands. The study identified that the advertisement and shopkeeper were the most important factors for the brand awareness. Hence, the majority of the consumers were preferred Amul as their regular brand in Andhra, Mumbai.
III RESEARCH METHODOLOGY 3.1 Research Design:
The investigator has chosen the “Descriptive Research” design and also inferential analysis which best suits to the present study.
3.2 Population:
The population of the present study consists of consumers in chennai and it is found to be more of infinite in nature, therefore, the unit of population is difficult to measure in the study.
3.3 Sampling Design:
For the present study, the investigation has selected both simple random sampling and convenience sampling technique.
3.4 Sample Size:
The sample consists of one thousand and one hundred and sixty six consumers from Chennai which include students, employed persons (male & female), housewives, educated, unemployed, self-employed etc.
3.5 Data Collection Method
Primary and secondary data were collected and used in evaluating the objectives of this present study. Primary data are collected fresh from the consumers for the very first time and happens to attain originality. With the help of the pre tested questionnaire, the researcher was able to collect and gather information relevant for the primary data. The secondary data were collected through books/magazines, journals, websites and company records
[image:4.612.110.519.394.467.2]3.6 Reliability and Validity
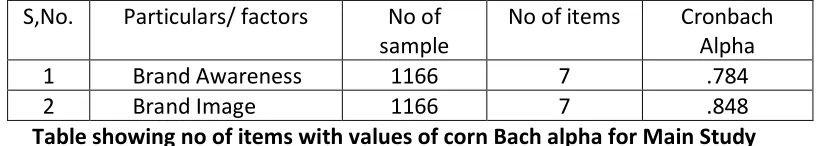
Table showing no of items with values of corn Bach alpha for Main Study
In the present study, the researcher has chosen cronbach’s Alpha reliability test. Since the cronbach alpha value for brand awareness was .784 and Brand image was .848 it had satisfied the r value = 0.7, therefore the test proves reliable and valid.
IV DATA ANALYSIS AND INTERPRETATION
Differences between two groups in the mean score of variables are studied using consumer behaviour test are discussed in this section.To prove in an analytical manner mean deviation and standard deviation and various tests like t-test, F-test using ANOVA tests are followed by Friedman test using Duncan Multiple Range Test (DMRT) are used.
Table 4.1 Mean and SD of Brand awareness and Brand Image towards Packaged Milk
Consumer Behaviour Mean SD
S,No. Particulars/ factors No of sample
No of items Cronbach Alpha
1 Brand Awareness 1166 7 .784
Brand Awareness 28.91 3.91
Brand Image 29.12 4.13
From the above Table 4.1Based on the variables mean score of brand image has (29.12), followed by Brand awareness which has a mean score of (28.91) .
HYPOTHESIS I
Null Hypothesis: There is no significant difference between Male and Female with respect to Factors of Consumer Behaviour of Packaged Milk
Tables 4.2 t test for significant difference between Male and Female with respect to Brand awareness and Brand Image of Packaged Milk
Factors of Consumer
Behaviour
Gender
t value P value
Male Female
Mean SD Mean SD
Brand Awareness 28.62 4.01 29.02 3.86 1.569 0.117
Brand Image 28.77 4.49 29.25 3.98 1.763 0.078
There is no significant difference between male and female consumers with regard to brand awareness, brand image, since P value is greater than 0.05. Hence null hypothesis is accepted at 5% level of significance with regard to brand awareness, brand image,
HYPOTHESIS II
Null Hypothesis: There is no significant difference between Married and Unmarried with respect to Factors of Consumer Behaviour of Packaged Milk
Tables 4.3 t test for significant difference between Married and Unmarried with respect to Brand awareness and Brand Image of Packaged Milk
Factors of
Consumer Behaviour
Marital Status
t value P value Married Unmarried
Mean SD Mean SD
Brand Awareness 29.04 3.92 28.57 3.85 1.836 0.067
Brand Image 29.31 4.13 28.59 4.11 2.645 0.008**
Note: 1. ** denotes significant at 1% level
regard to the opinion of packaged milk married consumers wanted a brand image for the product they buy and also have a mentality to repurchase than unmarried consumers.
.
There is no significant difference between married and unmarried consumers with regard to brand awareness, , since P value is greater than 0.05. Hence null hypothesis is accepted at 5% level of significance with regard to brand awareness, Both married and unmarried consumers are aware of the factors on consumer behaviour and take their right decision in purchasing packaged milk.
HYPOTHESIS III
Null Hypothesis: There is no significant difference between Joint and Nuclear families with respect to factors of Consumer Behaviour of Packaged Milk
Table 4.4 t test for significant difference between Joint and Nuclear families with respect to Brand awareness and Brand Image of Packaged Milk
Factors of Consumer Behaviour
Type of family
t value P value
Joint Nuclear
Mean SD Mean SD
Brand Awareness 29.24 3.89 28.78 3.91 1.796 0.073
Brand Image 29.59 3.99 28.94 4.17 2.397 0.017*
Note: 1.. * denotes significant at 5% level
Since P value is less than 0.05 the null hypothesis is rejected at 5% level with regard to brand image. Hence there is significant difference between joint and nuclear type of family members with respect to brand image. Based on mean scores joint family consumers have better opinion than nuclear family consumers. Joint family consumers are likely to be more focused depending on number of members in their household with regard to brand image. There is no significant difference between joint family members and nuclear family consumers with regard to brand awarenesssince P value is greater than 0.05. Hence null hypothesis is accepted at 5% level of significance with regard to brand awarenessBoth Joint and Nuclear family consumers give more importance to the above factors of consumer behaviour in deciding to purchase packaged milk.
HYPOTHESIS IV
Null Hypothesis: There is no significant difference between Vegetarian and Non- Vegetarian with respect to Factors of Consumer Behaviour of Packaged Milk
Tables 4.5 t test for significant difference betweenVegetarian and Non- Vegetarian with respect to Brand awareness and Brand Image of Packaged Milk
Factors of Consumer Behaviour
Type of food habit
Non-Vegetarian
Mean SD Mean SD
Brand Awareness 29.08 4.09 28.86 3.85 0.799 0.424
Brand Image 29.49 4.37 29.01 4.06 1.661 0.097
There is no significant difference between vegetarian and non-vegetarian consumers with regard to brand awareness, brand image, since P value is greater than 0.05. Hence null hypothesis is accepted at 5% level of significance with regard to brand awareness, brand image, Vegetarian type of food habits consumers give more importance to the above factors of consumer behaviour in deciding to purchase packaged milk.
HYPOTHESIS V
Null Hypothesis: There is no significant difference among Age Group with respect to Factors of Consumer Behaviour of Packaged Milk
Tables 4.6 ANOVA for significant difference among Age Group with respect to Brand awareness and Brand Image of Packaged Milk
Factors of Consumer
Behaviour
Age Group in years
F value P value Below
30 31-40 41-50
Above 50
Brand Awareness 28.72
(3.95)
29.11 (3.84)
28.80 (3.92)
29.09
(3.93) 0.796 0.496
Brand Image 28.66
a
(4.25)
29.47b (4.07)
29.10ab (4.07)
29.43b
(4.03) 2.697 0.045*
Note: 1. The value within bracket refers to SD 2. * denotes significant at 5% level
3 .Different alphabet among Age Groups denotes significant at 5% level using Duncan Multiple Range Test (DMRT)
Since P value is less than 0.05 the null hypothesis is rejected at 5% level with regard tobrand image. Hence there is significant difference among Age group of consumers with respect to Brand image. Based on Duncan Multiple Range Test (DMRT) below 30 years is significantly differed with 30-40 years and above 50 years at 5 % level but there is no significant difference between below 30 years, 30-40 years and 40-50 years and also 40-50 years and above 50 years in Brand image among consumers. All Consumers above 30 years are satisfied with their brand and also have an image for their packaged milk.
There is no significant difference between Age group of consumers with regard to brand awareness, since P value is greater than 0.05. Hence null hypothesis is accepted at 5% level with regard to brand awareness,
HYPOTHESIS VI
Tables 4.7 ANOVA for significant difference among Educational Qualifications with respect to Brand awareness and Brand Image of Packaged Milk
Factors of Consumer
Behaviour
Educational Qualification
F
value P value Upto
HSc UG PG Professional
Brand Awareness 29.10
(3.85)
29.14 (3.90)
28.67 (3.91)
28.44
(3.97) 1.887 0.130
Brand Image 28.79
(4.21)
29.34 (4.04)
28.99 (4.27)
29.30
(3.99) 1.203 0.307
Note: 1. The value within bracket refers to SD
3. Different alphabet among Educational Qualifications denotes significant at 5% level Using Duncan Multiple Range Test (DMRT)
There is no significant difference between Educational qualifications of consumers with regard to brand awareness, brand image, since P value is greater than 0.05. Hence null hypothesis is accepted at 5% level of significance with regard to brand awareness, brand image
HYPOTHESIS VII
Null Hypothesis: There is no significant difference among mean ranks of Factors of Consumer Behaviour towards packaged Milk
Tables 4.8 Friedman test for significant difference among mean ranks of Brand awareness and Brand Image towards packaged Milk
Factors of Consumer
Behaviour Mean Rank P value
Brand Awareness 3.68
< 0.001**
Brand Image 3.86
Note: ** Denotes significant at 1% Level
Since P value is less than 0.01, the null hypothesis is rejected at 1 percent level of significance. Hence concluded that there is significant difference among mean ranks towards overall factors of consumer behaviour of packaged milk.. Based on mean ranks consumers should have the intention to purchase which is having a mean score brand image 3.86 and brand awareness 3.68 because they don’t give much importance to use a brand which they have experienced.
V RESULTS FINDINGS AND CONCLUSION
There is no significant difference between male and female consumers with regard to brand awareness, brand image, Hence null hypothesis is accepted at 5% level of significance
Since P value is less than 0.01 the null hypothesis is rejected at 1% level with regard to Brand image, Hence there is a significance difference between married and unmarried respondents with respect to, Brand Image of packaged milk.
There is no significant difference between married and unmarried consumers with regard to brand awareness, , since P value is greater than 0.05. Hence null hypothesis is accepted at 5% level of significance
Since P value is less than 0.05 the null hypothesis is rejected at 5% level with regard to brand image. Hence there is significant difference between joint and nuclear type of family members with respect to brand image. Based on mean scores joint family consumers have better opinion than nuclear family consumers.
There is no significant difference between joint family members and nuclear family consumers with regard to brand awarenesssince P value is greater than 0.05. Hence null hypothesis is accepted at 5% level of significance Both Joint and Nuclear family consumers give more importance to the above factors of consumer behaviour in deciding to purchase packaged milk.
There is no significant difference between vegetarian and non-vegetarian consumers with regard to brand awareness, brand image, since P value is greater than 0.05. Hence null hypothesis is accepted at 5% level of significance with regard to brand awareness, brand image, Vegetarian type of food habits consumers give more importance to the above factors of consumer behaviour in deciding to purchase packaged milk.
Since P value is less than 0.05 the null hypothesis is rejected at 5% level with regard tobrand image. Hence there is significant difference among Age group of consumers with respect to Brand image. Based on Duncan Multiple Range Test (DMRT) below 30 years is significantly differed with 30-40 years and above 50 years at 5 % level but there is no significant difference between other groups in Brand image among consumers. All Consumers above 30 years are satisfied with their brand and also have an image for their packaged milk.
There is no significant difference between Age group of consumers with regard to brand awareness, since P value is greater than 0.05. Hence null hypothesis is accepted at 5% level with regard to brand awareness,
There is no significant difference between Educational qualifications of consumers with regard to brand awareness, brand image, since P value is greater than 0.05. Hence null hypothesis is accepted at 5% level of significance with regard to brand awareness, brand image
Since P value is less than 0.01, the null hypothesis is rejected at 1 percent level of significance. Hence concluded that there is significant difference among mean ranks towards overall factors of consumer behaviour of packaged milk.Based on mean ranks consumers should have the intention to purchase which is having a mean score brand image 3.86 and brand awareness 3.68 because they don’t give much importance to use a brand which they have experienced.
LIMITATIONS OF THE STUDY:
subject to change according to the perception and opinion of the respondents, and some of the respondents were hesitant to give responses.
Some individuals refused to respond to the research questionnaire, as they were unwilling to participate.
The researcher had also time constraint in filling the questionnaire.
CONCLUSION:
There is a strong relationship between brand awareness and brand image towards purchasing packaged milk. It was also analysed that consumer behaviour gets increased when these dimensions got increased. Brand awareness about selected different brands of milk gave an insight of their establishments in the market. Brand Image kept consumers to recall on top of their mind. Today’s market is consumer oriented therefore it is important to concentrate on consumer behaviour and plan marketing strategies accordingly.
“BRAND ASSOCIATIONS CREATES THE MARKET.”
References:
1. Keller’s (1998) Strategic Brand Management: Building measuring and managing Brand
Equity, Prentice, Hall, and New Jersey. The IUP Journal of Brand Management, Vol.8 (3),
Sep (2011).
2. Rong Huang, EmineSarigollu (2012), brand equity, and the marketing mix, Journal of Business Research,Vol.65(1),January2012,pp.92-99.
3. Bravo Gil R., E. Fraj Andres, E. Martínez Salinas (2007), “Family as a Source of Consumer-Based Brand Equity”, Journal of Product & Brand Management, Vol.16 (3), pp. 188 – 199.
4. Woo Gon Kim, Hong-Bumm Kim (2004), “Measuring Customer-Based Brand Equity”, Cornell Hotel and Restaurant Administration Quarterly, Vol. 45 (2), pp. 115 – 131.
5. James B Faircloth, Louis M Capella, Bruce L Alford (2001), “The Effect of Brant Attitude and Brand Image on Brand Equity”, Journal of Marketing Theory and Practice, Vol. 9 (3), pp. 61 – 75.
6. Aaker, David.A, (1996), “Measuring Brand Equity Across Products and Markets”, California Management Review, Vol. 38 (3), pp. 102-120.
7. Kevin Lane Keller (2001), “Building Customer-Based Brand Equity: A Blue Print for Creating Strong Brands”, Report No. 01-107, Marketing Science Institute.
8. Kim, Hong-Bumm, Woo Gon Kim, and JeongA.An. (2003), “The Effect of Consumer-Based Brand Equity on Firms’ Financial Performance”, Journal of Consumer Marketing, Vol. 20 (4) pp. 335 – 351.
9. Hong-BummKim , Woo Gon Kim (2005), “The Relationship Between Brand Equity and Firms’ Performance in Luxury Hotels and Chain Restaurants”, Tourism Management, Vol. 26 (4), pp. 549-560.
11. Hill..J., Walker, B.J., and Stanton, W.J. 2001. Marketing. Twelfth Edition. Boston: McGraw-Hill.
12. Kotler, P., and Keller, K.L. 2006. Marketing Management. Twelfth Edition. New Jersey: Prentice Hall.
13.Wilkie, W.L. 2000. Consumer Behaviour. Seventh Edition. New York: John Wiley & Sons.