THE STUDY OF DYNAMIC SIMULATION ON PRODUCT DIFFUSION
AND COMPETITION
Te-Tsai Lu
Department of Business Administration, Kun Shan University, Taiwan
Jong-Chen Chen
Department of Information Management, National Yunlin University of Science and
Technology, Taiwan
ABSTRACT
The objective of this study is to investigate product diffusion and competition based on the
theory of innovation diffusion and ant colony theory using the discrete event simulation
technique of artificial world. This study fit the traits with consumer and products to get the
satisfaction and convert diffusion of word-of-mouth and the mass media, and metaphor the
pheromone of ant colony theory. In addition, to produce the behavior of purchase that
consumers based on accumulated pheromone to correspond amount of cumulative possibility.
The model is modified by diffusion model and become the pattern of multiple generation
products diffusion, competition, and experiment. In the competition of dual goods diffusion
experiment, the same product appeared with different results. If the no competitive products
included in the competition experiment of dual goods, two products that gap merchandise in
the original competition in the market to produce dogfight phenomenon. In addition to International Research Journal of Marketing and Economics
ISSN: (2349-0314) Impact Factor- 5.779, Volume 5, Issue 9, September 2018
Website- www.aarf.asia, Email : [email protected] , [email protected]
some useless factors can play the key role of the system. This research is mainly established a
model that can study overall complex phenomenon through a micro-interaction between the
individual consumer.
KEYWORDS: Diffusion Model, Competition, Ant Colony Theory, Artificial World.
INTRODUCTION
The study of product diffusion is one of important issues in marketing. Bass (1969) was
representative study of diffusion. Afterwards, most of study was found of the model, and
import some variable of market or apply in the transnational study or diffusion of multiple
generation products (Nigel and Towhidul, 2006). However, the behavior of product diffusion
actually was a process that individual customer do the most advantageous decision for his
own goal. Customers are an individual that act on their own (Kotler, 1994). They make
strategic decision and actions on their own. In fact, the process of product diffusion is the
aggregation of interaction that individual customer interacts with others and customers
interact with merchandise. For previous study, the whole appearance only can be explained,
yet micro phenomenon.
Hence, the study adopts simulation technique of article world that simulate for
individual level in dynamic way for complex system of product. In other words, all customers
interact with merchandise individually, and customers interact with each other to observe
phenomenon of whole diffusion simulate in decrease by time. The objective of the study is to
adopt the simulation transform the public price that traits of product fit with traits of
consumers. Also, it analogies pheromone of ant colony theory (ACT) by integrate mass
media (Dorigo et al., 1996). Besides, customer produce behavior of purchase by accumulated
pheromone correspond chances of purchase. The model of this study becomes the pattern that
diffusion.
The method of this study that adopt article world is not that emphasize how to react
every module subtly in the real world, but that extract the important performance. It builds
the interaction of every module to observe dynamic behavior and possible consequence in
utilizable way on its own. There are three parts as follows. First of all, background review.
Second, it could be explained by the structure of model and the way of utilization. Also, it
could be experimented three types of experiments by the structure. Finally, the conclusion is
induced by experiment, and the structure of suggestion in the future is proposed.
LITERATURE REVIEW
Bass (1969) is the main pioneer of Diffusion Module in diffusion of marketing. It supposed to
potential receivers of new product is affected in two propagation mode, one is mass media
(Fourt and Woodlock, 1960), and others are only affected by word-of-mouth (WOM)
(Mansfield, 1961). However, it focuses on three parts in the following 25years. First, it bring
market variable. Second, it considers different countries and period. The last one is many
generation diffusion of technique (Nigel and Towhidul, 2006). However, it is a complex
structure in environment that much product and consumers compose marketing (Goldenberg
et al., 2001); the method ignore the process of feedback and cannot be known how to affect
and response in time deferral by the way of cause and effect. Sterman (1989a; 1989b) thinks
that feedback is most important in dynamic and complex circumstances. Goldenberg et al.
(2001) further points that diffusion module and relative survey is an aggregate estimate and
observation rather than individual correlation. We can loosen homogeneity to heterogeneity
for consumers in diffusion module in simulative way. We also see individual supposition or
is one of core study in management and social society. The simulative method of article
world is a method that survey social phenomenon (Terano, 2000). As the above mentioned,
Terano (2000) confer interactive survey of electronic social group. Chen et al. (2002) build an
interactive system that employee and leaders to confer how to get with each other, yet
Dolnicar et al. (2005) thinks that the effect of organization use different market segmentation
to competition.
RESEARCH FRAMEWORK
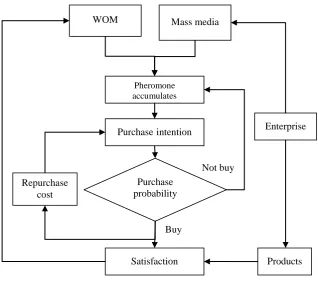
The model is to study product diffusion of competition with the theory of diffusion of
innovation with theory of social vulnerable groups, and the framework as Figure 1.
According to the theory of diffusion of innovation, enterprises affect consumers’ aspiration of
purchase for the first time by mass media and WOM. The study is that analogies pheromone
of ant colony theory (ACT) by integrating mass media and word-of-mouth, and transforms
pheromone into customers’ aspiration of purchase. Besides, pheromone accumulates
gradually, and customers receive transmission of mass media and recommendation of friends
gradually. Information dissemination is like the place that conveys the food location in ACT.
Therefore, accumulated pheromone transforms into purchase probability. Simon and Sebastin
(1987) also think that mass media dissemination accumulated by time.
Furthermore, it further explains the formwork of Figure 1. If consumers decide to buy
it, consumers evaluate satisfaction for product. The way of evaluation is that traits of
consummation compare with difference of product for consumers. The smaller differences are
the higher satisfaction. The meaning is that enterprise's launch of the product meets the needs
of consumers. Higher consumer satisfaction, the more willing to engage in positive
word-of-mouth spread, full of low will spread negative word-of-mouth. Weerahandi and
other words, it can take the way of different character to survey for consumers. Glen and
Cheryl (2005) also claims that the assumption is diffusion of operations-oriented with product
[image:5.595.155.474.130.412.2]attribute rather than exterior market attribute.
Figure 1. The research framework of present study
On the other hand, the module is a type of continuous purchase integrates with
mechanism of purchase at the first time and purchase again. However, after consumers
finished behavior of purchase, the probability of re-purchase is quite low. It means that the
cost of repurchase is the highest, but the cost of repurchase decreases gradually. Therefore,
the cost of repurchase become reduced item of purchase aspiration, and it decreases
aspiration of purchase after purchase finished.
According to the above mentioned the difference of the module and Bass diffusion
module as Figure1. And, the meaning of every framework as follows.
WOM Mass media
Pheromone accumulates
Purchaseintention
Satisfaction
Enterprise
Products Purchase
probability (機率)
Buy
Not buy Repurchase
Table 1. The difference of the Bass model and the model of present study
Bass model The model of present study
Customers differentiae the effect of mass media
dissemination or WOM
Customers affected by mass media
dissemination or WOM
Only estimate potential customers Notes the interaction of single customer It suppose that all customers’ dissemination are
the same
Customers’ word-of-mouth and satisfaction are in positive relationship, and decrease by time
All positive dissemination Exist positive and negative dissemination
Single product diffusion Dual or triple products compete each other
Only analyze purchase at the first time Analyze purchase at the first time and re-purchase at the same time
not consider the suitability of product characters
and customer character
consider the suitability of product characters
and customer character
Customers are homogenous Customers are heterogeneous
The Evaluation of Satisfaction
The evaluation of satisfaction is that every customer evaluates all products according to
customers’ characters. The way of evaluation is that customers receive trait from products fit
preference from previous, customers’ satisfaction is the highest; similarly, the wide the
satisfaction gap and the less the customers’ satisfaction decrease.
We suppose that enterprise release standardized products to summarize the value of fixed
characters that between zeros to one. Every customer all has a fixed consumption characters
that between zeros to one, but customers’ consumption characters are not the same (customer
heterogeneity). It is supposed to a normal distribution. They show a reverse U curve between
consumption satisfactions and marketing stimulation. It means that appropriate marketing
stimulation can increase customers’ satisfaction. On the contrary, excessive stimulation
decreases satisfaction.
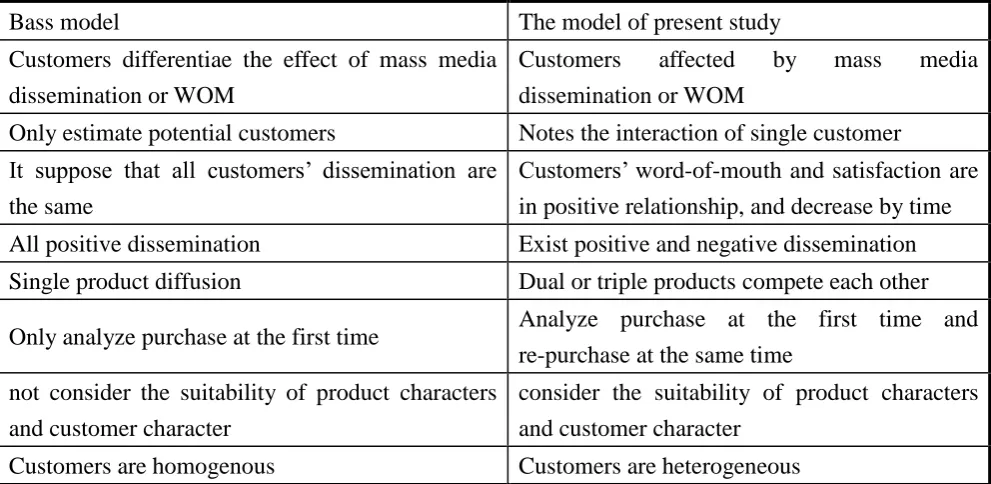
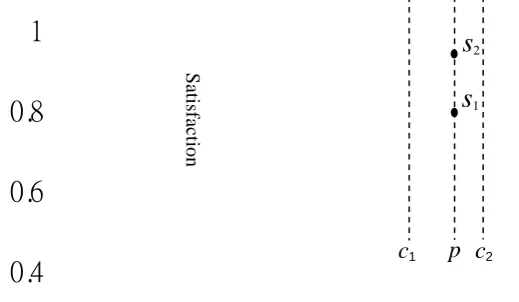
customers. Therefore, every customer has different satisfaction for the same product. We
suppose to the difference between customer traits and product traits. Take examples as (Fig. 2)
those two customers with different average of consumption (c1 and c2). If the trait is P that
enterprises provide, two customers give different satisfaction (S1 and S2).
0
0.2
0.4
0.6
0.8
1
[image:7.595.112.372.160.311.2]traits of consumer and product
Figure 2. The satisfaction of different consumers for the organization traits
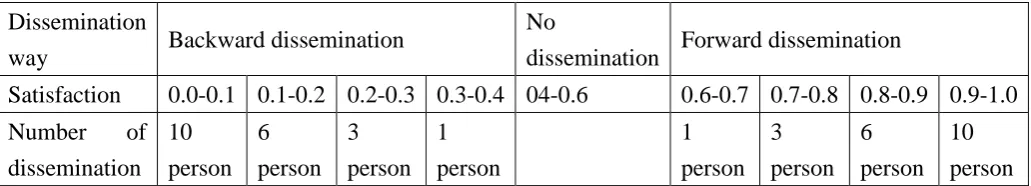
The Pheromone of Dissemination
According to the above the evaluation of satisfaction, every customer that consumed
already give the satisfaction for the product that the value between zeros and one. It is
supposed to customers consume the product; it takes positive dissemination when satisfaction
get high, yet it takes negative dissemination when satisfaction get low. When the satisfaction
doesn’t have obvious change, it doesn’t take dissemination. We set satisfaction 0.5 as
standard, it doesn’t disseminate for 0.4 to 0.6, 0.6 over and above are positive
recommendation, and 0.6 below and under are negative recommendation. Anti-linear
relationship is supposed to the highest number of dissemination and satisfaction as Figure 1.
The number of dissemination is to choose the highest dissemination randomly. For example,
the highest number of dissemination is ten which adopt the number that 0-10 produce
randomly.
p c2
c1
s
2s
1Satis
fac
tio
Table 2. The relationship between satisfaction and the number of dissemination
Dissemination
way Backward dissemination
No
dissemination Forward dissemination
Satisfaction 0.0-0.1 0.1-0.2 0.2-0.3 0.3-0.4 04-0.6 0.6-0.7 0.7-0.8 0.8-0.9 0.9-1.0
Number of
dissemination 10
person 6
person 3
person 1
person
1
person 3
person 6
person 10
person
Furthermore, the survey is supposed to the radical the satisfaction, the more satisfaction,
the more extreme the higher the intensity of the recommended is propagated to the other side
of pheromone. The computing mode of pheromone likes (Fig.1), 0.5 is standard with
satisfaction between 0-1, so the value of disseminated pheromone between -1 to 1. If the
volume is positive number, it’s positive recommendation. On the contrary, it’s negative
number. In other words, it disseminates when satisfaction is high and low. The study is to
adopt the same strength for positive and negative dissemination. Therefore, the strength in the
study may offset each other, but retain the chances of the negative dissemination greater than
positive dissemination in the future.
Ph = 2 (Satisfaction -
0.5)……….………(1)
Pheromone of Mass Media Dissemination
The stronger the strength of mass media dissemination, the more the number of customers
affected. It is to study mass media affect the strength of customers that take the fixed
proportion of potential customers as indication like innovation coefficient in Bass model. For
example, if the strength of customers is 5% which means that there are 5% customers can
accept the information, and customer increase pheromone for the products. The study differ
from Bass model is that the strength of mass media with continuous accumulation is affected
affected by mass media dissemination to decide the customer number of purchase. The
strength is discreet or not. The other viewpoint is that the innovation coefficient in Bass
model is fixed proportion of customers that is not consumed, but the study is proportion of all
customers. Therefore, the strength of mass media dissemination is to disseminate all
customers that already consumed and consumed not yet. The main concept is pheromone for
intensity of mass media dissemination with word-of-mouth. Basically, the degree of mass
media dissemination is tiny than word-of-mouth. Therefore, if take word-of-mouth as one
unit of pheromone, it can set certain percentage for mass media dissemination. For example,
if it set the relationship is 4%, it means that certain customer accept 25 times for mass media
dissemination equal to one times of word-of-mouth dissemination.
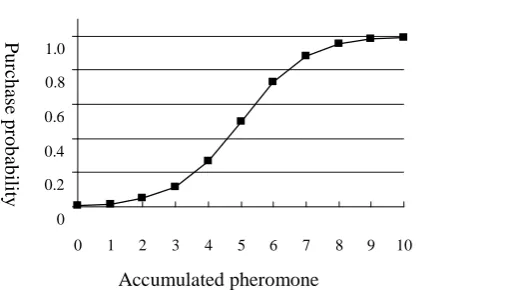
Aspiration of Purchase and Probability of Purchase
One customer’s aspiration of purchase means that the amount of word-of-mouth
pheromone and mass media dissemination pheromone. We take the number of accumulative
pheromone axis as aspiration of purchase (Fig. 4), and take probability as vertical axis. And,
we select sigmoid function to transform it as the formula 2. It is set about the number of 10
pheromone unit achieve the highest aspiration 1.0 for customers. Customers have
accumulative aspiration of purchase for all products, they estimate whether buy or not in this
period, and only choose the highest aspiration of purchase to decide whether buy or not. The
reason of sigmoid function adoption is to explain customers diffuse one unit of praise in
different period in addition to dual-approaching line, and the effect of purchase probability is
different.
…..……….……… (2)
x is accumulated pheromone,f(x) is purchase probability.
x e x
f
5
1 1 )
The strength of mass media dissemination or word-of-mouth fades away by time, and
accumulates continuously every period. Therefore, the concept likes volatilization and
accumulation of pheromone in ACT. Mass media dissemination and word-of-mouth
volatilized and accumulated continuously in the study, and the operational method as formula
(3). Now the study set coefficient of volatilization f to 0.2., and accumulate the fifth period.
i i
t i
t f Ph Ph
Ph (1 )( 1)
………..………. (3)
i
Ph :Consumer receives pheromone for commodity i during this cycle;
i t
Ph :Consumers accumulate pheromones for commodity i at time t;
i t
Ph1:Consumers accumulate pheromones for commodity i at time t-1.
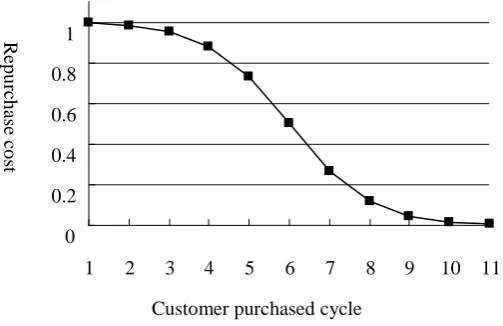
In the circulation of the module, pheromone is accumulated continuously. However,
customers finished the behavior of purchase; the probability of purchase again is very low.
The customer has new aspiration purchase again by time. It is repurchase cost that after
customers purchase certain product, it doesn’t have obstruction of consumption for
repurchase. Repurchase cost decrease by time. The study also adopts sigmoid function that
0 0.2 0.4 0.6 0.8 1.0
0 1 2 3 4 5 6 7 8 9 10
P
u
rch
ase
p
ro
b
ab
ilit
y
Accumulated pheromone
y e y
f
5
[image:10.595.80.336.42.187.2]1 1 1 ) (
modified to simulate formula 4. As formula 4, when certain customer checks to purchase
certain product, the repurchase cost is the highest 1, and then it decrease every period.
………..……….………….(4)
[image:11.595.80.332.205.368.2]Where y is the number of cycles after the purchase; f(y) is the repurchase cost.
Figure 4. Relationship between repurchase cost and customer purchased cycle
CERTIFICATION OF MODEL PARAMETER AND ANALYSIS OF EXPERIMENT
RESULT
According to the above framework of diffusion simulation, first of all, initial parameter
experiment, then to study diffusion for many products in order. In the first step, there is traits
0.5 of products that that one product in the parameter experiment, and customers’ traits take
0.5 as average; and take 0.2 as standard deviation of normal distribution randomly (the reason
mentioned in the previous sections), it total 50,000. First of all, it is continuous mass media
dissemination for five periods and stops it instantly to observe the diffusion of
word-of-mouth. The second step, the study is to find the parameter of experiment that suit
competitive experiment to do the experiment of diffusion for dual-product and tri-product.
0 0.2 0.4 0.6 0.8 1
1 2 3 4 5 6 7 8 9 10 11
Customer purchased cycle
R
ep
u
rch
ase
co
Experiment of Parameter
The study is to comprehend the effect of every important parameter in system simulation
to system expression to acquire accordance of parameter selection in further experiment, and
examine export of the module whether reasonable. The most important parameter is chosen in
three systems as follows: (1) the degree of mass media dissemination strength. (2) The degree
of word-of-mouth. (3) The proportion of mass media dissemination and WOM. It illustrate as
follows.
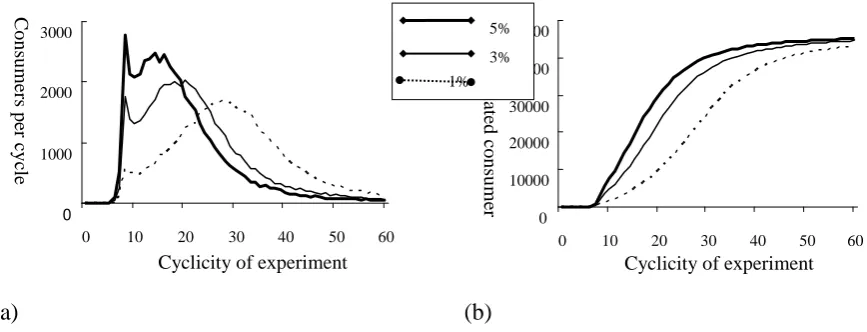
Figure 5 is the experiment of diffusion for mass media dissemination to represent the
strong and weak of effect for affected proportion of mass media dissemination every period,
5%、3%、1% adopted to study dividedly. Figure(a) is the number of consumption every
period,Figure(b) is the number of consumption accumulatively. It is shown that the greater
the strength of mass media dissemination diffuse, the greater diffusion is, and finished all
diffusion in short time with short period of product life. (Figure 5a)The curve of diffusion
likes the curve of bell, yet (Figure 5b) shows the curve of S. The above result is similar with
Bass diffusion model. The peak are formed that after put in public for periods that mass
media dissemination initially. It means that there are more customers try to purchase when
mass media dissemination bring out certain products. However, the following behavior that
people purchase depends on the appearance of the product. On the other hand, it means the
characteristic of commodity whether fit customers’ demand to increase diffusion of
(a) (b)
Figure 5. The study of strong and weak mass media dissemination
The second experiment of parameter is set WOM in 4 units, 2 unit, and 1 unit to represent the
strong, middle, and small strength of WOM. The result of study as Figure 6, the strong the
WOM disseminates, the strong the diffusion is, and finished all diffusion in short time. And,
it is similar to mass media dissemination.
[image:13.595.61.482.366.538.2]
(a) (b)
Figure 6. The study of strong and weak public praise
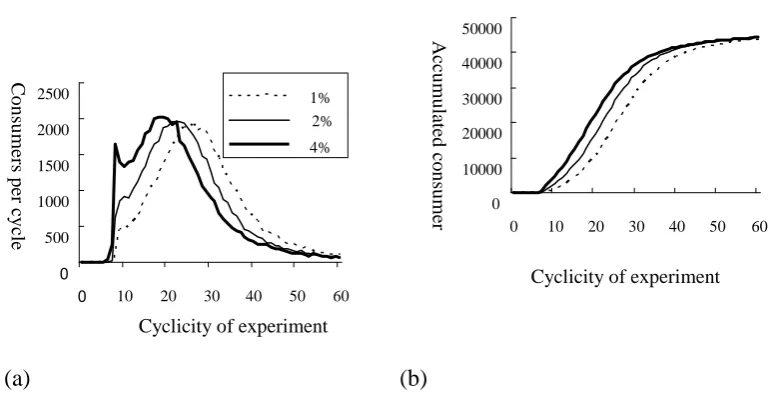
The third experiment of parameter is taking the proportion of mass media dissemination
and WOM as objects. The difference between the first experiments of parameter is that the
first experiment is breadth of marketing, and the third experiment is depth. In other words,
the third experiment is the number of customers affected (the number of receiving
pheromone). Take example in practice, the third one is an advertisement in a publication or
0 10000 20000 30000 40000 50000
0 10 20 30 40 50 60 Cyclicity of experiment
A cc u m u lated co n su m er 0 1000 2000 3000 4000 5000
0 10 20 30 40 50 60 Cyclicity of experiment
1unit 2units 4units C o n su m er s p er cy cle 0 10000 20000 30000 40000 50000
0 10 20 30 40 50 60 Cyclicity of experiment
A cc u m u lated co n su m er 0 1000 2000 3000
0 10 20 30 40 50 60 Cyclicity of experiment
increase the aspiration of purchase in low price, discounts, and sales promotion.
The result of study is figure 7 as follows. There are only has little influence on mass media
dissemination and proportion of WOM for the number of consumption every period.
However, the low the proportion accumulate the long the period of accumulative
consumption saturation. Especially mentioned, we found that the proportion is 1%, the peak
of consumption is not clear. (About the eighth period of Figure 7a). The result illustrate that it
could not be appeared increase of shorten sales volume when the strength of mess media
dissemination comparatively weak to judge the erroneously estimate of selling in the future.
On the other hand, sales have to understand the phenomenon of selling enthusiastically when
the strength of mess media dissemination is comparatively strong, and don’t too optimistic
for the future.
[image:14.595.94.481.356.556.2]
(a) (b)
Figure 7. The proportion experiment of mess media dissemination and public praise
The Experiment of Dual Product Competition Diffusion
The above experiment of parameter is the foundation of following experiment by
selecting the parameter of measurement and comparative value. The effect of mess media
dissemination is 3% every period, WOM is 2 units, and the strength of mess media
dissemination is 4% of WOM. Consumers’ trait is to distribute 50,000 with 0.5 as average,
0 10000 20000 30000 40000 50000
0 10 20 30 40 50 60 Cyclicity of experiment
A
cc
u
m
u
lated
co
n
su
m
er
0 500 1000 1500 2000 2500
0 10 20 30 40 50 60
Cyclicity of experiment 1% 2% 4%
C
o
n
su
m
er
s p
er
cy
and adopt the technique of public sales dissemination in the first five weeks.
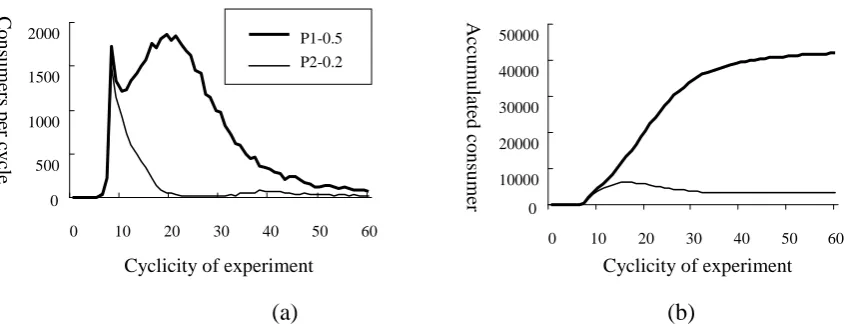
First of all, we do the competition diffusion of dual product. There are three parts to
observe the effect of product traits to diffusion: different product, similar product, same
product. It is supposed that the trait of different product is 0.5 and 0.2. The former product fit
most customers’ trait (customers’ traits is normal distribution of 0.5 averages), yet 0.2
products not fit the product of customers’ demand. On the contrary, similar product adopt the
traits is 0.5 and 0.6. Same product set 0.5 for two competitive product traits. The result of
above three competitive diffusion experiment is Figure 8, Figure 9, and Figure 10.
Figure 8 shows the enterprise that bring out 0.5 products to strive for more customers.
However, after mess media dissemination the 0.2 product, the sale number of the sixth period
and enterprise of 0.5 products instantly, but the number of consumption decreases because
WOM cannot be brig out. If we change product 0.2 into product 0.6 as the result of figure 9
that shows competitiveness of enterprise for the company of 0.6 and 0.5. There are obvious
difference appeared until the fifteenth period with more accumulative number of consumption
than 0.2 products. In the following figures, it explains the reasonable phenomenon of the
product in the module close to the diffusion of consumption traits.
(a) (b)
0 10000 20000 30000 40000 50000
0 10 20 30 40 50 60 Cyclicity of experiment
A
cc
u
m
u
lated
co
n
su
m
er
0 500 1000 1500 2000
0 10 20 30 40 50 60 Cyclicity of experiment
P1-0.5 P2-0.2
C
o
n
su
m
er
s p
er
cy
[image:15.595.56.481.524.691.2][image:16.595.57.479.74.251.2]
(a) (b)
Figure 9. The diffusion experiment of similar products traits compete with each other
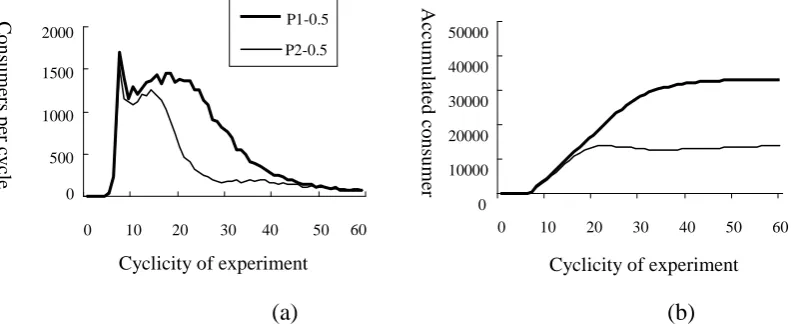
Figure 10 is the result for diffusion competition experiment of two similar product traits.
It is different from general module is that all consumers are not divided equally with victory
or defeat. Due to the module is the whole phenomenon that integrates with interactive
behavior of individual consumer. Therefore, it might be affected by little difference in
individual difference to affect the trend of whole consumption.
[image:16.595.56.460.434.601.2]
(a) (b)
Figure 10. The diffusion experiment of similar products traits compete with each other
The Experiment of Three Product Competition Diffusion
If we increase three competitive businesses, above phenomenon appeared. We choose the
product that more difference to do the competition which one strong and two weak as figure
0 10000 20000 30000 40000 50000
0 10 20 30 40 50 60 Cyclicity of experiment
A cc u m u lated co n su m er 0 500 1000 1500 2000
0 10 20 30 40 50 Cyclicity of experiment
P1-0.5 P2-0.5 60 C o n su m er s p er cy cle 0 10000 20000 30000 40000 50000
0 10 20 30 40 50 60 Cyclicity of experiment
A cc u m u lated co n su m er 0 500 1000 1500 2000
0 10 20 30 40 50 60 Cyclicity of experiment
11. The traits of product are set by 0.5, 0.2, and 0.8. One of business that totally fit
consumers’ product is 0.5, yet 0.3 product that consumption normality distribution
differences are 0.2 and 0.8. The result of diffusion competition shows that the result of Figure
8(a). In other words, the diffusion process of more difference product 0.2 and 0.8 are almost
overlapped, and cannot be compete with 0.5 products.
If we change 0.8 products into 0.6 products that close to consumers’ demand, the special
phenomenon are appeared like figure 12. Although the diffusion style of 0.6 products is
similar to 0.2, the strength of WOM is appeared slowly after 10 weeks to produce more
competition than 0.2 product with the number of consumers between 0.5 and 0.2.
However, the peak of diffusion 0.5 falls suddenly after the twenty weeks, but the diffusion
of 0.6 product rises again, falling behind to staying even 0.5 product in the 26 period, and get
ahead quickly to become the pattern of competition that similar to substation. Then, the
number of accumulated consumption almost gets ahead 0.5 products in the 40 period (Figure
11b). Moreover, we do the second study in the same conditions and get the same result as
Figure 13. We further found that 0.6 products and 0.5 products almost get entangled in the
beginning, and keep pace with 0.5 products continually. At last, 0.6 products follow and
behind the number one product closely in little distance. In the same words, the competition
of 0.5 and 0.6 products is dual-product competition that compare to above experiment of
Figure 9. Nevertheless, it plays an important role after 0.2 products that uncompetitive get
involved in the study. As the saying goes, be more a spoiler than a helper, it may be a pattern
(a) (b)
Figure 11. The diffusion experiment of similar product traits compete among three product
[image:18.595.87.477.268.443.2](a) (b)
Figure 12. The study of dissemination of strong, middle, weak products of experiment 1
(a) (b)
Figure 13. The study of dissemination of strong, middle, weak products experiment 2
0 10000 20000 30000 40000 50000
0 10 20 30 40 50 60 Cyclicity of experiment
A cc u m u lated co n su m er 0 500 1000 1500 2000
0 10 20 30 40 50 60 Cyclicity of experiment
P1-0.5 P2-0.6 P3-0.2 C o n su m er s p er cy cle 0 10000 20000 30000 40000 50000
0 10 20 30 40 50 Cyclicity of experiment
A cc u m u lated co n su m er 0 500 1000 1500 2000
0 10 20 30 40 50 Cyclicity of experiment
P1-0.5 P2-0.6 P3-0.2 C o n su m er s p er cy cle 0 10000 20000 30000 40000 50000
0 10 20 30 40 50 60 Cyclicity of experiment
A cc u m u lated co n su m er 0 500 1000 1500 2000
0 10 20 30 40 50 60 Cyclicity of experiment
[image:18.595.84.473.500.687.2]CONCLUSION
The study quote system simulated method of artificial world to do diffusion study of two
stages. In addition to the fit of examine pattern and suitable experimental parameter with
strong public dissemination in the three parameter study in the first step, marketing sales have
to know that the phenomenon of hot sales and it can’t be over optimistic for the future.
Besides, there is study of dual product competition in the second step. The two same product
traits of diffusion competition are still loses and gains rather than getting the result that divide
all consumers equally like general pattern. The little difference in individual behavior may
affect trend of whole diffusion, because the model integrate with whole phenomenon by
individual consumers’ individual behavior. Although the study cannot be analyze the reason
of phenomenon appeared, for the model, it get the result that differ from general research
method and provide and confer the probability of reasons that appears.
In the experimental type of tri-product, we found that it plays a key role after adding the
third products that uncompetitive in competitive market dual product originally, so two
products with large sale drop become the pattern that compete with each other. It is similar to
the process of complex and dynamic competition in real world. For enterprise, it is a thinking
(1986) also thinks that the only correct way of understanding community actions is to
understand individual how to do each decisions for own goals. Although the model of study
only is a framework that initial consumer integrate with products, yet there are some
phenomenon that uneasy to experiment and analysis appeared. The model only interpreted in
analog way, but the diffusion study is an understanding of diffusion (Nigel and Towhidul,
2006).
We can supposed to products that bring out couldn’t fit the consumers’ demand in the
future research, and change the property of communities gradually to simulate diffusion of
polybasic communities in the experimental period. Besides, Apart from that, this model can
also be added into external research of the product network, to add the purchase quantity into
the willingness of consumer purchase, where, when the willingness increases with respect to
the accumulated sale out quality. This perhaps can help to simulate the explosive effect of a
killer product.
REFERENCE
Bass, F. M., A New Product Growth Model for Consumer Durable, Management Science, 15,
1969, 215-227.
Chen, J. C., Lin, T. L., and Kuo, M. H., Artificial Worlds Modeling of Human Resource
Management Systems, IEEE Transactions on Evolutionary Computation, 6(6), 2002,
542-556.
Dolnicar, S., Freitag, R., and Randle, M., To Segment or Not to Segment? An Investigation of
Segmentation Strategy Success under Varying Market Conditions, Australasian
Marketing Journal, 13(1), 2005, 20-35.
Dorigo, M., Maniezzo, V. and Colorni, A., Ant System: Optimization by a Colony of
26(1), 1996, 29-41.
Fourt, L. A., and Woodlock, J. W., Early Prediction of Market Success for Grocery Products,
Journal of Marketing, 24(5), 1960, 31-38.
Glen, M. S., and Cheryl, T. D., Changes in Product Traits and Costs as Drivers of New
Product Diffusion and Substitution, Production and Operations Management, 14(3),
2005, 272-285.
Goldenberg, J., Barak L., and Eitan M., Using Complex Systems Analysis to Advance
Marketing Theory Development: Modeling Heterogeneity Effects on New Product
Growth through Stochastic Cellular Automata, Academy of Marketing Science Review,
2001, 2001, 1-19.
Kotler, P., Marketing Management: Analysis, Planning, Implementation and Control, 8th ed.,
Prentice-Hall Inc., 1994.
Mansfield, E., Technical Change and the Rate of Imitation, Econometrica, 2(9), 1961,
741-766.
Nigel M., and Towhidul I., Modeling and Forecasting the Diffusion of Innovation- A 25-year
review, International Journal of Forecasting, 22(3), 2006, 519-545.
Ordeshook, P.C., Game Theory and Political Theory, Cambridge University Press, 1986.
Schelling, T.C., Micro Motives and Macro Behavior, W. W. Norton, 2006.
Sendil K. E. and Daniel, L., Modularity and Innovation in Complex Systems, Management
Science, 50(2), 2004, 159-173.
Simon, H. and Sebastin, K. H., Diffusion and Advertising: The German Telephone Company,
and Human Decision Processes, 43(3), 1989a, 301-335.
Sterman, J., D, Modeling Managerial Behavior: Misperceptions of Feedback in a Dynamic
Decision Making Experiment, Management Science, 35(3), 1989b, 321-339.
Terano, T., Analyzing Social Interaction in Electronic Communities Using an Artificial World
Approach, Technological Forecasting and Social Change, 64(1), 2000, 13-21.
Weerahandi, S. and Dalal, S. R., A Choice-Based Approach to the Diffusion of a Service:
Forecasting Fax Penetration by Market Segments, Marketing Science, 11(1), 1992,