0095-1137/11/$12.00 doi:10.1128/JCM.01606-10
Copyright © 2011, American Society for Microbiology. All Rights Reserved.
Rapid Genotyping of Human Papillomavirus by Post-PCR Array-Based
Hybridization Techniques
䌤
Anke Pierik,
1* Chris Zwanenburg,
1,2Elna Moerland,
3Dirk Broer,
4Henk Stapert,
1and Adriaan J. C. van den Brule
3,5Philips Research Europe, Department of Molecular Diagnostics, High Tech Campus 12a, 5656 AE Eindhoven, Netherlands1;
Fontys Hogescholen, Department of Applied Sciences, Rachelsmolen 1, 5600 AH Eindhoven, Netherlands2; Laboratory for
Pathology and Medical Microbiology (PAMM), Molecular Diagnostics Unit, Michelangelolaan 2, 5623 EJ Eindhoven,
Netherlands3; Eindhoven University of Technology, SFD—Helix 0.27, Den Dolech 2, 5612 AZ Eindhoven,
Netherlands4; and Catharina Hospital, Department of Molecular Diagnostics,
Michelangelolaan 2 5623 EJ Eindhoven, Netherlands5
Received 10 August 2010/Returned for modification 27 September 2010/Accepted 5 February 2011
Kinetic hybridization measurements on a microarray are expected to become a valuable tool for genotyping applications. A method has been developed that enables kinetic hybridization measurements of PCR products on a low-density microarray. This is accomplished by pumping a solution containing PCR products up and down through a porous microarray substrate. After every pumping cycle, the fluorescently labeled PCR products hybridized to capture probes immobilized on the solid surface of the porous microarray substrate are measured. By this method, both binding curves and high-resolution melting curves are obtained instead of the single endpoint hybridization intensities as with commonly used post-PCR array-based hybridization tech-niques. We used 20 subtypes of the human papillomavirus (HPV) as a model system to test our detection method and blindly analyzed 216 clinical samples. We compared our microarray flowthrough method with a reference method, PCR followed by areverselineblot (RLB). Real-time hybridization measurements followed by high-resolution melting curves of low concentrations of fluorescently labeled HPV targets on a microarray were successfully carried out without any additional chemical signal amplification. The results of our new method were in good agreement (93%, with a kappa coefficient of ⴝ0.88 [95% CI, 0.81 to 0.94]) with the RLB results. All discrepant samples were analyzed by a third method, enzyme immunoassay (EIA). Furthermore, in a number of cases, we were able to identify false-positive samples by making use of the information contained in the kinetic binding and melting curves. This clearly demonstrates the added value of the use of kinetic measurements and high-resolution melting curves, especially for highly homologous targets.
PCR-based methods allow for the rapid, cost-effective, and automated diagnosis of pathogens and have become a power-ful tool in microbiology and virology during the last decade (6). Real-time PCR makes the simultaneous detection of a number of targets possible. In practice, this number is limited to around six targets because of the spectral overlap of the different fluorophores that have to be discriminated in a single reaction mixture volume. One way of detecting more targets in parallel is by splitting the sample into several separate PCR volumes and performing different multiplex PCRs on each volume. However, especially in the case of low target concentration, splitting sample volumes increases the risk of target copy num-bers being below the limit of detection. Therefore, the number of times that a sample can be split should be limited.
For the parallel detection of a larger number of different PCR products, a separate, post-PCR detection step is a suit-able alternative. Several post-PCR techniques exist to detect amplified PCR products, generally based on hybridization as-says. They have the advantage that the multiplex assays have higher target capabilities than real-time PCR. Genotyping is
especially necessary for highly homologous targets, such as the human papillomavirus (HPV), for which over 100 different types have been identified. The types can be divided, based on their phylogenetic relationship and their presence in benign or malignant cervical lesions, into high-risk and low-risk types (3). Different molecular techniques exist to identify HPV DNA or RNA, and a number of post-PCR tests are commercially avail-able. With a broad-spectrum PCR, many different HPV types can be amplified in one sample using a single primer pair. Costs and labor are therefore reduced compared to those nec-essary to run specific amplifications in parallel. Different broad-spectrum HPV PCRs are available, including GP5⫹/ GP6⫹(11, 16), MY09/11 (7), and CPI/IIG (15).
Post-PCR genotyping tests for the determination of a spe-cific virus type are important because molecular epidemiology clearly indicates that certain human papillomavirus types are the principle cause of invasive cervical cancer, which is the second most common cancer in women worldwide (5, 11, 17). This kind of test is frequently performed by a hybridization assay. One established technique is thereverselineblot (RLB), which captures and detects specific subtypes on a membrane support. This method has been proven to be suitable for the identification of specific HPV types and the detection of mul-tiple infections (10, 16) but has the disadvantage of being laborious and time consuming. Other commercially available tests include the Linear Array HPV genotyping test (Roche
* Corresponding author. Mailing address: Philips Research Europe, Department of Molecular Diagnostics, High Tech Campus 12a, 5656 AE Eindhoven, Netherlands. Phone: 31(0)40 27 48832. Fax: 31(0)40 27 42944. E-mail: [email protected].
䌤Published ahead of print on 16 February 2011.
1395
on May 16, 2020 by guest
http://jcm.asm.org/
Diagnostics), the INNO-LiPA HPV test (Innogenetics NV), and the PapilloCheckTest (Greiner Bio-One GmbH), all using a general primer PCR followed by a hybridization detection. Furthermore, a test has been developed based on a general primer PCR followed by hybridization with type-specific oligo-nucleotide probes coupled to fluorescently labeled Luminex polystyrene beads, making the differentiation of to up to 100 different targets possible (14).
Other tests aim to identify a high-risk infection only by using either enzyme immunoassay (EIA) tests (Digene; Qiagen) (3) or cocktails of group-specific detection probes (Amplicor; Roche Diagnostics). RNA-based tests are also available, e.g., bioMe´rieux and Norchip offer a nucleic acid sequence-based amplification (NASBA) test that detects the expression of the E6/E7 viral oncogenes.
One commonality of all available DNA detection tests is a sequential hybridization and detection step. This results in a single endpoint intensity measurement. Discrimination be-tween aspecific and specific binding is difficult. Despite strin-gent washing conditions, cross-hybridization is still known to occur and is one of the main causes of false-positive results (4, 13). An advantage of real-time PCR is that some of the detec-tion chemistries used (e.g., intercalating dyes or detecdetec-tion probes like molecular beacons) allow for a post-PCR high-resolution melting curve analysis the gives additional informa-tion on specificity (18, 22). Especially for highly homologous targets like HPV, additional information on melting tempera-tures, like that obtained in real-time PCR, is valuable to reduce false positives, but it cannot be obtained with the currently available methods.
In this paper, we describe in detail a method that combines the dynamic measurements of real-time PCR with the high multiplex detection capability of the post-PCR hybridization arrays.
We have developed a method that integrates microarray hybridization and detection and evaluated this kinetic hybrid-ization method for genotyping applications. With this system, PCR products are pumped up and down through a porous microarray substrate (membrane) at a controlled temperature. During binding (hybridization) and the subsequent unbinding (melting), the fluorescence pattern is imaged after every pumping cycle. By concatenating these images, the kinetics of hybridization and melting can be followed in detail over time. We have investigated the use of this method for genotyping applications and have chosen HPV as a model system, due to the method’s relevance for discriminating different HPV vari-ants. As a benchmark for this genotyping analysis, we used the reverse line blot. This system is technically the most identical because the same substrate material and the same primer sets are used. Both methods also allow the processing of sample types such as cervical tissue and could therefore be used in a feasibility study that included this sample type.
MATERIALS AND METHODS
Sample selection.For optimization of the microarray performance, HPV PCR products obtained from clinical samples with known HPV types, as well as HPV 16 PCR products obtained from human cervical SiHa cell lines, were used.
Subsequently, clinical samples with unknown HPV infections were first ana-lyzed by using the EIA and the RLB methods. Based on the outcomes of these tests, 180 samples were selected to be analyzed by the microarray flowthrough
method for the evaluation of the kinetic measurements. The 180 samples were divided into three sample groups consisting of 60 samples each. The first group had yielded contradictory results between EIA and RLB or had shown the presence of multiple infections. The second group consisted of cytological cer-vical cell suspensions that showed borderline atypical squamous cells of unde-termined significance or that mild dyskaryosis. A third group of samples included DNA from formalin-fixed, paraffin-embedded cervical intraepithelial neoplasia grade I (CIN I) and CIN II tissues. Each group also included a number of samples that were HPV negative based on the outcome of the EIA or RLB. Furthermore, each sample group contained a total of 12 sample processing controls and PCR blanks for quality control. In total, 216 samples were included in this study.
Sample pretreatment.Cytological cervical cell suspensions in Preserv-Cyt fix-ative (ThinPrep; Cytyc, Marlborough, MA) were centrifuged, and after removal of the supernatant, the remaining pellet was put into 180l lysis mix (containing 3.3 mg/ml proteinase K from a proteinase K high pure PCR template preparation kit [Roche Diagnostics, Basel, Switzerland]) in proteinase K buffer (10 mM Tris-HCl [pH 7.5] and 0.5% Tween 20 [Sigma-Aldrich, St. Louis, MO]). After mixing, the samples were incubated in a block heater for 1 h at 56°C. The samples were boiled and centrifuged for 1 min at 8,000⫻g.
The formalin-fixed, paraffin-embedded tissue samples were pretreated as de-scribed previously (16), using an overnight incubation at 37°C with the lysis mixture as described above.
PCR. All pretreated samples were subjected to a DNA quality check by amplification of-globin by using the primers PCO3and PCO5for PCR, previ-ously described in reference 2. For HPV detection, 10l of the pretreated sample was subjected to PCR in a 50-l reaction mixture volume using the general primers GP5⫹/GP6⫹in a 9700 thermal cycler (Applied Biosystems, California) with the PCR program described in reference 16. These primers anneal to a homologous region of the HPV types (16). For the microarray analysis, the GP6⫹primer was labeled with cyanine-5 dye (Cy5) (Biolegio, Nijmegen, Netherlands), whereas for the RLB, the GP6⫹primer contained biotin.
Microarray manufacturing. Biodyne C membranes (Pall Biosupport, East Hills, NY) were punched into 12-mm circular pieces and laser welded onto nylon rings to facilitate handling and processing. The membranes were activated by incubation for 10 min at room temperature with a 16% 1-ethyl-3-dimethylamino propyl carbodiimide hydrochloride (EDC) solution (Sigma-Aldrich, St-Louis, MO). After a short rinse with Milli-Q water, the membranes were dried and then positioned on a single-nozzle inkjet printer (12). 5⬘-Amine-functionalized oligo-nucleotide capture probes (all high-performance liquid chromatography puri-fied; Biolegio, Nijmegen, the Netherlands) were dissolved in print buffer (60 mM NaHCO3buffer, pH 8.5) to a concentration of 40M. Each spot of the microar-ray was built up with 400-picoliter print fluid. The final spots, containing the capture probes attached to active groups on the inner surface area of the mem-brane, were formed by evaporation of the solvent. Each fluid was printed in triplicate for purposes of redundancy.
After printing and drying, the remaining active groups on the membrane were deactivated by an 8-min incubation with 0.1 M NaOH. The final step of the array manufacturing procedure was blocking the surface for 5 min at 50°C using a 2⫻ SSPE–0.1% SDS blocking solution (1⫻SSPE is 0.18 M NaCl, 10 mM NaH2PO4, and 1 mM EDTA, pH 7.7) and then incubating it for 1 min with a 20 mM EDTA solution at pH 8.0.
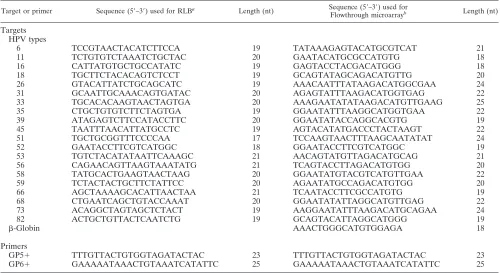
Microarray flowthrough optimization.The microarray flowthrough method was optimized for the concentrations of the printed capture probe fluids, capture probe sequences, and hybridization conditions. The capture probe sequences for the RLB, originally published in reference 16, were adapted for the microarray analysis to make use of the “position-of-label” effect (21). The hybridization sequences were chosen such that the position of the capture probe was close to the 5⬘end of the amplicon containing the fluorophore, which can account for a considerable increase in hybridization signals, especially for short capture probes as used in this study (20). All designs were evaluated by using the database of the National Center for Biotechnology Information (http://www.ncbi.nlm.nih.gov) and checked for homology by using BLAST. They were subsequently evaluated for analytical sensitivity and specificity by hybridization of 2 nM PCR product of each HPV type on an individual microarray that contained spots of both the RLB and the position-of-label capture probes. Sensitivity was addressed by comparing the spot intensities of the RLB and the new microarray oligonucleotide se-quences of each HPV type. All final sese-quences obtained during this optimization were used in further experiments and are given in Table 1. In total, 20 different HPV types were considered in this study; all of the high-risk HPV types were used, including a number of suspected high-risk types which we categorize as high risk (HPV 16, 18, 31, 33, 35, 39, 45, 51, 52, 56, 58, 59, 68, 73, and 82). We
on May 16, 2020 by guest
http://jcm.asm.org/
also used a number of low-risk types (HPV 6, 11, 26, 53, and 66) that are the most prominent low-risk HPV types known today.
The overall sensitivities were assessed based on hybridizations of dilution series of PCR products and were compared with those of RLB.
Microarray flowthrough detection and analysis.The volume containing the PCR products was diluted in Milli-Q water to 100l. The PCR products were denatured by heating the samples up to 95°C for 5 min and placing them on ice. The samples were diluted in 400l of hybridization buffer, with a final buffer composition of 1.9⫻SSPE and 0.08% SDS.
Figure 1 shows a schematic of the flowthrough device. The porous microarray substrate was positioned between a so-called upper flow chamber and a lower flow chamber. Not shown are the means to apply pressure to the contents of either the upper chamber or the lower chamber to force the solution through the porous microarray substrate. Prior to hybridization, the solution was preheated
to the hybridization temperature of 42°C. During hybridization, the solution was forced to flow through the membrane up and down from one chamber to another about 30 times at a rate of 1 cycle per minute.
During the time the solution was flowing through the porous microarray substrate (membrane), the fluid containing the fluorescently labeled PCR prod-ucts was in direct contact with the capture probes on the membrane and hybrid-ization could occur. The fluorescence intensities of the spots were measured from above using a charge-coupled-device (CCD) camera (Sony) and an illumi-nation system with four red light-emitting diodes (LEDs) (LXHL-MD1D Lu-mileds; Philips) and optical filters (XF 1069; Omega Optical) suitable for the excitation and detection of the Cy5 dye. After each pumping cycle, at the moment when all the fluid was below the membrane in the lower flow chamber and no fluorescent liquid was on top of the membrane (minimizing background signal), the microarray spot pattern was imaged. For each HPV spot type, the fluorescence intensity was measured once during each pumping cycle, and thus, the cumulative fluorescence intensity during the whole hybridization process could be followed over time. The setup is described in detail in Fig. 1 (8). This procedure allowed for (semi) real-time hybridization kinetics measurements without washing. After the hybridization step, melting curves were obtained by slowly increasing the temperature from the hybridization temperature of 42°C to 95°C at a rate of 1°C/minute, allowing for chemical and thermal equilibration (9). During melting, the mixture was pumped up and down through the membrane at one cycle per minute. The assay conditions were optimized for the hybridization buffer composition, temperature, and pressure levels. Kinetic hybridization curves and melting curves were obtained by plotting the spot intensities as a function of time and temperature, respectively. Melting temperatures were de-termined at the temperature where the spot intensity equalled 50% of the original signal.
[image:3.585.42.542.82.355.2]The total analysis time for a 27-cycle hybridization curve and a subsequent melting curve measurement of 53 measurement points thus takes 80 min, much faster than the RLB, which needs several hours for hybridization and detection. The background-corrected intensities (following the procedure described in reference 12) of three corresponding spots were averaged. A cutoff value of three times the standard deviation was used. The identification of the HPV type was initially based on the level of the hybridization signals at the endpoint. Melting TABLE 1. Capture probe and primer sequences used in the reverse line blot (16) and the microarray flowthrough method
Target or primer Sequence (5⬘–3⬘) used for RLBa
Length (nt) Sequence (5⬘–3⬘) used for
Flowthrough microarrayb Length (nt)
Targets HPV types
6 TCCGTAACTACATCTTCCA 19 TATAAAGAGTACATGCGTCAT 21
11 TCTGTGTCTAAATCTGCTAC 20 GAATACATGCGCCATGTG 18
16 CATTATGTGCTGCCATATC 19 GAGTACCTACGACATGGG 18
18 TGCTTCTACACAGTCTCCT 19 GCAGTATAGCAGACATGTTG 20
26 GTACATTATCTGCAGCATC 19 AAACAATTTATAAGACATGGCGAA 24
31 GCAATTGCAAACAGTGATAC 20 AGAGTATTTAAGACATGGTGAG 22
33 TGCACACAAGTAACTAGTGA 20 AAAGAATATATAAGACATGTTGAAG 25
35 CTGCTGTGTCTTCTAGTGA 19 GGAATATTTAAGGCATGGTGAA 22
39 ATAGAGTCTTCCATACCTTC 20 GGAATATACCAGGCACGTG 19
45 TAATTTAACATTATGCCTC 19 AGTACATATGACCCTACTAAGT 22
51 TGCTGCGGTTTCCCCAA 17 TCCAAGTAACTTTAAGCAATATAT 24
52 GAATACCTTCGTCATGGC 18 GGAATACCTTCGTCATGGC 19
53 TGTCTACATATAATTCAAAGC 21 AACAGTATGTTAGACATGCAG 21
56 CAGAACAGTTAAGTAAATATG 21 TCAGTACCTTAGACATGTGG 20
58 TATGCACTGAAGTAACTAAG 20 GGAATATGTACGTCATGTTGAA 22
59 TCTACTACTGCTTCTATTCC 20 AGAATATGCCAGACATGTGG 20
66 AGCTAAAAGCACATTAACTAA 21 TCAATACCTTCGCCATGTG 19
68 CTGAATCAGCTGTACCAAAT 20 GGAATATATTAGGCATGTTGAG 22
73 ACAGGCTAGTAGCTCTACT 19 AAGGAATATTTAAGACATGCAGAA 24
82 ACTGCTGTTACTCAATCTG 19 GCAGTACATTAGGCATGGG 19
-Globin AAACTGGGCATGTGGAGA 18
Primers
GP5⫹ TTTGTTACTGTGGTAGATACTAC 23 TTTGTTACTGTGGTAGATACTAC 23
GP6⫹ GAAAAATAAACTGTAAATCATATTC 25 GAAAAATAAACTGTAAATCATATTC 25
[image:3.585.43.282.549.704.2]aThe fluorophore was biotin at the 5⬘end. bThe fluorophore was Cy5 at the 5⬘end.
FIG. 1. Experimental setup (9) showing the membrane that con-tains the capture probes.
on May 16, 2020 by guest
http://jcm.asm.org/
curves were available for all hybridizations and were used to investigate discrep-ancies between the RLB and the microarray flowthrough method.
The outcomes of the flowthrough measurements were compared to the results of the RLB. Cohen’s kappa coefficient was used as a tool to analyze the reliability between the two methods.
RLB detection.The reverse line blot (RLB) protocol was adapted from ref-erence 16. RLB makes use of a Biodyne C membrane (Pall Biosupport, East Hills, NY) onto which many different capture oligonucleotides were immobilized in rows by using a miniblotter MN45 (Immunetics, Cambridge, MA) in house. Each oligoprobe had a sequence complementary to one particular HPV type that was being detected. Perpendicular to the rows of deposited probes, up to 45 different biotin-labeled PCR products, as well as additional negative and positive controls and internal quality controls, were pipetted into parallel channels. After hybridization of the PCR products with the capture probes, the hybridization products were made visible by incubation with antibiotin conjugates and mea-sured with enhanced chemiluminescence detection (ECL).
EIA.The EIA was performed as previously described (3, 16). In the EIA, checking for infection with high-risk or low-risk HPV is done by incubation with a cocktail of group-specific detection probes. The low-risk cocktail contained probes for low-risk types in addition to those in the microarray or the RLB, namely, HPV 34, 40, 42, 43, 44, 54, 55, 57, 61, 70, 71, 72, 81, 83, and 84. Furthermore, HPV 73 and 82 were part of the low-risk cocktail while being considered high risk throughout the analysis described in this paper.
RESULTS
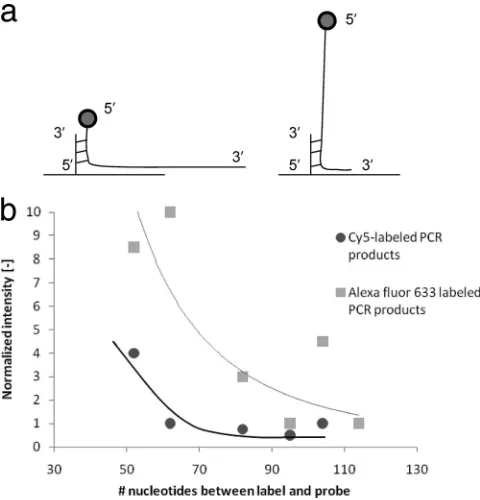
The position-of-label effect, as described previously (21), explains the increase of the hybridization intensity when the capture probe is located closer to the fluorophore that is at-tached to the amplicon. We evaluated this effect in our study. The data collected clearly show that positioning the hybridiza-tion site of the amplicons and, thus, the capture probe closer to the fluorophore indeed increases signal intensity. The results in Fig. 2 show this effect, with the design of different capture probes of the HPV 16 amplicon as an example. In order to rule out any specific involvement of the Cy5 dye, additional exper-iments were performed with Alexa Fluor 633-labeled PCR products, which resulted in the same trend.
To make optimal use of this effect, we have accordingly redesigned all 20 capture probe designs originally described in reference 16. Sixteen of the 20 capture probe sequences indeed showed improved hybridization signals. A few of these new sequences, however, showed cross-hybridization, and there-fore, the capture probe sequences of HPV 6, 45, and 51 were redesigned. For the other sequences showing cross-hybridiza-tion, specificity could be increased by increasing the stringency of the hybridization conditions (optimization of buffer condi-tions). The optimized capture probe sequences used in our experiments are listed in Table 1.
Figure 3 shows both the binding curves and the high-reso-lution melting curves obtained when 2 nM PCR product of a mixture of HPV 68 and 73 was incubated on the microarray. The left graph shows kinetic hybridization curves. It is clear that the dots containing capture probes for HPV 33, 35, and 51 also give positive signals because of cross-hybridization. Dur-ing the first few cycles, the cross-hybridization signals indeed increase, while during later cycles, the spot intensities de-crease, which is a characteristic feature for competitive hybrid-ization (1, 20). Based purely on the fluorescence levels ob-tained at the endpoint, after cycle 27, discrimination between matching and nonmatching oligonucleotides is not possible. The right-hand graph shows the different melting curves: the perfect matches clearly have a higher melting temperature than the nonmatching oligonucleotides. Only after evaluation
of the melting curves can it be concluded that cross-hybridiza-tion to HPV 35 and HPV 51 is the cause of false-positive hybridization signals. Furthermore, the kinetic hybridization measurements show that HPV 33 cross-hybridization disap-pears over time.
The kinetic hybridization curves can be used to estimate binding kinetics. Based on the Langmuir model for adsorption, the apparent association constant can be calculated, assuming that the dissociation constant is much lower than the product of the association constant and the target concentration. This value is equal to 7.105liters䡠mol⫺1s⫺1, which is nicely in line
with values found by others (8, 20). This shows that these kinetic curves give a reasonable understanding of the hybrid-ization process and can be used for optimhybrid-ization thereof.
The analytical sensitivity of the flowthrough method, de-pending slightly on HPV type, was found to be around 100 pM, which is comparable to the sensitivity of the RLB. This means that the flowthrough method allows for endpoint PCR without chemical signal amplification as needed with the RLB. There-fore, washing and additional chemical processes are elimi-nated, reducing time and costs.
Figure 4 shows the hybridization curves and melting curves of a typical clinical sample. The flowthrough analysis con-firmed the triple HPV infection found by reverse line blot analysis (HPV 18, 51, and 53). As HPV 45 has a high homology
FIG. 2. Influence of the position-of-label effect for HPV 16. (a) Schematic representation of a label (circle) near the hybridization probe (left) and at a distance (right). (b) The gain in hybridization intensity is plotted against the number of nucleotides that separate the label from the site where the amplicon is attached to the capture probe. The intensity for the capture probe that is the furthest away from the fluorophore is set at a value of 1. Comparison of the data for the Cy5-labeled and the Alexa Fluor 633-labeled PCR products sup-ports (dye-independent) improvement in hybridization intensity when using capture probes complementary to the region close to the fluo-rophore. The relatively large scatter of the data is partly caused by small differences in melting temperature.
on May 16, 2020 by guest
http://jcm.asm.org/
[image:4.585.300.540.69.319.2]to these three HPV types, this specific hybridization curve was added to show the high specificity of the method. The melting curve analysis afterwards delivered melting temperatures of 52, 54, and 51°C for HPV 18, 51, and 53, respectively, which is fully in agreement with the theoretical values that were calculated based on the hybridization sequences.
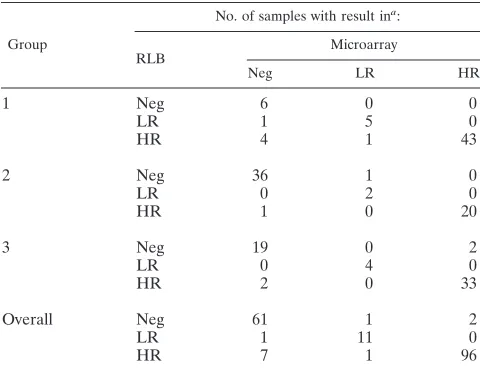
Table 2 shows the overall results of the analysis of the 216 samples, as well as the results for each of the three subgroups, for both the RLB and the microarray method. Group 1 con-tained the samples with many HPV infections, including a total of 15 double or triple infections. This was confirmed by the microarray flowthrough method. Group 2 and 3 contained more HPV-negative samples, again in agreement with the re-sults of the microarray. The rere-sults for these groups are rep-resentative of the numbers of positive samples found in prac-tice with these sample types.
Overall, the outcomes of the two different methods do match: 93% agreement is found between the two methods, with a Cohen’s kappa coefficient () of 0.88 (95% CI, 0.81 to 0.94), showing a very high level of agreement (Table 3). In each group, the results of the two measurement methods were not fully in line with each other in a number of cases. This number was the highest in group 1, which can be explained by the high number of multiple infections in this group: in almost half of
these discordant cases, part of the diagnosis was still correct, but not all the HPV subtypes were detected by both methods. As all data on melting temperatures were available for each microarray analysis, it is possible to extract a melting temper-ature for each individual hybridization. We investigated whether a potential relationship exists between the concentra-tion of a specific PCR product present in the sample and the associated melting temperature. We did not find such a corre-lation within the range of concentrations as obtained after the amplification step. Next, we compared the melting tempera-ture with the average melting temperatempera-tures of the same HPV type for each sample and investigated the samples where there was a difference larger than 2°C. We identified 2 cases (10%) where cross-hybridizations occurred on the flowthrough mi-croarray, and these cases could thus be identified correctly. As no melting temperatures can be obtained from RLB analyses, it is not possible to identify whether there are any cross-hy-bridizations on the RLB leading to any discrepancies.
Other reasons for discrepancies can be explained by differ-ences in detection method and threshold value. In the flow-through method, the cutoff was set to three times the standard deviation. In three (15%) of the discordant cases, the flow-through method gave signals just above the cutoff value.
[image:5.585.80.503.70.193.2]Overall, in 12 of the 180 cases, the differences between the
[image:5.585.78.505.551.688.2]FIG. 3. Kinetic hybridization curves (left) and melting curves (right) of a sample containing a 2 nM mixture of HPV 68 and HPV 73. Cross-hybridization of HPV 33, 35, and 51 is clearly observed. HPV 33, 35, and 51 show degrees of homology of 82% with HPV 68 and 83, 88, and 75%, respectively, with HPV 73. A distinction can be made between the perfect matches and the mismatches by consulting the melting curves, where clear differences in melting temperatures are observed. BG, background; a.u., arbitrary units.
FIG. 4. Kinetic hybridization curve of amplified DNA extracted from a clinical sample with a triple HPV infection (HPV 18, 51, and 53) (left) and the corresponding melting curve analysis (right). HPV 45, which is the HPV type with the highest degree of homology with HPV 18, 51, and 53 (90, 80, and 75%, respectively), is added to show the high selectivity, as it clearly does not give any hybridization signal or melting curve. BG, background; a.u., arbitrary units.
on May 16, 2020 by guest
http://jcm.asm.org/
microarray and the RLB readings could lead to a difference in diagnosis.
A further comparison with the EIA method was made with the 12 samples that gave contradictory results in the microar-ray flowthrough method and the RLB. The raw data for each sample for the three different methods are presented in Table 4. In 7 samples, the RLB method was in full agreement with the EIA. In 4 of these 7 cases, the signals obtained in the EIA were just above the cutoff value. In the remaining 3 samples, a high intensity was obtained in the EIA, whereas the microarray did not detect the infection.
In 3 of the samples, the RLB gave a negative result that was in contrast to the results for the flowthrough method and the EIA, where a high-intensity HPV infection was identified. Also, in 2 samples, the EIA found additional low-risk HPV infections with a weak intensity.
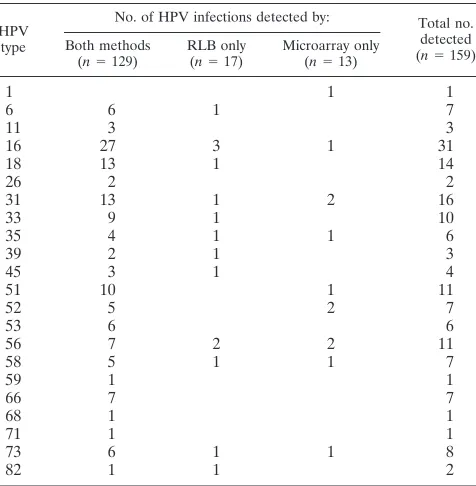
In order to compare the reverse line blot and our new flowthrough principle, we investigated which method was more efficient in detecting an HPV infection in the same sample set. In Table 5, each HPV infection is classified as being detected either by both methods or by only one. Most HPV types were detected by both methods. There are no indications that one detection method is more sensitive than the other for the detection of a specific HPV type, and failed detec-tions are randomly distributed rather than systematically found for specific HPV types.
DISCUSSION
In this study, we have investigated the added value of mea-suring the binding kinetics and melting curves of PCR products to and from capture probes immobilized on a microarray. As a model assay, we have used genotyping of the human papillo-mavirus, of which over 100 different types are known. Molec-ular epidemiology clearly indicates that infection with certain human papillomavirus types is the main factor involved in the development of cervical cancer, which is the second most
com-mon cancer in women worldwide (5, 11, 17). The detection of HPV is hampered by a high number of homologous targets, which are known to cross-hybridize on a microarray.
The method described in this paper combines, on the one hand, the advantages of microarrays and, on the other hand, the high-resolution melting of real-time PCR (18, 22) as orig-inally developed by Idaho Technology, Inc. (Salt Lake City, UT), and now commonly applied in an increasing number of real-time PCR machines. Our method enables real-time fluo-rescence detection on a microarray during hybridization and melting. It allows for increased multiplex detection compared to the number of targets possible in real-time PCR, as the detection of the different targets is spatially separated on a solid surface. Our method is especially suitable for highly ho-mologous targets, like HPV, or single nucleotide polymor-phism (SNP) detection, since a high-resolution melting curve is part of the detection protocol.
First, we have optimized the sequences of the hybridization probes in order to take advantage of the position-of-label effect (21). This led to considerably increased hybridization signals, and we were thereby able to obtain sensitivities comparable to the analytical sensitivity of the reverse line blot (100 pM) without the need for additional signal amplification methods, such as incubation with antibiotin conjugates and enhanced chemiluminescence detection, as used in the RLB.
The kinetic curves, including the high-resolution melting curves, give additional understanding of the hybridization pro-cess. First, they provide more information on specificity than an endpoint hybridization measurement, which is standard in the tests available on the market today (e.g., INNO-LiPA HPV test or PapiloCheckTest and the Linear Array HPV test). Ref-erences 14 and 20 stress the problem of cross-hybridization, which can lead to undesired false-positive results. It has been shown that cross-hybridizations can have a large influence on the hybridization kinetics, as well as the expected spot intensity levels. Furthermore, the ratio between perfect matching spots and mismatching spots changes over incubation time, both with hybridization and with subsequent washing steps. The kinetic measurements of the flowthrough method enable better dis-crimination between perfect match and mismatch hybridiza-tions. In addition to this, dynamic curves can also be used for process optimization in terms of binding kinetics and minimi-zation of potential cross-hybridiminimi-zation.
[image:6.585.299.541.91.148.2]In this study, we have presented the analysis of 180 clinical samples with unknown HPV infections; we were able to iden-tify a number of false-positive results solely on the basis of the melting curves. The outcomes of these measurements were compared with the results of the reverse line blot. Overall, there was an agreement of 93%. The lowest numbers were found in the sample group which contained a high number of
TABLE 3. Statistical analysis of the comparison of the two post-PCR detection methods
Group % Agreement Kappa factor (95% CI)
1 90 0.75 (0.64–0.86)
2 97 0.93 (0.88–0.99)
3 93 0.87 (0.81–0.94)
Overall 93 0.88 (0.81–0.94)
TABLE 2. Comparison of the three different groups of sample types and overall comparison for the two post-PCR detection
methods, reverse line blot and microarray flowthrough
Group
No. of samples with result ina :
RLB
Microarray
Neg LR HR
1 Neg 6 0 0
LR 1 5 0
HR 4 1 43
2 Neg 36 1 0
LR 0 2 0
HR 1 0 20
3 Neg 19 0 2
LR 0 4 0
HR 2 0 33
Overall Neg 61 1 2
LR 1 11 0
HR 7 1 96
aNeg, negative; LR, low-risk HPV type; HR, high-risk HPV type.
on May 16, 2020 by guest
http://jcm.asm.org/
[image:6.585.42.282.99.284.2]multiple infections and known difficult cases. This group, group 1, contained samples that were already seen to be diffi-cult to diagnose, as the EIA and the RLB gave contradictory results. When only the samples that were more representative in terms of what is normally found in the field (group 2 and 3) were taken into account, an overall sensitivity and specificity of 95% were found. A Cohen’s kappa coefficient of 0.88 was found (95% CI, 0.81 to 0.94), indicating a very high level of agreement between the two detection methods.
A number of discrepancies between the two methods can be
explained by signals just below or above the cutoff values. For the microarray flowthrough analysis as presented here, we have used an analytical threshold value based on three times the standard deviation of the noise levels. This should be further optimized, also taking into account the clinical relevance. The flowthrough method has the additional possibility of using a dynamic threshold value, depending on the specific applica-tion, which might exclude clinically nonrelevant false-positive results.
[image:7.585.45.542.81.258.2]We have compared all the results of the discordant samples with the results obtained by a third measurement method, which was the EIA. In 25% of these discordant samples, the flowthrough method obtained results similar to those of the EIA, whereas in 58% of the discordant samples, the EIA confirmed the results of the RLB. In the remaining 2 samples, the EIA found additional low-risk types next to a high-risk type, as was also found in the RLB. From the analysis given in Table 4, it seems that the flowthrough method is slightly less sensitive than the RLB, as negative results were found more often. It should be mentioned, however, that in a number of cases (4 out of 7) where the microarray did not detect an infection, the EIA intensities were very low (slightly above the cutoff value of 0.2), which might indicate a low viral load in these samples. In addition to this, in a number of the cases of discrepancies, multiple infections were present. It is not pos-sible to use the same PCR products for the microarray method as are used with the RLB or EIA, as the RLB needs a biotin-labeled primer and the flowthrough method a Cy5-biotin-labeled primer. Therefore, a separate PCR was needed for the mi-croarray-based assay. The mutation-tolerant GP5⫹/GP6⫹ PCR generally gives low concentrations of PCR products be-cause this PCR is optimized to amplify all HPV types in a single run, thereby sacrificing endpoint concentration. As the GP5⫹/GP6⫹PCR is complex, especially when multiple virus types are present, the concentrations of different HPV types at the end of the PCR can vary. A low viral load or the presence of multiple infections combined with a different PCR can lead
TABLE 4. Raw data of discrepancies between the results of the RLB and those of the microarray flowthrougha
Group Sample no.
Microarray RLB EIA
Result HPV type
found Result(s)
HPV type(s)
found Result
Fluorescence intensityb in:
HR cocktail LR cocktail
1 7 Neg HR/LR 16,58 HR/LR 0.943 1.631
8 Neg LR 6 LR 2.773
12 Neg HR 16,18 HR 0.342
21 Neg HR 18 HR/LR 9.999 0.354
58 Neg HR 45 HR 9.999
70 LR 11 HR/LR 11,16 HR/LR 0.429 9.999
2 131 LR 1 Neg LR 9.999
135 Neg HR 82 HR/LR 9.999 0.401
3 148 HR 52 Neg HR 1.300
158 Neg HR 33 HR 0.281
165 HR 16 Neg HR 9.999
209 Neg HR 31 HR 0.367
a
For the two genotyping methods, the specific HPV type(s) found is specified. In cases where a high-risk and a low-risk infection were found (HR/LR), the result was classified as high risk. Neg, negative; HR, high-risk HPV type; LR, low-risk HPV type.
b
[image:7.585.44.282.457.700.2]For the EIA, the fluorescence intensities in the HR and the LR cocktails are given in arbitrary units. The value 9.999 means that the spots were at saturation.
TABLE 5. Detection of HPV infections in the different assaysa
HPV type
No. of HPV infections detected by: Total no.
detected (n⫽159) Both methods
(n⫽129)
RLB only (n⫽17)
Microarray only (n⫽13)
1 1 1
6 6 1 7
11 3 3
16 27 3 1 31
18 13 1 14
26 2 2
31 13 1 2 16
33 9 1 10
35 4 1 1 6
39 2 1 3
45 3 1 4
51 10 1 11
52 5 2 7
53 6 6
56 7 2 2 11
58 5 1 1 7
59 1 1
66 7 7
68 1 1
71 1 1
73 6 1 1 8
82 1 1 2
a
In total, 159 HPV infections were detected in 216 clinical samples. GP5⫹/ GP6⫹PCR was followed by both reverse line blot detection and flowthrough microarray detection.
on May 16, 2020 by guest
http://jcm.asm.org/
to slightly different PCR product concentrations, which can lead to detection signals just below or above the cutoff values. This might explain the negative outcomes of the microarray flowthrough method where the EIA/RLB results were positive. For the RLB, the same PCR products were used as for the EIA, and therefore, discrepancies between the results for the RLB and EIA cannot be explained by this reasoning. The microar-ray method can be further optimized by an investigation of the clinical sensitivity. Furthermore, when comparing this method to the RLB or the EIA, especially in the case of low viral loads, the effect of using different PCRs, as well as differently labeled primers, should be further investigated.
When the results for each genotype are assessed individu-ally, as is done in Table 5, there are only 4 cases out of 159 where an HPV infection was detected by the RLB while the microarray-based method failed to detect it. We are therefore tempted to conclude that the sensitivities of the RLB and the microarray flowthrough method are comparable.
An advantage of the method presented in this study is that through miniaturization and the use of fluorescence instead of chemiluminescence, the amount of chemicals needed is much lower. No toxic chemicals are used, unlike other detection methods. There is no need for signal amplification steps, which can cause additional variations. All post-PCR steps in the process are integrated into one final automatic hybridization and detection step which lasts just over 1.5 h. The real-time binding and unbinding kinetics can lead to significantly in-creased understanding and improvement of the assay, as ki-netic curves are measured instead of hybridization endpoints. The system can be further improved by a full implementation of the melting curve analysis, thereby automatically identifying false-positive results caused by cross-hybridization.
We conclude that we have shown the added value of the kinetic hybridization measurements and high-resolution melt-ing for genotypmelt-ing applications. This principle combines the advantages of real-time PCR (multiple measurements instead of an endpoint measurement, and in addition, a high-resolu-tion melting curve) with the high, multiplex detechigh-resolu-tion capabil-ities of a microarray. As high-resolution melting analysis is becoming increasingly relevant and state of the art in real-time PCR, we would like to stress the added value of kinetic hy-bridization measurements and melting curves in microarray analysis. Combining the potential of this principle and the good initial results with clinical samples, we believe that this valuable principle enables the improvement of clinical PCR-based diagnostics.
ACKNOWLEDGMENTS
We thank Ron van Lieshout, Mara Sijbers, Tamara de Waal, and Aukje Veenstra for initial microarray optimization experiments.
Fur-thermore, Faustin Usabuwera is acknowledged for his inkjet printing work.
Frits Dijksman and Astrid Visser are acknowledged with great ap-preciation for critically reviewing the manuscript.
REFERENCES
1.Bishop, J., C. Wilson, A. M. Chagovetz, and S. Blair.2007. Competitive displacement of DNA during surface hybridization. Biophys. J.92:L10–L12. 2.De Roda Husman, A. M., et al.1994. Processing of long-stored archival cervical smears for human papillomavirus detection by the polymerase chain reaction. Br. J. Cancer72:412–417.
3.Jacobs, M. V., et al.1997. A general GP5⫹/GP6⫹-mediated PCR-enzyme immunoassay method for rapid detection of 14 high-risk and 6 low-risk human papillomavirus genotypes in cervical scrapings. J. Clin. Microbiol.
35:791–795.
4.Jones, J., N. G. Powell, A. Tristram, A. N. Fiander, and S. Hibbitts.2009. Comparison of the PapilloCheck DNA micro-array human papillomavirus detection assay with Hybrid Capture II and PCR-enzyme immunoassay using the GP5/6⫹primer set. J. Clin. Virol.45:100–104.
5.Kjaer, S., et al.2006. The absolute risk of cervical abnormalities in high-risk human papillomavirus-positive, cytologically normal women over a 10-year period. Res. Cancer.66:10630–10636.
6.Malorny, B., et al.2004. Diagnostic real-time PCR for detection of Salmo-nella in food. Appl. Environ. Microbiol.70:7046–7052.
7.Manos, M. M., et al.1989. Use of polymerase chain reaction amplification for the detection of genital human papillomaviruses. Cancer Cells7:209–214. 8.Mocanu, D., et al.2008. Quantitative analysis of DNA hybridization in a flowthrough microarray for molecular testing. Anal. Biochem.380:84–90. 9.Mocanu, D., et al.2009. Mass transfer effects on DNA hybridization in a
flow-through microarray. J. Biotechnol.139:179–185.
10.Molijn, A., B. Kleter, W. Quint, and L.-J. van Doorn. 2005. Molecular diagnosis of human papilloma virus (HPV) infections. J. Clin. Virol.32S:
S43–S51.
11.Mun˜oz, N. M., et al.2003. Epidemiologic classification of human papilloma-virus types associated with cervical cancer. N. Engl. J. Med.348:518–527. 12.Pierik, A., J. F. Dijksman, A. T. A. Raaijmakers, A. J. J. Wismans, and H. R.
Stapert. 2008. Quality control of inkjet technology for DNA microarray manufacturing. Biotech. J.3:1581–1590.
13.Poljak, M., I. J. Marin, K. Seme, and A. Vince.2002. Hybrid Capture II HPV test detects at least 15 human papillomavirus genotypes not included in its current high-risk probe cocktail. J. Clin. Virol.25:S89–S97.
14.Schmitt, M., et al.2006. Bead-based multiplex genotyping of human papil-lomaviruses. J. Clin. Microbiol.44:504–512.
15.Tieben, L. M., et al.1993. Detection of cutaneous and genital HPV types in clinical samples by PCR using consensus primers. J. Virol. Methods42:265– 280.
16.van den Brule, A. J. C., et al.2002. GP5⫹/6⫹PCR followed by reverse line blot analysis enables rapid and high through-put identification of human papillomavirus genotypes. J. Clin. Microbiol.40:779–787.
17.Walboomers, J. M. M., et al.1999. Human papillomavirus is a necessary cause of invasive cervical cancer worldwide. J. Pathol.189:12–19. 18.Wittwer, C. T., G. H. Reed, C. N. Gundry, J. G. Vandersteen, and R. J. Pryor.
2003. High-resolution genotyping by amplicon melting analysis using LCGreen. Clin. Chem.49:853–860.
19. Reference deleted.
20.Zhang, Y., D. A. Hammer, and D. J. Graves.2005. Competitive hybridization kinetics reveals unexpected behavior patterns. Biophys. J.89:2950–2959. 21.Zhang, L., T. Hurek, and B. Reinhold-Hurek.2007. Position of the
fluores-cent label is a crucial factor determining signal intensity in microarray hy-bridizations. Nucleic Acids Res.33:e166.
22.Zhou, L., L. Wang, R. Palais, R. Pryor, and C. Wittwer.2005. High-resolu-tion melting curve analysis for simultaneous mutaHigh-resolu-tion scanning and geno-typing in solution. Clin. Chem.51:1770–1777.