0095-1137/07/$08.00⫹0 doi:10.1128/JCM.02308-06
Copyright © 2007, American Society for Microbiology. All Rights Reserved.
Comparison of Various Blood Compartments and Reporting Units for
the Detection and Quantification of Epstein-Barr
Virus in Peripheral Blood
䌤
H. Hakim,
1C. Gibson,
2J. Pan,
3K. Srivastava,
3Z. Gu,
2M. J. Bankowski,
4and R. T. Hayden
2*
Departments of Infectious Diseases,1Pathology,2and Biostatistics,3St. Jude Children’s Research Hospital, Memphis, Tennessee, and
Department of Microbiology, Diagnostic Laboratory Services, Inc., and the Queens and Kuakini Health Systems, Honolulu, Hawaii4
Received 14 November 2006/Returned for modification 14 February 2007/Accepted 1 May 2007
Epstein-Barr virus (EBV) infection is associated with a broad spectrum of disease. While quantification of EBV nucleic acid in the peripheral blood has been demonstrated to be useful for diagnosis and patient care, the optimal sample type and reporting format for such testing remain uncertain. Using quantitative real-time PCR (QRT-PCR), we evaluated EBV in whole blood (WB), peripheral blood mononuclear cells (PBMC), and plasma in 249 samples from 122 patients. In WB and PBMC, results were reported both in viral copies/ml and in copies/g of total DNA. Trendings of quantitative values over time among the different sample types were compared. The sensitivities of QRT-PCR using WB and that using PBMC did not differ significantly (Pⴝ0.33), and both were more sensitive than plasma alone (P< 0.0001). EBV viral load results from WB and PBMC paired sample types also showed a significant correlation (P< 0.05), as did results reported in copies/ml and copies/g DNA for both WB and PBMC (R2
> 0.93). EBV viral loads detected using WB and PBMC trended very closely for the few patients who had multiple positive samples available for analysis. WB and PBMC show comparable sensitivities and a close quantitative correlation when assayed for EBV by QRT-PCR. The close correlation between copies/ml and copies/g DNA also suggests that normalization to cell number or genomic DNA in cellular specimens may not be necessary.
Epstein-Barr virus (EBV) is associated with a broad spec-trum of epithelial and lymphoproliferative disorders, many as-sociated with altered host immune status. EBV-asas-sociated con-ditions include infectious mononucleosis, Burkitt’s lymphoma, Hodgkin’s lymphoma, T-cell or NK cell lymphoma, B-cell non-Hodgkin’s lymphoma, nasopharyngeal carcinoma, gastric car-cinoma, oral hairy leukoplakia, AIDS-related lymphoma, and posttransplantation lymphoproliferative disease (PTLD) (8). Much work has focused on PTLD, with several studies showing that high levels of EBV DNA in peripheral blood from immu-nocompromised patients predicts the onset of PTLD (1, 2, 10, 11, 16, 19–23), while a decrease in EBV DNA load is associ-ated with response to treatment and regression of PTLD (5, 6, 12, 17, 24).
A variety of molecular diagnostic methods, primarily based on PCR, have been developed to detect and quantify circulat-ing EBV in an effort to predict or detect the onset of EBV-associated disorders and to assess the efficacy of therapeutic intervention (2, 7, 19, 21–23). Over the past few years, such methods have undergone significant improvement (11). In par-ticular, the introduction of real-time amplification and detec-tion methods has reduced the risk of carry-over contaminadetec-tion, shortened the time needed for the postamplification analysis, improved ease of use, and improved quantitative test perfor-mance (9, 18, 25). In addition, numerous studies have begun to define the role for such assays in relation to clinical care and
predictive value (1, 2, 14, 16, 19, 22, 28). Critical to the accu-racy of these methods is the detection of inefficiencies in the specimen preparation or amplification processes. Several au-thors have addressed this point, using both endogenously and exogenously added internal controls, in an effort to monitor for suboptimal test performance. Some have advocated the nor-malization of viral load results to a coamplified housekeeping gene as the best means of meeting these goals (9, 25).
Sample type selection often impacts test performance char-acteristics, including clinical predictive value. Several periph-eral blood compartments have been used to measure EBV viral load, including whole blood (WB) (1, 23), serum (3, 4, 13, 14), plasma (15, 18, 32), peripheral blood leukocytes, and mononuclear cells (10, 16, 19, 21, 22). Likewise, reporting units for EBV DNA viral loads have variously included copies/ml, copies/g DNA, and copies/105cells. Ongoing uncertainty
re-lated to the optimal sample type and reporting format for quantitative EBV detection has contributed to the absence of standardized test guidelines and has complicated the effort to define EBV treatment threshold values. The goal of the present study is to directly compare EBV DNA viral loads for matched specimens from WB, peripheral blood mononuclear cells (PBMC), and plasma obtained from a population of pe-diatric hematopoietic stem cell transplant recipients tested by quantitative real-time PCR (QRT-PCR).
MATERIALS AND METHODS
Patient samples.Following Institutional Review Board (IRB) approval, 249 peripheral blood samples from 122 patients treated at St. Jude Children’s Re-search Hospital in Memphis, TN, were included for study. These specimens were received for clinical testing from September 2002 to September 2005.
DNA extracts from 249 paired WB and PBMC samples, 167 paired plasma and
* Corresponding author. Mailing address: St. Jude Children’s Re-search Hospital, Department of Pathology, 332 North Lauderdale Street, Memphis, TN 38105. Phone: (901) 3300. Fax: (901) 495-3100. E-mail: [email protected].
䌤Published ahead of print on 9 May 2007.
2151
on May 16, 2020 by guest
http://jcm.asm.org/
WB samples, and 167 paired plasma and PBMC samples were deidentified and tested blindly in duplicate. Either EDTA-treated blood (WB and plasma sam-ples) or sodium citrated blood (PBMC samsam-ples) was used for study. All paired
samples were collected concurrently (single blood draw), and 200l each of WB
and plasma samples was used for DNA extraction. PBMC pellets were prepared by centrifuging 4 ml of WB in cell preparation tubes (Becton Dickinson, Franklin Lakes, NJ) for 20 min at 1,800 relative centrifugal force; PBMC pellets were
resuspended in 700l of phosphate-buffered saline. Two hundred microliters
each of the WB, plasma, and PBMC pellet samples was used for DNA extraction using a QIAamp blood mini kit (QIAGEN Inc., Valencia, CA), with final elution
in 200l 10% AE buffer. Extracts were frozen at⫺70°C until use. Eight
micro-liters of eluate was used for each PCR, a portion which corresponded to 0.008 ml of the original sample for WB and plasma and 0.032 ml of the original sample for PBMC. Viral control samples were similarly extracted with the QIAamp blood mini kit and serially diluted prior to QRT-PCR.
Determination of EBV DNA load. (i) QRT-PCR.The PCR standard curve used
a 90-bp PCR product from the EBVBALF5gene, which was cloned into a pCR
2.1-TOPO vector (Invitrogen, Carlsbad, CA) and transformed into One Shot
Top10 competentEscherichia colicells. Colonies were screened by sequencing to
confirm the correct insert. Plasmid DNA from the confirmed colony was isolated using a QIAprep spin miniprep kit (QIAGEN Inc., Valencia, CA), and the PCR products for the standard curve were quantified spectrophotometrically. Raji (American Type Culture Collection [ATCC] CCL-86) and Namalwa (ATCC CRL-1432) cell lines were used as EBV-positive controls. HL60 cells were used as EBV-negative controls. The acceptable range for the EBV-positive control Namalwa cell line was within a range width of 0.39 viral copies/cell, while that for the Raji cell line was within 2.43 copies/cell. The results from these positive controls fell within these ranges in all the assay runs.
QRT-PCR was performed in a manner similar to that described by Kimura et
al. (11). Briefly, a multiplexed PCR targeted a 90-bp region of theBALF5gene
coamplified with the human housekeeping geneRNase P. The assay consisted of
a primer set and a dual-labeled (5⬘6-carboxyfluorescein/3⬘Black Hole Quencher
-1) TaqMan probe specific to EBV. An 8-l aliquot of patient DNA extract was
used in a final reaction volume of 50l. RT-PCR consisted of 50 cycles and was
performed using an ABI PRISM 7900HT sequence detection system (Applied Biosystems, Foster City, CA). The reaction was run under the following cycling conditions: a temperature of 50°C for 2 min, followed by 95°C for 10 min, 95°C for 15 s, and then 60°C for 1 min. These conditions were repeated for 50 cycles.
Results were expressed in copies/ml and copies/g of total DNA.
(ii) PCR calibration curves and calculation of viral loads.A regressive stan-dard curve was generated using plasmid DNA, as described above, serially
diluted in 10-fold increments from 2 ⫻106
copies to 2 copies/5 l. Cycle
threshold values from clinical WB, PBMC, and plasma extracts were plotted on this curve to determine copies of EBV genome/reaction (copies/rxn). Copies/ml of sample were then calculated according to the following equations:
WB or plasma copies/ml⫽copies/rxn⫻1/0.008 ml of sample/rxn
and
PBMC copies/ml⫽copies/rxn⫻1/0.032 ml of sample/rxn
Based on dilution factors introduced during DNA extraction and amplifica-tion, the lower limit of detection for the assay was 125 viral copies/ml in WB and plasma and 31.25 copies/ml in PBMC. Results of PCR from cellular samples
(WB and PBMC) were normalized to the quantity of input genomic DNA. The
humanRNase Pgene (a single-copy housekeeping gene) was coamplified with
EBV by use of a TaqManRNase Pcontrol reagent kit (Applied Biosystems,
Foster City, CA). Human genomic DNARNase P(Promega, Madison, WI) was
serially diluted from 6⫻105pg to 6 pg DNA per PCR. Following amplification
and generation of a regression curve,RNase Pwas quantified in a manner similar
to that described above for the primary amplification target. Quantification of theRNase Pgene was then used to calculate EBV copies per microgram of input DNA as follows:
Copies/microgram⫽EBV mean quantity/RNase Pquantity mean⫻106
Statistical analysis.Only one sample per patient was included in the compar-ative analysis in order to minimize potential bias. In those patients with multiple positive samples, a single sample was randomly chosen for the analysis using a computer program by which each sample has the same chance to be chosen. This resulted in 122 sample pairs for WB and PBMC, 79 pairs for WB and plasma, and 79 pairs for PBMC and plasma samples. McNemar’s test was used to examine the sensitivity and concordance of EBV viral load levels among any two of the three blood sources, i.e., WB, PBMC, and plasma. A threshold of “zero” was chosen for positive virus detection for the qualitative comparison. In an effort to better understand the relationship between the levels of virus detected among the two sample types that were positive for EBV, regression analysis was performed after
transforming to log10(load plus 1) using ordinary least squares. Only results of
ⱖ125 copies/ml in WB and plasma samples and 31.25 copies/ml in PBMC were
included for analysis. For patients with three or more positive samples, trendings of quantitative values over time were also compared among the different sample types.
RESULTS
Qualitative sensitivities of different sample types for EBV detection. A total of 122 paired samples of WB and PBMC were available for analysis. In 39 of 122 (32%) pairs, EBV genome was detected in both sample types. EBV was detected in 1 of the 2 samples (either in WB or PBMC) in 17 out of 122 (14%) samples. Of these 17 samples, EBV was detected in only 6 WB samples whose matching PBMC was negative, while it was picked up in 11 PBMC samples whose matching WB was negative (Table 1). Among the discordant sample pairs, EBV loads in the 6 positive WB samples ranged fromⱕ125 to 237.5 copies/ml, while EBV loads in the 11 positive PBMC samples were allⱕ31.25 copies/ml (lower limit of detection). McNemar’s test showed no significant difference in test sensitivities be-tween WB and PBMC samples (P⫽0.33).
Test results from 79 samples of plasma were compared to results for matched WB. EBV was detected in both WB and plasma samples in 9 out of 79 (11.4%) sample pairs, while it was detected only in WB in 21 of 79 (26.6%) and only in
[image:2.585.43.284.88.215.2]FIG. 1. Comparison between EBV viral loads in WB and PBMC expressed in log10.
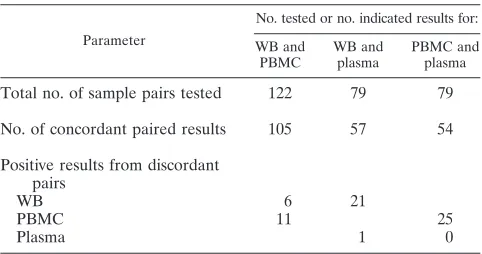
TABLE 1. Comparison of EBV detection using PCR in clinical samples
Parameter
No. tested or no. indicated results for: WB and
PBMC
WB and plasma
PBMC and plasma
Total no. of sample pairs tested 122 79 79
No. of concordant paired results 105 57 54
Positive results from discordant pairs
WB 6 21
PBMC 11 25
Plasma 1 0
on May 16, 2020 by guest
http://jcm.asm.org/
plasma in 1 of 79 (1.3%) samples (Table 1). EBV loads in the 21 positives detected using only WB samples ranged from
ⱕ125 to 2,280 copies/ml. The one viral load that was positive in plasma but negative in WB samples showed⬍125 copies/ml. The use of plasma resulted in significantly reduced sensitivity compared to WB in detecting EBV viral load (P⬍0.0001).
Analysis of the 79 available pairs of PBMC and plasma showed concordant EBV-positive results in 54 out of 79 (12.7%) pairs. Twenty-five of 79 (31.6%) PBMC samples were positive for EBV viral copies, while their matched plasma samples were negative. None of the negative PBMC samples had EBV viral copies detected in matched plasma samples (Table 1). The 25 positive PBMC samples with paired negative plasma samples had viral loads ranging from ⱕ31.25 to 3,228.13 copies/ml that were missed in plasma. Using plasma for EBV detection resulted in reduced sensitivity compared to that obtained with PBMC (P⬍0.0001).
Correlation of viral loads in different sample types.In the quantitative analysis, only four plasma samples had EBV loads greater than the threshold of 125 copies/ml. Therefore, regres-sion analysis was applied only to viral load results of paired WB and PBMC samples which were above the threshold. The cor-relation was significant (P ⬍ 0.05) with an R2 of 0.87, a y
intercept approximating zero (⫺0.27; 95% confidence interval [95% CI],⫺0.98, 0.44), and slope close to 1 (1.06; 95% CI, 0.87, 1.26) (Fig. 1).
The EBV loads quantified for the four positive plasma sam-ples are shown in Table 2 with their matching WB and PBMC samples.
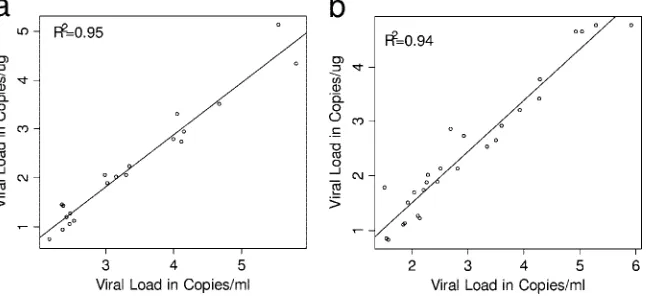
Correlation between reporting units. Regression analysis showed strong correlations between results reported as
cop-ies/ml and copies/g DNA for both WB (R2 ⫽ 0.95) and
PBMC (R2⫽0.94). Linear regression using positive WB
sam-ples showed ayintercept of⫺1.39 (95% CI,⫺1.77,⫺1.01) and a slope of 1.07 (95% CI, 0.96, 1.17). Mean EBV viral concen-trations reported in copies/g DNA were 1.39 log10units lower
than those reported in copies/ml (Fig. 2a). Similar results were obtained from the analysis of positive PBMC samples. Mean EBV viral loads reported in copies/g DNA from PBMC were 0.38 log10units lower than viral loads reported in copies/ml
(intercept,⫺0.38 [95% CI,⫺0.70,⫺0.07]; slope of 0.94 [95% CI, 0.85, 1.04]) (Fig. 2b).
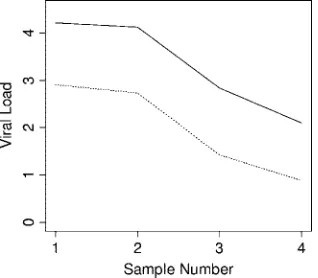
Relative trending within patients. Comparative dynamic trending of EBV viral loads using WB and PBMC sample types was examined for four patients, each of whom had at least three consecutive samples with all results within the linear dynamic range of the assay (Fig. 3). Viral loads tracked closely among both sample types. Similar findings were obtained when comparing within-patient trends using different reporting units (copies/ml and copies/g DNA) (Fig. 4 and 5). Results from 13 patients were available for the latter analysis. Among all 17 cases in which comparisons were made, no differences were seen in dynamic viral load trends.
DISCUSSION
The findings in this study support the value of WB for quantitative detection of EBV by RT-PCR relative to that for paired PBMC and plasma specimens from pediatric hemato-poietic stem cell transplant recipients. The use of WB main-tained test sensitivity and close correlation of viral load results comparable to those for PBMC, while the use of plasma re-sulted in a significant loss of test sensitivity compared with results from the other (cellular) compartments. Dynamic quan-titative trending for WB was similar to that for PBMC, al-though this analysis was limited by the small number of pa-tients with multiple positive samples in the linear detection range of the assay.
[image:3.585.42.284.90.162.2]Previous studies have demonstrated increased sensitivity for EBV detection with the use of cellular compartments com-pared to serum or plasma. PBMC has been shown to have advantages in this respect, and many investigators have used circulating lymphocytes as the specimen of choice (9, 10, 11,
TABLE 2. EBV loads in the four positive plasma samples with corresponding WB and PBMC results
Sample no.
EBV load (copies/ml) in:
Plasma WB PBMC
1 9,640 13,128 19,013
2 130 1,453 845
3 9,151 640,223 827,483
4 1,901 47,501 110,885
FIG. 2. Comparison of the two reporting formats in WB and PBMC, with all viral loads expressed in log10. (a) Comparison between EBV viral
loads of copies/g and copies/ml for WB. (b) Comparison between EBV viral loads of copies/g and copies/ml for PBMC.
on May 16, 2020 by guest
http://jcm.asm.org/
[image:3.585.133.456.557.705.2]19, 20, 22). Fewer investigators have examined the use of WB. Among those studies, results appear largely consistent with the data presented here (24, 25, 27). Stevens et al. (24, 25) dem-onstrated improved sensitivity of WB compared to serum and plasma using quantitative competitive EBV PCR, with acellu-lar samples yielding negative results despite high viral loads in corresponding WB samples (25). Similarly, in a semiquantita-tive comparasemiquantita-tive study, Wadowsky and colleagues (27) showed a strong correlation of EBV DNA load values in WB (TaqMan PCR) and peripheral blood lymphocytes (competitive PCR), while correlation was poor between plasma and peripheral blood lymphocyte viral loads. In contrast, Wagner et al. (29) showed a DNA amplification efficiency and sensitivity lower for WB than for PBMC or B-cell samples. Although results were different from those described above, the latter study included blood from only a limited number of healthy subjects (11 subjects). The relative disadvantage exhibited using WB in that study was felt to be due largely to the presence of inhib-itors, an issue not encountered in our series, possibly as a result of different specimen preparation methodologies. None of the above-described series compared WB, PBMC, and plasma us-ing a sus-ingle real-time quantitative method, and most included very limited numbers of patients and did not address additional issues related to sample reporting format. Some of the
previ-ous studies (23–25, 30, 31) included both pediatric and adult age groups, while the present study was limited to samples from pediatric patients.
[image:4.585.129.456.68.220.2]The relative benefits of various reporting formats for EBV viral load assays are not clear from the literature. Some inves-tigators have used copies per unit volume (25, 27, 31), and others (9, 11, 29–31) have reported in copies/g of genomic DNA (when testing cellular compartments, such as WB or PBMC). The present study showed a close correlation between results reported as copies/g DNA and copies/ml, similar to the findings of Wadowsky et al. (27) in a semiquantitative comparison. Normalizing viral load results to micrograms of input DNA (9) or to the number of cells present requires additional processing steps, increased expense, and increased volume of blood. The findings here suggest that little value is gained in this process. Dynamic trends of viral load within individual patients tracked very closely irrespective of the re-porting units used. This study was limited in scope and design to a comparison of analytical findings using various specimen types and reporting formats. Further work will be needed to correlate these findings with clinical patient status and the presence or progression of lymphoproliferative diseases. Ad-ditional studies should also address the application of findings to the adult patient population.
[image:4.585.343.500.554.695.2]FIG. 3. Comparative trends of EBV viral loads in different sample types from two individual patients (a and b). Solid line, WB; dotted line, PBMC.
FIG. 4. Comparative trends of EBV viral loads in WB from a patient by use of two different reporting units. Solid line, copies/ml; dotted line, copies/g DNA.
FIG. 5. Comparative trends of EBV viral loads in PBMC from a patient by use of two different reporting units. Solid line, copies/ml; dotted line, copies/g DNA.
on May 16, 2020 by guest
http://jcm.asm.org/
[image:4.585.85.244.556.695.2]The use of WB appears to offer potential advantages as the specimen of choice for QRT-PCR detection of EBV. Com-pared with PBMC, WB requires less blood volume and fewer processing steps. In addition, WB shows a significantly im-proved sensitivity and linear dynamic range compared to plasma. The findings in this study may help address the lack of standardization commonly encountered among quantitative molecular diagnostic assays. Further work will be needed to confirm these findings for other patient populations and using other methods. Other studies will also be needed to clarify the implications of these results for the prediction of clinical dis-ease and therapeutic response in both the transplant and non-transplant populations in the context of their respective EBV-related disorders.
ACKNOWLEDGMENTS
This work was supported in part by the American Lebanese Syrian Associated Charities (ALSAC).
The generous support of this work by Phill and Liz Gross is also deeply appreciated. Statistical support and advice provided by S. Pounds is greatly appreciated.
REFERENCES
1.Bai, X., et al.1997. Quantitative polymerase chain reaction for human herpesvirus diagnosis and measurement of Epstein-Barr virus burden in
posttransplant lymphoproliferative disorder. Clin. Chem.43:1843–1849.
2.Baldanti, F., et al.2000. High levels of Epstein-Barr virus DNA in blood of solid-organ transplant recipients and their value in predicting posttransplant
lymphoproliferative disorders. J. Clin. Microbiol.38:613–619.
3.Gallagher, A., et al.1999. Detection of Epstein-Barr virus (EBV) genomes in the serum of patients with EBV-associated Hodgkin’s disease. Int. J. Cancer
84:442–448.
4.Gan, Y. J., J. L. Sullivan, and J. W. Sixbey.1994. Detection of cell-free Epstein-Barr virus DNA in serum during acute infectious mononucleosis.
J. Infect. Dis.170:436–439.
5.Green, M., et al.2000. Predictive negative value of persistent low Epstein-Barr virus viral load after intestinal transplantation in children.
Transplan-tation70:593–596.
6.Green, M., et al.1998. Serial measurement of Epstein-Barr viral load in peripheral blood in pediatric liver transplant recipients during treatment for
posttransplant lymphoproliferative disease. Transplantation66:1641–1644.
7.Gustafsson, A., et al.2000. Epstein-Barr virus (EBV) load in bone marrow transplant recipients at risk to develop posttransplant lymphoproliferative
disease: prophylactic infusion of EBV-specific cytotoxic T cells. Blood95:
807–814.
8.Hanto, D. W., et al.1982. Epstein-Barr virus-induced B-cell lymphoma after renal transplantation: acyclovir therapy and transition from polyclonal to
monoclonal B-cell proliferation. N. Engl. J. Med.306:913–918.
9.Jabs, W. J., et al.2001. Normalized quantification by real-time PCR of Epstein-Barr virus load in patients at risk for posttransplant
lymphoprolif-erative disorders. J. Clin. Microbiol.39:564–569.
10.Kenagy, D. N., et al.1995. Epstein-Barr virus DNA in peripheral blood leukocytes of patients with posttransplant lymphoproliferative disease.
Transplantation60:547–554.
11.Kimura, H., et al.1999. Quantitative analysis of Epstein-Barr virus load by
using a real-time PCR assay. J. Clin. Microbiol.37:132–136.
12.Krieger, N. R., et al.2000. Significance of detecting Epstein-Barr-specific
sequences in the peripheral blood of asymptomatic pediatric liver transplant
recipients. Liver Transplant.6:62–66.
13.Limaye, A. P., et al.1999. Detection of Epstein-Barr virus DNA in sera from transplant recipients with lymphoproliferative disorders. J. Clin. Microbiol.
37:1113–1116.
14.Lo, Y. M., et al.1999. Quantitative analysis of cell-free Epstein-Barr virus DNA in plasma of patients with nasopharyngeal carcinoma. Cancer Res.
59:1188–1191.
15.Lo, Y. M., et al.1999. Quantitative and temporal correlation between cir-culating cell-free Epstein-Barr virus DNA and tumor recurrence in
naso-pharyngeal carcinoma. Cancer Res.59:5452–5455.
16.Lucas, K. G., et al.1998. Semiquantitative Epstein-Barr virus polymerase chain reaction analysis of peripheral blood from organ transplant patients
and risk for the development of lymphoproliferative disease. Blood92:3977–
3978.
17.McDiarmid, S. V., et al.1998. Prevention and preemptive therapy of postransplant lymphoproliferative disease in pediatric liver recipients.
Transplantation66:1604–1611.
18.Niesters, H. G., et al.2000. Development of a real-time quantitative assay for
detection of Epstein-Barr virus. J. Clin. Microbiol.38:712–715.
19.Riddler, S. A., M. C. Breinig, and J. L. McKnight.1994. Increased levels of circulating Epstein-Barr virus (EBV)-infected lymphocytes and decreased EBV nuclear antigen antibody responses are associated with the develop-ment of posttransplant lymphoproliferative disease in solid-organ transplant
recipients. Blood84:972–984.
20.Rooney, C. M., et al.1995. Early identification of Epstein-Barr
virus-associ-ated post-transplantation lymphoproliferative disease. Br. J. Haematol.89:
98–103.
21.Rowe, D. T., et al.1997. Use of quantitative competitive PCR to measure Epstein-Barr virus genome load in the peripheral blood of pediatric
trans-plant patients with lymphoproliferative disorders. J. Clin. Microbiol. 35:
1612–1615.
22.Savoie, A., et al.1994. Direct correlation between the load of Epstein-Barr virus-infected lymphocytes in the peripheral blood of pediatric transplant
patients and risk of lymphoproliferative disease. Blood83:2715–2722.
23.Stevens, S. J., et al.1999. Monitoring of Epstein-Barr virus DNA load in
peripheral blood by quantitative competitive PCR. J. Clin. Microbiol.37:
2852–2857.
24.Stevens, S. J., et al.2002. Comparison of quantitative competitive PCR with LightCycler-based PCR for measuring Epstein-Barr virus DNA load in
clin-ical specimens. J. Clin. Microbiol.40:3986–3992.
25.Stevens, S. J., I. Pronk, and J. M. Middeldorp.2001. Toward standardization of Epstein-Barr virus DNA load monitoring: unfractionated whole blood as
preferred clinical specimen. J. Clin. Microbiol.39:1211–1216.
26. Reference deleted.
27.Wadowsky, R. M., et al.2003. Measurement of Epstein-Barr virus DNA loads in whole blood and plasma by TaqMan PCR and in peripheral blood
lymphocytes by competitive PCR. J. Clin. Microbiol.41:5245–5249.
28.Wagner, H. J., et al.1992. Detection and quantification of latently infected B lymphocytes in Epstein-Barr virus-seropositive, healthy individuals by
polymerase chain reaction. J. Clin. Microbiol.30:2826–2829.
29.Wagner, H. J., et al.2000. Real-time polymerase chain reaction (RQ-PCR) for the monitoring of Epstein-Barr virus (EBV) load in peripheral blood
mononuclear cells. Klin. Padiatr.212:206–210.
30.Wagner, H. J., et al.2002. Longitudinal analysis of Epstein-Barr viral load in plasma and peripheral blood mononuclear cells of transplanted patients by
real-time polymerase chain reaction. Transplantation74:656–664.
31.Wagner, H. J., et al.2001. Patients at risk for development of posttransplant lymphoproliferative disorder: plasma versus peripheral blood mononuclear cells as material for quantification of Epstein-Barr viral load by using
real-time quantitative polymerase chain reaction. Transplantation72:1012–1019.
32.Yamamoto, M., et al.1995. Detection and quantification of virus DNA in plasma of patients with Epstein-Barr virus-associated diseases. J. Clin.
Mi-crobiol.33:1765–1768.