2018 2nd International Conference on Applied Mathematics, Modeling and Simulation (AMMS 2018) ISBN: 978-1-60595-580-3
Game Analysis of Green Technology Implementation with Green
Consumption Preference Considered under Cap-and-Trade Scheme
Yan-chun PAN, Xing-ying LIANG, Yi XIONG
*and Jian-hua MA
Center for Modeling and Optimization of Complex Management Systems (CMOCMS), College of Management, Shenzhen University, Guangdong 518060, P.R. China
*Corresponding author
Keywords: Carbon emissions, Green consumption preference, Green technology.
Abstract. Under the scheme of Cap-and-Trade, carbon emissions have become important constraints that generating companies have to take into consideration when making their operational decisions, especially for the product pricing and green technology selection. In this paper, a two-party (one greener and one dirtier manufacturer) game model with green consumption preference considered is proposed. The equilibrium conditions including optimal prices and selection of green technology under different combinations of strategies are obtained. The study finds that whether greener or dirtier manufacturer will implement green technology mainly depends on different scenarios of cost and carbon emission reduction of green technology, and carbon emission for producing per unit of product. How to establish an effective mechanism to make both manufacturers cooperate in green technology implementation and carbon emission reduction is an interesting future research direction.
Introduction
With the rapid development of human society, the contradiction between environmental protection and economic development has become increasingly prominent. All of the world has taken active actions.China, as a major carbon emitter and the 2nd largest economic entity in the world, has always made active efforts to reduce carbon emissions. China established seven emissions trading pilots under Cap-and-Trade scheme in 2011. Cap-and-Trade is a market-based policy that is released to control carbon emissions [1]. The regulator will allocate an initial emission quota to the generating company at the beginning of the compliance period (e.g. one year). If emission quota is insufficient to the target production, the generating company should pay for the excess at the carbon price.
Under Cap-and-Trade scheme, unit carbon emission turns into an important attribute of product [2]. On the one hand, companies have to control emissions to maximize their revenue. On the other hand, due to the green consumption preference which means consumers are willing to pay higher prices for low-carbon products [3], companies are urged to find effective ways to reduce carbon emissions in order to increase their product competitiveness. In addition, emission permit which can be traded in the carbon market can bring profits like any other production resources. Consequently, Cap-and-Trade scheme directly changes the companies’ profit models, and ultimately affects their behaviors.
In this context, the issue of carbon emissions has become a research hotspot. At the macro level, scholars are mainly concerned with the design and evaluation of carbon emissions’ policies [4] and the evaluation of reduction performance [5] etc. At the micro level, many scholars study the impact of Cap-and-Trade scheme on companies’ behaviors, such as inventory management [6], pricing stagey selection [7] and green technology implementation decision [8] etc. However, these research focus on individual company and do not take the influences by other supply chain members into account. Although there are more and more scholars start to conduct multi-enterprises research [9, 10, 11], few of them cast a view on green technology implementation decision and consider green consumption preference at the same time. Meanwhile, a large amount of studies hold that green technology implementation as a continuous decision, and the cost is a quadratic function of emission reduction
[12]
usually implemented as a project with a fix cost and a reduction rate. Hence, traditional methods can’t describe the real decision-making problems accurately.
According, this paper focuses on product pricing and green technology selection for generating companies. A two-party (one greener and one dirtier manufacturer) game model is proposed in this paper, and the model not only captures the characteristics of green technology implementation, but also takes green consumption preference into consideration.
Problem Description and Modeling
Problem Description
Due to the complexity of the supply chain, this paper only considers two manufacturers. Both of them produce CO2E (Carbon Dioxide Equivalent) during the manufacturing process. According the above problem description, the following assumptions are put forward:
Assumption 1. Two manufacturers produce the same product, but manufacturer 2 is more environmentally friendly than manufacturer 1, so the product of manufacture 2 has lower unit emission ( 𝑒1 > 𝑒2) and higher unit production cost ( 𝑣1 < 𝑣2).
Assumption 2. Green technology implementation decision should be made at the beginning of the compliance period (one year), and the cost of green technology including technology purchasing cost and annual maintenance cost is a fix cost.
Assumption 3. Carbon emission quota trading between two manufacturers is not allowed. Assumption 4. The information between two manufacturers is completely symmetrical.
Notations
The notations used in this paper are given blow.
Parameters (for which values are assumed to be known):
𝑖 = 1,2. Manufacture 1 and manufacture 2.
𝑎𝑖. The market capacity of products.
𝑏. The price elasticity of product demand.
𝜆. The green consumption preference.
𝑟. The reduction rate of carbon emissions after implement green technology. 0 < 𝑟 < 1.
𝑒𝑖, 𝑒3−𝑖. Unit carbon emission.
𝑐. The cost of green technology
𝑣𝑖. Unit production cost.
𝑝𝑐. Carbon price.
𝑞𝑖. Carbon emission quota.
Decision variables (for which values are obtained from the model solution):
𝑝𝑖, 𝑝3−𝑖. The price of product.
𝑧𝑖, 𝑧3−𝑖. Decision of whether to implement green technology or not, 1 for implementation, 0 for not.
Mathematical Model
Manufacturers are constrained by Cap-and-Trade scheme, so their profit functions are composed of four parts: sales revenue, production cost, green technology cost and excessive emission cost. The objective of each manufacturer is to maximize its profit.
Objective function:
𝐦𝐚𝐱 𝝅𝒊 = 𝒑𝒊𝑫𝒊− 𝒗𝒊𝑫𝒊− 𝒛𝒊𝒄 − 𝒑𝒄[𝑫𝒊𝒆𝒊(𝟏 − 𝒓𝒛𝒊) − 𝒒𝒊]. (1)
𝐷𝑖 is the market demands of product.
𝑝𝑖, 𝑝3−𝑖 > 0. (4) Solving the equations can yield the second derivation for manufacturers 1 and 2 as follows.
𝑑2𝜋1
𝑑𝑝12 = −2𝑏 < 0. (5)
𝑑2𝜋 2
𝑑𝑝22 = −2𝑏 < 0. (6)
The profit functions are concave, so the optimal price and profit functions can be acquired.
𝑝1∗ =𝑎1+𝑏𝑝2−𝜆𝑒1(1−𝑟𝑧1)+𝜆𝑒2(1−𝑟𝑧2)+𝑏[𝑣1+𝑝𝑐𝑒1(1−𝑟𝑧1)]
2𝑏 . (7)
𝑝2∗ =𝑎2+𝑏𝑝1−𝜆𝑒2(1−𝑟𝑧2)+𝜆𝑒1(1−𝑟𝑧1)+𝑏[𝑣2+𝑝𝑐𝑒2(1−𝑟𝑧2)]
2𝑏 . (8)
𝜋1∗ = 𝑝
𝑐𝑞1− 𝑧1𝑐 +{𝑎1+𝑏𝑝2−𝜆𝑒1(1−𝑟𝑧1)+𝜆𝑒2(1−𝑟𝑧2)−𝑏[𝑣1+𝑝𝑐𝑒1(1−𝑟𝑧1)]}
2
4𝑏 . (9)
𝜋2∗ = 𝑝
𝑐𝑞2− 𝑧2𝑐 +{𝑎2+𝑏𝑝1−𝜆𝑒2(1−𝑟𝑧2)+𝜆𝑒1(1−𝑟𝑧1)−𝑏[𝑣2+𝑝𝑐𝑒2(1−𝑟𝑧2)]}
2
4𝑏 . (10)
Payoff Matrix
Four combinations of green technology implementation strategies are discussed. Strategies combination 1. None of the manufacturers implements green technology.
𝜋1∗|
𝑧1=0,𝑧2=0 = 𝑝𝑐𝑞1+
{2𝑎1+𝑎2+𝑏[𝑝𝑐(𝑒2−𝑒1)−𝑣1+𝑣2]+𝜆(𝑒2−𝑒1)}2
9𝑏 . (11)
𝜋2∗|
𝑧1=0,𝑧2=0= 𝑝𝑐𝑞2+
{𝑎1+2𝑎2+𝑏[𝑝𝑐(𝑒1−𝑒2)+𝑣1−𝑣2]+𝜆(𝑒1−𝑒2)}2
9𝑏 . (12)
Strategies combination 2. Manufacturer 1 implements green technology, while manufacturer 2 does not.
𝜋1∗|𝑧1=1,𝑧2=0 = 𝑝𝑐𝑞1− 𝑐 +
{2𝑎1+𝑎2+𝑏{𝑝𝑐[𝑒2−𝑒1(1−𝑟)]−𝑣1+𝑣2}+𝜆[𝑒2−𝑒1(1−𝑟)]}2
9𝑏 . (13)
𝜋2∗|
𝑧1=1,𝑧2=0= 𝑝𝑐𝑞2+
{𝑎1+2𝑎2−𝑏{𝑝𝑐[𝑒2−𝑒1(1−𝑟)]−𝑣1+𝑣2}−𝜆[𝑒2−𝑒1(1−𝑟)]}2
9𝑏 . (14)
Strategies combination 3. Manufacturer 2 implements green technology, while manufacturer 1 does not.
𝜋1∗|
𝑧1=0,𝑧2=1 = 𝑝𝑐𝑞1+
{2𝑎1+𝑎2−𝑏{𝑝𝑐[𝑒1−𝑒2(1−𝑟)]+𝑣1−𝑣2}−𝜆[𝑒1−𝑒2(1−𝑟)]}2
9𝑏 . (15)
𝜋2∗|
𝑧1=0,𝑧2=1= 𝑝𝑐𝑞2− 𝑐 +
{𝑎1+2𝑎2+𝑏{𝑝𝑐[𝑒1−𝑒2(1−𝑟)]+𝑣1—𝑣2}+𝜆[𝑒1−𝑒2(1−𝑟)]}2
9𝑏 . (16)
Strategies combination 4. Both manufacturers implement green technology.
𝜋1∗|
𝑧1=1,𝑧2=1 = 𝑝𝑐𝑞1− 𝑐 +
{2𝑎1+𝑎2−𝑏[𝑝𝑐(𝑒1−𝑒2)(1−𝑟)+𝑣1−𝑣2]−𝜆(𝑒1−𝑒2)(1−𝑟)}2
9𝑏 . (17)
𝜋2∗|
𝑧1=1,𝑧2=1= 𝑝𝑐𝑞2− 𝑐 +
{𝑎1+2𝑎2+𝑏[𝑝𝑐(𝑒1−𝑒2)(1−𝑟)+𝑣1−𝑣2]+𝜆(𝑒1−𝑒2)(1−𝑟)}2
9𝑏 . (18)
Table 1. The payoff matrix of green technology implementation strategies for manufacturer 1 and 2.
manufacturer 1 Not implementmanufacturer 2implement
Not implement
First quadrant 𝜋1∗|𝑧1=0,𝑧2=0 𝜋2∗|𝑧1=0,𝑧2=0
Second quadrant 𝜋1∗|𝑧1=0,𝑧2=1 𝜋2∗|𝑧1=0,𝑧2=1
implement
Third quadrant 𝜋1∗|𝑧1=1,𝑧2=0
𝜋2∗|𝑧1=1,𝑧2=0
Fourth quadrant 𝜋1∗|𝑧1=1,𝑧2=1
𝜋2∗|𝑧1=1,𝑧2=1
Model Analysis
Because manufacturer 1 and 2 have the characteristics of limited rationality and mutual influence, and the strategies chosen at the beginning are not necessarily the optimal strategies, two players will eventually come into equilibrium after constantly learning and strategies selecting. In this paper two strategies combinations’ equilibrium conditions (Fourth and First quadrant) are analyzed.
Fourth Quadrant
Two manufacturers achieve the equilibrium requirement under the strategies combination (𝒛𝟏=
𝟏, 𝒛𝟐= 𝟏) while satisfying the following two conditions simultaneously.
𝜋1∗|
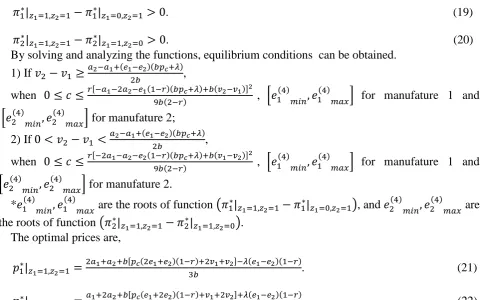
𝑧1=1,𝑧2=1− 𝜋1∗|𝑧1=0,𝑧2=1 > 0. (19)
𝜋2∗|
𝑧1=1,𝑧2=1− 𝜋2∗|𝑧1=1,𝑧2=0> 0. (20)
By solving and analyzing the functions, equilibrium conditions can be obtained.
1) If 𝑣2− 𝑣1 ≥𝑎2−𝑎1+(𝑒12𝑏−𝑒2)(𝑏𝑝𝑐+𝜆),
when 0 ≤ 𝑐 ≤𝑟[−𝑎1−2𝑎2−𝑒1(1−𝑟)(𝑏𝑝𝑐+𝜆)+𝑏(𝑣2−𝑣1)]
2
9𝑏(2−𝑟) , [𝑒1
(4) 𝑚𝑖𝑛, 𝑒1
(4)
𝑚𝑎𝑥] for manufature 1 and
[𝑒2(4)𝑚𝑖𝑛, 𝑒2(4)𝑚𝑎𝑥] for manufature 2;
2) If 0 < 𝑣2 − 𝑣1 < 𝑎2−𝑎1+(𝑒12𝑏−𝑒2)(𝑏𝑝𝑐+𝜆),
when 0 ≤ 𝑐 ≤𝑟[−2𝑎1−𝑎2−𝑒2(1−𝑟)(𝑏𝑝𝑐+𝜆)+𝑏(𝑣1−𝑣2)]
2
9𝑏(2−𝑟) , [𝑒1
(4) 𝑚𝑖𝑛, 𝑒1
(4)
𝑚𝑎𝑥] for manufature 1 and
[𝑒2(4)𝑚𝑖𝑛, 𝑒2(4)𝑚𝑎𝑥] for manufature 2.
*𝑒1(4)𝑚𝑖𝑛, 𝑒1(4)𝑚𝑎𝑥 are the roots of function (𝜋1∗|𝑧1=1,𝑧2=1− 𝜋1∗|𝑧1=0,𝑧2=1), and 𝑒2
(4) 𝑚𝑖𝑛, 𝑒2
(4)
𝑚𝑎𝑥 are
the roots of function (𝜋2∗|𝑧1=1,𝑧2=1− 𝜋2∗|𝑧1=1,𝑧2=0). The optimal prices are,
𝑝1∗|
𝑧1=1,𝑧2=1=
2𝑎1+𝑎2+𝑏[𝑝𝑐(2𝑒1+𝑒2)(1−𝑟)+2𝑣1+𝑣2]−𝜆(𝑒1−𝑒2)(1−𝑟)
3𝑏 . (21)
𝑝2∗|
𝑧1=1,𝑧2=1=
𝑎1+2𝑎2+𝑏[𝑝𝑐(𝑒1+2𝑒2)(1−𝑟)+𝑣1+2𝑣2]+𝜆(𝑒1−𝑒2)(1−𝑟)
3𝑏 . (22)
First Quadrant
Two manufacturers achieve the equilibrium requirement under the strategies combination (𝒛𝟏=
𝟎, 𝒛𝟐= 𝟎) while satisfying the following two conditions simultaneously.
𝜋1∗|
𝑧1=1,𝑧2=0− 𝜋1∗|𝑧1=0,𝑧2=0 < 0. (23)
𝜋2∗|
1.1) when 0 ≤ 𝑐 <𝑟[−𝑎1−2𝑎2−𝑒1(𝑏𝑝𝑐+𝜆)+𝑏(𝑣2−𝑣1)]
2
9𝑏(2−𝑟) , (0, 𝑒1
(1)
𝑚𝑖𝑛) ∪ (𝑒1 (1)
𝑚𝑎𝑥, +∞) for manufature
1 and (0, 𝑒2(1)𝑚𝑖𝑛) ∪ (𝑒2(1)𝑚𝑎𝑥, +∞) for manufature 2;
1.2) when 𝑐 > 𝑟[−2𝑎1−𝑎2−𝑒2(𝑏𝑝𝑐+𝜆)+𝑏(𝑣1−𝑣2)]
2
9𝑏(2−𝑟) , (0, +∞) for both manufature 1 and 2;
2) If 0 < 𝑣2− 𝑣1 <𝑎2−𝑎1+(𝑒12𝑏−𝑒2)(𝑏𝑝𝑐+𝜆),
2.1) when 0 ≤ 𝑐 <𝑟[−2𝑎1−𝑎2−𝑒2(𝑏𝑝𝑐+𝜆)+𝑏(𝑣1−𝑣2)]
2
9𝑏(2−𝑟) , (0, 𝑒1
(1)
𝑚𝑖𝑛) ∪ (𝑒1(1)𝑚𝑎𝑥, +∞) for manufature
1 and (0, 𝑒2(1)𝑚𝑖𝑛) ∪ (𝑒2(1)𝑚𝑎𝑥, +∞) for manufature 2;
2.2) when 𝑐 > 𝑟[−𝑎1−2𝑎2−𝑒1(𝑏𝑝𝑐+𝜆)+𝑏(𝑣2−𝑣1)]
2
9𝑏(2−𝑟) , (0, +∞) for both manufature 1 and 2.
*𝑒1(1)𝑚𝑖𝑛, 𝑒1(1)𝑚𝑎𝑥 are the roots of function (𝜋1∗|𝑧1=1,𝑧2=0− 𝜋1∗|𝑧1=0,𝑧2=0), and 𝑒2
(1) 𝑚𝑖𝑛, 𝑒2
(1)
𝑚𝑎𝑥 are
the roots of function (𝜋2∗|𝑧1=0,𝑧2=1− 𝜋2∗|𝑧1=0,𝑧2=0) The optimal prices are ,
𝑝1∗|
𝑧1=0,𝑧2=0=
2𝑎1+𝑎2+𝑏[𝑝𝑐(2𝑒1+𝑒2)+2𝑣1+𝑣2]+𝜆(𝑒2−𝑒1)
3𝑏 . (25)
𝑝2∗|
𝑧1=0,𝑧2=0=
𝑎1+2𝑎2+𝑏[𝑝𝑐(2𝑒2+𝑒1)+𝑣1+2𝑣2]+𝜆(𝑒1−𝑒2)
3𝑏 . (26)
Conclusion and Discussion
This study proposed a two-party game model to help generating companies make decisions on pricing and green technology implementation under the Cap-and-Trade scheme. The theoretical analysis reveals some interesting and valuable results. (1) Under different scenarios, either the cleaner manufacturer or the dirtier manufacturer may implement green technology, or both of them will (not) implement green technology. (2) The cost of green technology is a main factor that influence companies’ selection of green technology. Because if the cost is too high, the profits they make when implement green technology will even lower than they are not implement. Therefore, with the development of green technology, the cost of it may decline, and the probability of companies implement green technology would increase. (3) Unit carbon emission is also a very crucial factor. For example, in the fourth quadrant, only manufacturer with some specific ranges of unit carbon emission will implement green technology. If the unit carbon emission is too high or too low, the manufacturer will not implement green technology because of the tradeoff between implementation cost and revenue. Namely, high unit carbon emission leads to low production quantity, which is not profitable similarly with low unit carbon emission for implementing green technology.
Even though some results have been obtained, due to the complexity of the problem, several follow-up studies can be conducted. First of all, joint emission reduction between two manufacturers can be studied. Considering when they implement green technology together, and how they share the cost. Secondly, different impacts of government policies, such as emission allowance, on the game among supply chain members can be investigated. Lastly, a retailer can be added to analyze whether the retailer would share the cost of green technology and what is the cost-sharing mechanism.
Acknowledgement
References
[1] He Yanyi, Wang Lizhi, Wang Jianhui. Cap-and-trade vs. carbon taxes: a quantitative comparison from a generation expansion planning perspective [J]. Computers & Industrial Engineer, 2012, 63 (3):708-716.
[2] Du Shaofu, Zhu Lili, Liang Liang, Ma Fang. Emission-dependent supply chain and environment-policy-making in the ‘cap-and-trade’ system [J]. Energy Policy, 2013, 57: 61–67.
[3] Cohen M A, Vandenbergh M P. The potential role of carbon labeling in a green economy [J]. Energy Economics, 2012, 34(1): 53–63.
[4] Bode S. Multi-period emissions trading in the electricity sector: Winners and losers [J]. Energy Policy, 2006, 34(6):680-691.
[5] Liu Minglei, Zhu Lei, Fan Ying. Evaluation of carbon emission performance and estimation of marginal CO2 abatement costs for provinces of China: A non-parametric distance function approach
[J], China Soft Science, 2011, 3:106-114.
[6] Dobos I. The effects of emission trading on production and inventories in the Arrow-Karlin mode [J]. International Production Economics, 2005, 93-94(8):301-308.
[7] Benjaafar S, Li Y, Daskin M. Carbon footprint and the management of supply chains: insights from simple models [J]. IEEE Transaction, 2013, 10(1):99-116.
[8] Perino G, Requate T. Does more stringent environmental regulation induce or reduce technology adoption? When the rate of technology adoption is inverted U-shaped [J].Journal of Environmental Economics and Management, 2012, (64):456-467.
[9] Xia Liangjie, Zhao Daozhi, Li Youdong. Game on jointly emission reduction based on transfer payment contract between the supplier and the manufacturer [J]. Systems Engineering, 2013, 31(8):39-46.
[10] Huo Yanfang, Han Lin, Qi Ershi. Research on decision-making of low carbon supply chain with budget constraints [J]. Industrial Engineering and Management, 2015, 20(2):54-61.
[11] Li Jian, Su Qin, Ma Li. The research of carbon trading model on supply chain under carbon emission constraints [J]. Chinese Journal of Management Science, 2016, 24(4):54-61.