Guiding the design and application of new materials for enhancing sustainability performance: Framework and infrastructure application
Gregory A. Keoleian1, Alissa M. Kendall1, Michael D. Lepech2 and Victor C. Li2
1Center for Sustainable Systems, School of Natural Resources and Environment,
University of Michigan, 440 Church Street, Ann Arbor, Michigan, 48109-1041 U.S.A
2Department of Civil and Environmental Engineering,
University of Michigan, 2350 Hayward Street, Ann Arbor, Michigan, 48109-2125 U.S.A
ABSTRACT
This paper presents a framework for guiding the design of new materials to enhance the sustainability of systems that utilize these materials throughout their production, use and retirement. Traditionally, materials engineering has focused on the interplay between material microstructure, physical properties, processing, and performance. Environmental impacts related to the system’s life cycle are not well integrated into the materials engineering process. To address this shortcoming, a new methodology has been developed that incorporates social, economic, and environmental indicators – the three dimensions of sustainability. The proposed framework accomplishes this task and provides a critical tool for use across a broad class of materials and applications. Material properties strongly shape and control sustainability performance throughout each life cycle stage including materials production,
manufacturing, use and end-of-life management. Key material parameters that influence life cycle energy, emissions, and costs are highlighted. The proposed framework is demonstrated in the design of engineered cementitious composites, which are materials being developed for civil infrastructure applications including bridges, roads, pipe and buildings. This research is part of an NSF MUSES (Materials Use: Science, Engineering and Society) Biocomplexity project on sustainable concrete infrastructure materials and systems (http://sci.umich.edu).
INTRODUCTION
Sustainability Challenge for New Materials and MUSES
Sustainability in use of material resources has three components: (1) relationship between rate of resource consumption and the overall stock of resources, (2) effectiveness of resource use in providing essential services, and (3) the proportion of resources that leak from the economy and their impacts on the environment. There are a number of indicators raising concerns about the sustainability of materials use in the U.S. and globally [1]. For example, consumption of raw materials in the United States rose from 2 to 2.8 billion metric tons from 1970 to 1995, while world consumption nearly doubled from 5.7 billion to 9.5 billion metric tons. On a weight basis, the use of nonrenewable materials has increased dramatically (from 69% to 95% over the last century) as the U.S. economy shifted from an agricultural to industrial base. Furthermore, the ratio of global reserves over present mine production rates is an indicator of the adequacy of mineral supply and ranges from over a century (e.g., iron ore, bauxite) to less than 25 years (e.g., silver, zinc). These select indicators characterize the sustainability challenges for many materials. The NSF MUSES Materials Use: Science, Engineering, & Society (MUSES) Biocomplexity Program is a recent initiative established to enhance the sustainability of materials resource use.
Concrete Infrastructure Materials
Concrete infrastructure materials and systems give rise to significant effects on social, environmental, and economic sustainability indicators [2,3]. For example, output of construction-related concrete exceeds 12 billion tons per year globally [4]. This enormous volume represents huge flows of material between natural and human systems, which are expected to increase significantly as world population urbanizes [5]. Cement production is very energy intensive and accounts for 5% of global anthropogenic CO2 emissions [6,7] and significant levels of SO2, NOx, particulate matter and other pollutants [8,9,10].
Further, concrete’s brittleness and limited durability lead to significant infrastructure failure and repair. One-third of US roadways are in poor condition [2], burdening society with large capital investments and construction-related impacts such as congestion [11]. These broad economic, environmental, and social consequences have largely been ignored in materials R&D. Development and application of new materials has focused almost exclusively on the interplay between material microstructure, physical properties, processing, performance, and cost. This is a considerable shortcoming, particularly as new materials are sought to supplement or replace concrete given its inherent brittleness and limited durability.
In addition to presenting the conceptual integrated materials design framework, this paper
demonstrates its application for designing a new material for a bridge deck. This study compared two bridge deck systems: one with conventional concrete (CC) joints, the other with engineered cementitious composite (ECC) link slabs. ECC is a unique fiber-reinforced cementitious material with a microstructure design driven by micromechanical principles [12,13] Unlike other concrete materials, ECC strain-hardens after first cracking, similar to a ductile metal, and demonstrates a strain capacity 500-600 times greater than normal concrete [14]. ECC contains ingredients similar to those in fiber-reinforced concrete (e.g., water, cement, sand, fiber and chemical additives); coarse aggregates are notably absent in ECC, while other ingredients are tailored for optimal composite tensile ductility. The amount of fiber (e.g., polyvinyl alcohol and polyethylene) in ECC is generally 2% or less by volume.
INTEGRATED MATERIALS DESIGN FRAMEWORK FOR INFRASTRUCTRE SYSTEMS
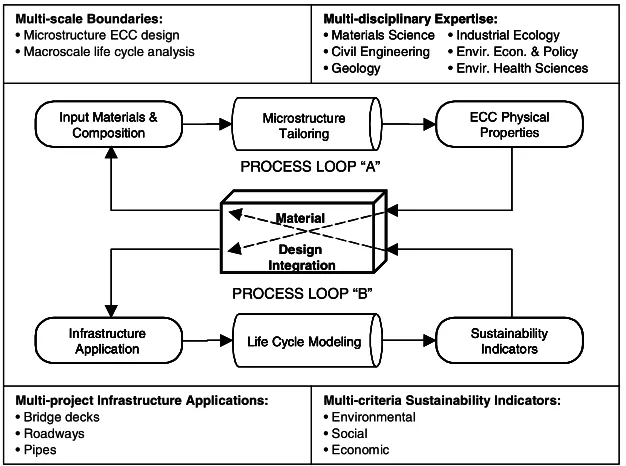
Figure 1. Integrated Materials Design Framework for Sustainable Infrastructure
The conceptual framework in Figure 1 integrates microscale material science and engineering research with macroscale life cycle modeling. Within this framework, Process Loop “A” embodies both materials science and materials engineering at microscale levels. Within Process Loop “A”, virgin material components and appropriate waste material substitutes are identified and screened. These materials are then tailored using micromechanical principles to achieve desired mechanical properties such as tensile strain capacity or strength. The properties of this green material must match with the demands of the infrastructure application for which the material is developed.
Process Loop “B” embodies both design engineers and life cycle analysts working on macroscale levels. Loop “B” starts with the selected application, and a complete life-cycle modeling of the modified infrastructure system is performed to examine the effect of the new green material on infrastructure system sustainability. Finally, these results are used as feedback for the selection of different substitution materials for iteration. The linking of the two process loops underlies the collaborative framework that embodies a complete optimization procedure for the development and implementation of sustainable infrastructure materials and systems. The interfacing between the various disciplines involved with this collaboration will be highlighted in further detail.
Microscale Materials Development (Process Loop “A”)
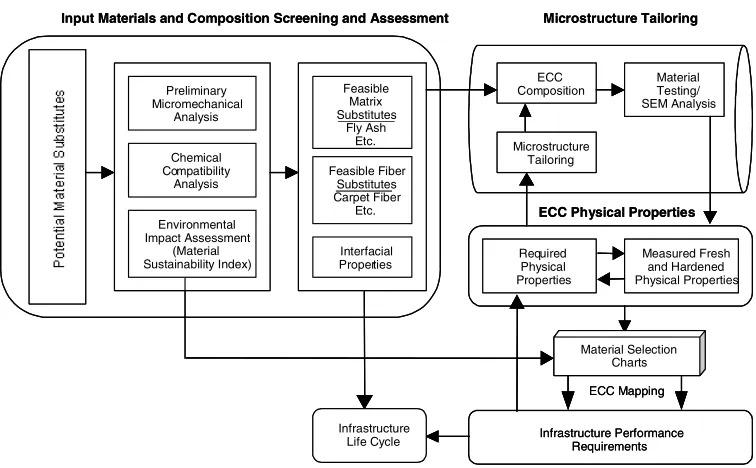
This procedure diagramed in Figure 2 begins with the assembly of a large pool of potential materials which pass through a preliminary screening phase in which three factors are evaluated; mechanical properties, chemical properties, and environmental sustainability. Mechanical properties include the strength or stiffness of the various materials. Preliminary chemical analysis accounts for any adverse interactions the replacement materials may have with other components or the intended application environment. Environmental sustainability is evaluated through Material Production Sustainability
Indices (MSI). MSI values represent such environmental indicators as global warming potential (kg CO2
equiv/kg material), or energy intensity (MJ of primary energy/kg material), without regard for the
application, and allow for comparison of different materials on a mass basis. The relatively small number of materials which remain after screening are then subjected to a micromechanical design procedure in which micromechanical principles are used to tailor the various components of the composite at the microstructural level to achieve the exact material performance desired (i.e. strength, ductility, etc.).
Multi-scale Boundaries: • Microstructure ECC design • Macroscale life cycle analysis
Multi-criteria Sustainability Indicators: • Environmental
• Social • Economic Multi-project Infrastructure Applications:
• Bridge decks • Roadways • Pipes
Multi-disciplinary Expertise: • Materials Science • Civil Engineering • Geology
• Industrial Ecology • Envir. Econ. & Policy • Envir. Health Sciences
Material Design Integration Input Materials &
Composition Microstructure Tailoring ECC Physical Properties Infrastructure Application Sustainability Indicators Life Cycle Modeling
PROCESS LOOP “A”
PROCESS LOOP “B”
Multi-scale Boundaries: • Microstructure ECC design • Macroscale life cycle analysis
Multi-criteria Sustainability Indicators: • Environmental
• Social • Economic Multi-project Infrastructure Applications:
• Bridge decks • Roadways • Pipes
Multi-disciplinary Expertise: • Materials Science • Civil Engineering • Geology
• Industrial Ecology • Envir. Econ. & Policy • Envir. Health Sciences Multi-disciplinary Expertise:
• Materials Science • Civil Engineering • Geology
• Industrial Ecology • Envir. Econ. & Policy • Envir. Health Sciences
Material Design Integration Input Materials &
Composition Microstructure Tailoring ECC Physical Properties Infrastructure Application Sustainability Indicators Life Cycle Modeling
PROCESS LOOP “A”
PROCESS LOOP “B”
Material Design Integration Input Materials &
Composition Input Materials &
Composition Microstructure Tailoring Microstructure Tailoring ECC Physical Properties ECC Physical Properties Infrastructure Application Sustainability Indicators Life Cycle Modeling
Infrastructure Application Infrastructure Application Sustainability Indicators Sustainability Indicators Life Cycle Modeling
Life Cycle Modeling
PROCESS LOOP “A”
Using this micromechanical toolbox, green substitutes, which have passed through preliminary screening processes can then be evaluated more rigorously and incorporated within existing materials without unnecessarily degrading mechanical or environmental load resistance. In many circumstances, the use of recycled waste products is perceived as sacrificing high performing materials made with virgin raw materials for sake of minimizing environmental impacts. However, by making full use of quantitative links between material microstructure and composite properties this does not need to be the case. Through careful control and compensation for the microscale effects of recycled waste materials, the impacts of using these materials can be either minimized or even used to improve the overall material performance. In this regard, such improvements in material sustainability may be called “smart greening”, as they effectively increase the sustainability of materials while not sacrificing traditional material performance.
Figure 2. Microscale materials development approach
Once microstructural tailoring is completed, the newly developed composite is tested for overall mechanical performance and resistance to environmental loads. This is done through traditional
mechanical tests (i.e. uniaxial compression, unaxial tension, bending), resistance to chemical exposures, and durability under harsh environmental conditions. These tests provide basic information on
mechanical properties for material selection charts. These charts, similar to those developed by Ashby [15] plot the MSI values mentioned previously versus mechanical performance.
Throughout this microstructural tailoring and composite testing process, “smart” green materials are developed with consideration for the intended infrastructure application. This procedure accounts for the load “demand”, mechanical, environmental, or otherwise, ultimately placed upon materials by the intended structural application by deliberately tailoring the “supply” of resistance provided by a specific material. Through an efficient pairing of structural demands with material resistance supply, the most efficient structural/materials solution can be achieved in terms of material performance and environmental impacts as measured through MSI values. This process, which allows green materials development to be driven by ultimate structural performance requirements, including economic, social, or environmental costs evaluated through the full life cycle analysis of the engineered system, can only be carried out through the close integration of Process Loops “A” and “B”. To begin evaluating the demands required by a specific application, the set of failure limit states are reviewed. In this regard, both ultimate and serviceability limit states are considered and the ultimate failure mode of the structure determined.
Input Materials and Composition Screening and Assessment Microstructure Tailoring
Measured Fresh and Hardened Physical Properties Required Physical Properties Environmental Impact Assessment (Material Sustainability Index) Preliminary Micromechanical Analysis Chemical Compatibility Analysis Feasible Matrix Substitutes Fly Ash Etc. Feasible Fiber Substitutes Carpet Fiber Etc. Interfacial Properties ECC Composition Microstructure Tailoring Material Testing/ SEM Analysis Infrastructure Performance Requirements
ECC Physical Properties
ECC Mapping Material Selection
Charts
Infrastructure Life Cycle
Input Materials and Composition Screening and Assessment Microstructure Tailoring
Measured Fresh and Hardened Physical Properties Required Physical Properties Environmental Impact Assessment (Material Sustainability Index) Preliminary Micromechanical Analysis Chemical Compatibility Analysis Feasible Matrix Substitutes Fly Ash Etc. Feasible Fiber Substitutes Carpet Fiber Etc. Interfacial Properties ECC Composition Microstructure Tailoring Material Testing/ SEM Analysis Infrastructure Performance Requirements
ECC Physical Properties
ECC Mapping Material Selection
Charts
Finally, using the material demands associated with the dominant failure mode identified earlier in combination with the composite material properties of each green material, a quantitative service life estimate based on the material components of composite can be calculated. This is done by estimating the length of time or number of load cycles until the dominant structure failure mechanism is no longer resisted by the experimentally determined green material properties. For example, this service life
estimation may be a function of the random distribution of overloads over time, the number of load cycles to fatigue failure, or the rate of transport of corrosive agents. Ultimately, this service life estimation serves as one point of interaction between structural designers and life cycle analysts.
Macroscale Life Cycle Modeling of Sustainability Performance of Infrastructure Application (“Process Loop B”)
The sustainability performance of a new material is assessed for a specific infrastructure application. This evaluation requires a characterization of the infrastructure system including specification of the construction and reconstruction processes, use parameters such as traffic flow, estimated service life, and a reconstruction schedule. Once the system has been defined, life cycle modeling techniques including life cycle assessment and life cycle cost analysis can be applied to evaluate environmental, social and economic indicators.
Life cycle assessment (LCA) is an analytical framework for measuring environmental and social impacts of a product system or technology [16]. A product system life cycle can be broken down into four generalized phases including raw material acquisition, production, use, final disposal or recycling, and the transportation needed between these phases. The life cycle of a bridge deck application can be more specifically characterized by five key phases: material production, consisting of the acquisition and processing of raw materials into material inputs; the distribution of materials and transportation of
equipment to and from construction sites; the construction and rehabilitation of the bridge deck, including all construction processes and construction related congestion effects; the use phase, which models vehicular travel over the bridge during its service life; and finally the end-of-life phase, which assesses demolition of the bridge deck, transportation of the material to a landfill or recycling facility, and processing of the materials. In this study the use phase is characterized by the traffic that flows over the bridge deck, so essentially this is a traffic phase. Traffic during non-construction periods is considered a baseline for user time and other traffic related measures, and thus the user, or traffic, phase is measured as it differs from baseline values. For example, time lost to roadway users is based on the construction related traffic measurements minus the time required for a user to traverse the same distance during non-construction periods.
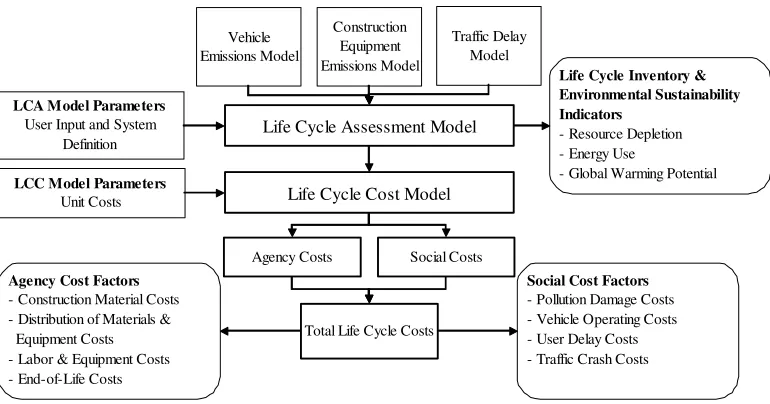
The LCA model was integrated with a life cycle cost (LCC) model. The LCC model utilizes many of the inputs and results of the LCA model to calculate agency, social, and user costs. Agency costs reflect the cost of construction, repair, and demolition to the funding agency; social costs reflect the impacts of the bridge deck on the human health of surrounding populations; and user costs are the result of the time lost to travelers in construction related traffic. The cost model requires data for pollution damage costs, the value of lost time to personal and commercial vehicles delayed in traffic, costs of agency construction activities, and discount rates for social and agency costs. Figure 3 shows the integrated model
framework.
Life Cycle Assessment Model
Vehicle Emissions Model
Construction Equipment Emissions Model
Traffic Delay Model
LCA Model Parameters User Input and System
Definition
Life Cycle Inventory & Environmental Sustainability Indicators
- Resource Depletion - Energy Use
- Global Warming Potential
Life Cycle Cost Model
Agency Costs Social Costs
Agency Cost Factors - Construction Material Costs - Distribution of Materials & Equipment Costs - Labor & Equipment Costs - End-of-Life Costs
Social Cost Factors - Pollution Damage Costs - Vehicle Operating Costs - User Delay Costs - Traffic Crash Costs LCC Model Parameters
Unit Costs
[image:6.612.117.502.72.274.2]Total Life Cycle Costs
Figure 3. Integrated LCA-LCC Model Flow Diagram
APPLICATION OF SUSTAINABLE INTEGRATED MATERIALS DESIGN FRAMWORK TO ECC BRIDGE DECK SYSTEM
Bridge System
The life cycle assessment (LCA) focuses on material production, construction, use, and end-of-life management stages related to bridge deck repair (Figure 4). Consequently, the initial bridge construction, which is common to both conventional and ECC systems, is excluded from this study. For application in this LCA model, the bridge deck service life is assumed to be 30 years for the conventional
steel-reinforced concrete system, and 60 years for the ECC system. The doubling of service life for the ECC system has yet to be validated with additional field and laboratory testing. The bridge deck properties and design specifications are based on estimates provided by a professional construction agency and results from a pilot study sponsored by the Michigan Department of Transportation [20].
Figure 4: Bridge Deck Life Cycle Phases (D = distribution)
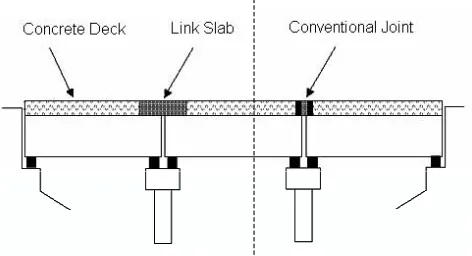
The ECC link slab is three meters long and is poured in direct contact with the adjoining concrete (Figure 5). The conventional joint consists of two steel expansion devices, with a rubber seal between them. There are three main re-construction options for a bridge: bridge deck replacement, deck resurfacing, and repair and maintenance.
Material Production •Mining/Extraction of Raw Materials •Processing
D Construction •Construction Equipment •Construction Related Traffic Congestion •Fuel Production
End of Life •Demolition •Distribution
•Landfilling or Recycling Use
•Vehicle Traffic •Fuel Production Material Production
•Mining/Extraction of Raw Materials •Processing
D
D Construction •Construction Equipment •Construction Related Traffic Congestion •Fuel Production
End of Life •Demolition •Distribution
•Landfilling or Recycling Use
•Vehicle Traffic •Fuel Production
[image:6.612.71.506.493.557.2]Figure 5. Bridge deck with ECC link slab and conventional mechanical steel expansion joint
Engineered Cementitious Composites and Link Slabs
Engineered Cementitious Composites (ECC) are a class of high performance fiber reinforced cementitious composites (HPFRCCs). Recent research on ECC has shown it to be highly durable and well suited for infrastructure applications [21]. The reason for this performance is the ability of ECC to strain harden under uniaxial tension. However, unlike many cement composites, this high tensile strain does not result in large cracks. Instead, many microcracks are formed up to an ultimate strain capacity
typically near 4%. Typically, cracks within ECC open to a maximum of between 50 − 70µm during early
strain hardening (i.e. <1% tensile strain) and remain at that width under additional tensile strain up to failure.
The unique mechanical properties of ECC material can be attributed to deliberate micromechanical tailoring performed on the three phases within the composite; fiber, matrix, and fiber/matrix interface. To take full advantage of the unique mechanical properties of ECC material, an innovative infrastructure application was proposed for comparative life cycle analysis. One of the main durability and maintenance problems confronting departments of transportation nationwide are the continual failure of mechanical expansion joints installed between adjacent simple span bridge decks. While these expansion joints are essential to accommodate the large thermal deformations of the nearby decks, their tendency to quickly fall into disrepair and eventually leak is a constant source of deterioration of the entire superstructure. Water from the deck, saturated with de-icing salts during cold weather, leaks through deteriorated joints and ultimately corrodes the ends of steel girders, or penetrates into precast concrete girders and corrodes the reinforcing steel.
To allow designers to maintain simple span design assumptions, and allow for retrofitting of existing bridge structures, the use of ECC “link slabs”, rather than mechanical expansion joints between adjacent bridge spans, has been proposed. By removing the expansion joint and replacing a portion of the two adjacent decks with section of ECC material overtop the bridge piers, a continuous deck surface is constructed. The unique capability of ECC material to deform up to 4% strain in uniaxial tension while maintaining low crack widths allows the ECC link slab to accommodate the deformations imposed by the adjacent decks (i.e. due to thermal expansion and contraction) while protecting the underlying
superstructure and substructure from corrosives present on the deck surface.
computations, the strain demand in tension and compression upon the ECC link slab, allowing for a safety factor of two, is 2% and 0.5% respectively.
Along with these ultimate limit state material demands, which come from structural mechanics, demands imposed by the serviceability limit state must also be considered. To calculate the service life of a steel reinforced ECC bridge element, a mechanistic corrosion model adapted from reinforced concrete deterioration models subjected to chloride exposure by Liu and Weyers [22] was adopted. This model allows for calculation of service life between the time when a reinforced concrete element is exposed to chlorides up to the time when cracking due to rusting reinforcement exceeds limits set by building codes. For strain-hardening ECC materials however, this crack widening limit state was replaced by the tensile strain capacity of the ECC being overcome by the rusting, expanding steel reinforcement. Using this model, a tensile strain capacity of 2.6% was shown to be the minimum for 40 years of uninterrupted service life. This limit of 40 years was determined using empirical bridge deterioration models and Michigan Department of Transportation capital maintenance timelines. Ultimately, a tensile strain capacity of 2.6% with a compressive strain of 0.5% and compressive strength of at least 35MPa were selected as minimum material requirements for the link slab application.
One of the most challenging aspects within a collaborative design process such as this is achieving a seamless flow of information between material scientists, structural designers, and life cycle analysts. Within this work, information has been transferred on a number of fronts. These include:
• Providing material mix design components for environmental impact assessments of constituent
materials and potentially green substitutes
• Creating quantitative service life estimations based on composite material properties, which in
turn are based on material composition
• Adjusting construction/fabrication methodologies to meet the different demands of new materials
• Accounting for different demolition/reuse/recycling at the end of life due to the use of new
materials
• Providing material scientists with specific results from a complete system life cycle analysis which suggest quantifiable changes in constituent materials or proportions.
Of these interaction points, the most critical is the creation of quantitative service life estimation. While it is common to estimate the service life of engineered systems based on past performance of similar systems in similar environments, the multiscale approach necessary to calculate changes in service life due to changes in constituent material properties is rare. This ability to relate material changes to service life extension or shortening is a cornerstone of this collaborative framework. As outlined
previously, the formation of such service life estimations rests upon the identification of dominant failure modes, whether due to ultimate or serviceability limit state failure, the relation of these failure modes to specific material properties, and finally the matching of material property demands to the pool of potential materials available.
In addition to the formation of service life models, the ability of life cycle analysts to close the collaborative loop is also essential. This requires that such analysis produces quantitative
recommendations on a number of design issues. As an example, material intensive uses with low load demands such as pavements may require highly green materials which sacrifice material properties while applications which target green material use in critical elements may require less greening with higher material properties and longer service life.
Life cycle assessment model
Life cycle assessment is an analytical technique for evaluating the full environmental burdens and impacts associated with a product system [16]. Modeling the complete life cycle of a bridge system is complex and data intensive. Data sets necessary for modeling the material production phase were
obtained from various sources including the Portland Cement Association [23], DEAMTM [24], and the
machine’s operating times during the construction process were made, and fuel-related emissions were estimated using the US EPA NONROAD model of diesel engine emissions [10]. The model allows specification of construction equipment based on 26 machinery types, and 15 horsepower classes.
Traffic congestion related to construction activities is included in the scope of this analysis. Traffic delays are estimated using the KyUCP model developed by the Kentucky Transportation Center [26], which is based on methodology from the Federal Highway Administration. Construction related delays are calculated using model input parameters such as traffic flow rate, road capacity, work zone speed limits, lane width, and lane closure. The impacts of construction events on fuel consumption for highway vehicles were estimated using fuel economy data from US EPA and US DOE. A city drive cycle is the closest estimate of fuel economy available for modeling stop-and-go movement typical of congestion. Likewise, a highway drive cycle for normal traffic flow is used to model flow during non-construction and non-congestion periods. Energy use, fuel consumption, and emissions for the traffic stage are always calculated based on the difference between traffic flow during construction periods and the baseline scenario under normal highway flow conditions. Automotive emissions are based on US EPA MOBILE6.2 data. The construction timeline and other details of the life cycle assessment model are described elsewhere [27,28]
Life cycle cost model
The term life cycle cost (LCC) is not used consistently. The more traditional view of LCC evaluates costs incurred by government agencies all through the value chain (from raw material acquisition to end of life). Such costs are termed “agency costs.” Recently, efforts have been made to broaden this
definition to be more inclusive of other costs associated with construction projects. In particular, several studies, using a more holistic LCC approach, have been conducted with the goal of determining agency costs as well as user costs, which are expenses incurred by those using the system in question. For instance, Ravirala and Grivas looked at determining life cycle costs for highway management and included traditional agency costs, such as construction and traffic control, as well as user delay costs – costs incurred by those waiting in construction traffic [29]. Ehlen has conducted several studies that look to expand the definition of life-cycle costing even further by recognizing costs due to environmental effects and those inflicted upon businesses affected by construction [30,31]. While Ehlen notes the importance of such externality costs, his studies do not account for them in calculating life-cycle costs.
For agency costs in this analysis, a Michigan construction company provided information about the bridge deck and construction process. This included data on material, labor, and equipment cost data; construction activity schedules, and construction equipment used throughout the life cycle of the bridge deck. Fuel cost data for industrial consumers in the state of Michigan as of November 2003 were provided by the Department of Energy. Environmental costs are based on marginal damage cost estimates for six of the seven criteria pollutants, carbon monoxide, lead, nitrogen oxides, particulate matter, sulfur oxides, and volatile organic compounds; and three primary greenhouse gases carbon dioxide, methane, and nitrous oxide [32, 33, 34]. Criteria pollutant damage costs are based on human health costs and greenhouse gas damage costs are based on composite cost criteria associated with climate change.
A 4% discount rate was used for all construction activities. In addition, all non-emissions social costs will also use a 4% discount rate, reflecting the opportunity cost of the agencies that bear these costs. The social costs from air pollutant emissions for each stage of the life cycle were estimated using
environmental loadings from the life cycle assessment model and unit damage costs taken from several sources. The traffic congestion created by construction events leads not only to additional emissions, but also to lost time for the drivers of the vehicles. Sitting in construction related traffic reduces the
Results
The LCA results show that the ECC link slab design reduces total primary energy consumption by 40% when compared to the conventional system. As shown in Figure 6, the traffic phase dominates energy consumption in both systems. The traffic phase is shown as ∆ Traffic in the figure below since this phase shows only the difference between normal traffic flow and congested flow during construction events.
0 10000 20000 30000 40000 50000 60000 70000 80000 90000
Conventional ECC
GJ
End-of-Life
Distribution
Materials
Construction
∆Traffic
Figure 6. Total Primary Energy Consumption by Life Cycle Phase
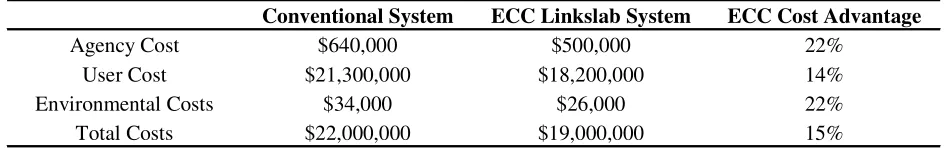
[image:10.612.179.446.170.316.2]The results for life cycle costs, shown in Table I, demonstrate that, overall, the ECC link slab system resulted in a cost advantage over the conventional system in all categories assessed, despite that initial construction costs are 12% higher for the ECC link slab bridge deck. The total life cycle costs are based on the 60-year service schedule for construction events.
Table I. Total Life Cycle Costs
Conventional System ECC Linkslab System ECC Cost Advantage
Agency Cost $640,000 $500,000 22%
User Cost $21,300,000 $18,200,000 14% Environmental Costs $34,000 $26,000 22% Total Costs $22,000,000 $19,000,000 15%
User costs overwhelmingly dominate the total life cycle costs, and environmental costs are notably small compared with agency and user costs. Of these user costs, time lost to vehicles delayed in
construction related traffic account for 94% of all user costs and 91% of total life cycle costs in both cases. This means that, essentially, the magnitude of the cost results is driven by parameters for traffic and traffic modeling.
CONCLUSIONS
While numerous researchers have begun to develop methodologies and metrics for enhancing the sustainability of large engineered systems such as transportation infrastructure, little work has been done to solidify the necessary linkages between material scientists, design engineers, and life cycle analysts. A primary goal of the MUSES project is to link the macroscale life cycle modeling presented herein with ECC microstructure tailoring research to improve the material design process.
[image:10.612.69.542.433.507.2]agency and social costs can be evaluated. The application of this integrated model to bridge deck joint design highlighted the critical importance of using the life cycle modeling in order to enhance the sustainability of infrastructure systems. This study showed that the ECC link slab bridge deck design resulted in significantly lower environmental impacts and costs over a 60 year bridge deck service life compared to the conventional steel expansion joint system. A key finding from life cycle modeling was the dominance of construction related traffic on the environmental performance of both deck systems. Consequently, predicting maintenance and repair schedules for each system is critical in evaluating the performance of alternative materials. The repair and rehabilitation timeline drives the results for both the LCA and LCC. This underscores the need for a reliable model for service schedule prediction, and the design and material choices that affect the schedule.
New formulations of ECC are currently being tested and evaluated. The environmental, social and economic performance indicators can be used to guide changes in material design in order to optimize sustainability of the system. The life cycle approach is also transferable to other emergent materials and infrastructure systems that are characterized by large societal investments.
ACKNOWLEDGEMENTS
This research was funded through an NSF MUSES Biocomplexity Program Grant (CMS-0223971 and CMS-0329416). MUSES (Materials Use: Science, Engineering, and Society) supports projects that study the reduction of adverse human impact on the total interactive system of resource use, the design and synthesis of new materials with environmentally benign impacts on biocomplex systems, as well as the maximization of efficient use of materials throughout their life cycles.
REFERENCES
1. CSS. 2005 Materials Use Factsheet, Center for Sustainable Systems, University of Michigan, http://css.snre.umich.edu/4_2_Factsheets.htm
2. ASCE. 2001. Renewing America's Infrastructure: A Citizen's Guide. American Society of Civil Engineers. Washington, D.C. pp. 43. http://www.asce.org/pdf/citizens_guide.pdf
3. TRIP. 2002. Key Facts About America's Road and Bridge Conditions and Federal Funding. Accessed March 2002 from The Road Information Program (TRIP): http://www.tripnet.org/nationalfactsheet.html
4. van Oss, H. G. and A. C. Padovani. 2002b. Cement Manufacture and the Environment. Part I: Chemistry and Technology. Journal of Industrial Ecology. 6(1): 89-105.
5. UNFPA. 2001. The State of World Population 2001, Chapter 3. Accessed March 2002 from the United Nations Population Fund (UNFPA): http://www.unfpa.org/swp/2001/english/ch03.html#3
6. Hendricks, C.A., E. Worrell, L. Price, N. Martin, L. Ozawa Meida, D. de Jager and P. Reimer. 1998.
Emission reduction of greenhouse gases from the cement industry. Proceedings of the Fourth
International Conference on Greenhouse Gas Control Technologies, Interlaken.
7. Worrell, E., L. Price, N. Martin, C. Hendriks and L. Ozawa Meida. 2001. Carbon dioxide emissions from the global cement industry. Annual Reviews of Energy and the Environment. 26: 303-329.
8. WBCSD. 2002. Toward a Sustainable Cement Industry. Draft report for World Business Council on Sustainable Development. Battelle Memorial Institute. http://www.wbcsd.org/ newscenter/reports/2002/cement.pdf
9. US EPA. 1999. 40 CFR Part 63 National Emission Standards for Hazardous Air Pollutants for Source Categories; Portland Cement Manufacturing Industry; Final Rule. Environmental Protection Agency. http://www.epa.gov/ttn/atw/pcem/fr14jn99.html
10. US EPA. 2000. Sources of dioxin-like compounds in the United States. Draft exposure and human health reassessment of 2,3,7,8-tetrachlorodibenzo-p-dioxin (TCDD) and related compounds. EPA/600/P-00/001 Bb. Environmental Protection Agency.
http://cfpub.epa.gov/ncea/cfm/part1and2.cfm
12. Kanda, T. and Li. V.C. 1998. Multiple cracking sequence and saturation in fiber reinforced cementitious composites. Japan Concrete Institute Concrete Research and Technology. 9(2): 19- 33. 13. Li, V.C. 1998. Engineered cementitious composites - tailored composites through micromechanical
modeling. Fiber Reinforced Concrete: Present and the Future. Eds. N. Banthia, A. Bentur and A.
Mufti. Montreal: Canadian Society for Civil Engineering pp.64-97. For more info on ECC see:
http://www.engin.umich.edu/acemrl/
14. Li, V.C. 2003. ""“On Engineered Cementitious Composites (ECC) – A Review of the Material and its
Applications,”J. Advanced Concrete Technology, 1(3): 215-230.
15. Ashby, M. 1992 “Material Selection in Mechanical Design” Butterworth-Heinemann. Oxford, England. pp. 1-303
16. ISO. 1997. "Environmental management - Life cycle assessment - Principles and framework." ISO 14040, International Organization for Standardization, Geneva.
17. Office of Management and Budget (2005) Discount Rates for Cost-Effectiveness, Lease, Purchase and Related Analyses. Appendix C to Guidelines and Discount Rates for Benefit-Cost Analysis of Federal Programs. Report of the Office of Management and Budget, Washington, D.C.
18. Weitzman, M. L. (2001) Gamma discounting. American Economic Review, 91, 260-271.
19. Gramlich, E. M. (1990) A Guide to Benefit-Cost Analysis, Prentice-Hall, Inc., Englewood Cliffs. 20. Li, V.C., Fischer, G., Kim, Y., Lepech, M., Qian, S., Weimann, M., and Wang, S. 2003. "Durable link
slabs for jointless bridge decks based on strain-hardening cementitious composites." Project Report to MDOT.
21. Li, V.C. 2003. ""“On Engineered Cementitious Composites (ECC) – A Review of the Material and its
Applications,”J. Advanced Concrete Technology, 1(3): 215-230.
22. Liu, Y. and Weyers, R. 1998 “Modeling the Time-to-Corrosion Cracking in Chloride Contaminated Reinforced Concrete Structures” ACI Materials Journal 95(6) pp. 675-681,
23. Nisbet, M. A., et al. 2002. "Environmental Life Cycle Inventory of Portland Cement Concrete: Appendix; Life Cycle Inventory of Portland Cement Manufacture." Portland Cement Association, Skokie, IL.
24. Ecobilan. 2001. "TEAM/DEAM." Ecobilan, (PriceWaterhouseCoopers), Rockville, MD. 25. IISI. 2000. "Worldwide LCI Database for Steel Industry Products."
International Iron and Steel Institute.
26. KTC. 2002. "The Cost of Construction Delays and Traffic Control for Life-Cycle Cost Analysis of Pavements." KTC-02-07/SPR197-99 & SPR218-00-1F, Kentucky Transportation Center (KTC).
27. Kendall, Alissa. 2004. “A Dynamic Life Cycle Assessment Tool for Comparing Bridge Deck Designs.” Master’s Thesis. University of Michigan.
28. Keoleian, G.A., Kendall, A., Dettling, J.E., Smith, V.M., Chandler, R.F., Lepech, M.D. and Li, V.C. 2005. Life Cycle Modeling of Concrete Bridge Design: A Comparison of Engineered Cementitious Composite Link Slabs and Conventional Steel Expansion Joints. Journal of Infrastructure Systems. (2005) 11(1): 51-60.
29. Ravirala, V. and Grivas, D. 1995. “State Increment Method of Life-Cycle Cost Analysis for Highway Management.” Journal of Infrastructure Systems 1(3): 151-9.
30. Ehlen, M. A. (1997) Life-Cycle Costs of New Construction Materials. Journal of Infrastructure Systems, 3, 129-133.
31. Ehlen, M. A. (1999) Life-cycle Costs of Fiber-Reinforced-Polymer Bridge Decks. Journal of Materials in Civil Engineering, 11, 224-230.
32. Banzhaf, H. S., W. H. Desvousges, et al. (1996). "Assessing the Externalities of Electricity Generation in the Midwest." Resource and Energy Economics 18, 395-421.
33. Matthews, H. S. and L. B. Lave (2000). "Applications of Environmental Valuation for Determining Externality Costs." Environmental Science and Technology, 24(8): 1390-1395.
34. Tol, R. S. J. (1999). "The Marginal Costs of Greenhouse Gas Emissions." The Energy Journal 20(1): 61-81.
35. U.S. Department of Transportation. “Life-Cycle Cost Analysis in Pavement Design – In Search of Better Investment Decisions.” Report No. FHWA-SA-98-079. Pavement Division Interim Technical Bulletin. September 1998.