2018 IX International Conference on Optimization and Applications (OPTIMA 2018) ISBN: 978-1-60595-587-2
Task Assignment Optimization in Photoanalysis Process: Comparative
Analysis of Semi-Automated and Manual Task Management
Uladzislau YANCH
1,*and Łukasz WIECHETEK
2QMK sp. z o.o., ul. 23 Marca 77E, 81-820 Sopot, Poland
Maria Curie-Skłodowska University, pl. M. Curie-Skłodowskiej 5, 20-031 Lublin, Poland Corresponding author
Keywords: Task assignment, Task management, Process optimization, Timetabling Problem, Person- nel scheduling, Process automation, Optimizing in Excel, Solver, Comparative analysis.
Abstract. In today’s competitive environment, enterprises strive to maintain high efficiency and
quality of their business processes. This can be achieved using IT tools that allow to optimize tasks assignment and course of processes. The purpose of this article is to present the PESBAT – automation and optimization tool for task assignment, implemented in the VBA with the use of Solver add-in available in Microsoft Excel. The article presents the process of manual task assignment performed by a photoanalysis manager, components and basic functions of PESBAT tool. The main part of the article is a comparative analysis of semi-automatic and manual task division. The analysis shows that the combination of Solver algorithms and process automation through the use of macros implemented in VBA leads to time savings (20% to 60%) for task sets of various sizes and allows for more balanced task assignment, which reduces the time of order completion and improves quality of offered services.
Introduction
Task assignment is a very important issue both for companies, workers and managers. En- terprises have to meet many customers needs, offer high-quality services and be faster than the competitors. Good workers know their value and they cannot be overwhelmed by duties, because it may cause lower efficiency, burnout, absenteeism and can lead to leaving work [6].
the managers have to build strong positive relations with employees, take care of a good working atmosphere and in some sense, look after employees. Therefore, they should not let a situation where employees are over-exploited or unequally treated happen.
To improve the company’s performance, build a positive atmosphere at work and develop stable relations with employees and customers task assignment process should be well planned, organized, monitored and improved. This can be achieved through the use of appropriate methods and tools for task assignment optimization.
Task assignment is one of the important steps to effectively exploit the capabilities of enterprise resources. This is one of the fundamental combinatorial optimization problems when a large number of agents should be assigned to a given number of tasks. The task assignment problem is widely described in the literature. Many of the articles address the distributed or parallel computing systems, assigning tasks to employees or assigning tasks to production machines/lines.
1
2
*
The task assignment problem in the area of distributed computer systems has been explored for decades e.g. by Shen and Tsai, Efe, Kafil and Ahmad, Crovella et al., Harchol-Balter et al. [18, 5, 9, 4, 8]. Lo [11] tried to solve communication task assignment problem using heuristic algorithms. The simulation proved that Simple Greedy Algorithm works as good as complex heuristic algorithms. An interesting solution was proposed by Salman et. al [15]. They used particle swarm optimization (PSO) to build the task assignment algorithm. Their simulation indicated that PSO can be successfully used for task assignment for computing systems.
In the area of task assignment for employees Loucks and Jacobs [12] tried to solve work tour scheduling problem and task assignment for workers that have different qualifications and times of availability. Their goals were to minimize the overstaffing and minimize the differences of work hours between the employees. They demonstrated a computerized heuristic tool that prepares the optimal labor scheme with only a little help of the manager. The similar problem in the banking sector was analyzed by Li et al. [10]. Smith et al. [19] present empirical study about using task assignment patterns to improve the accuracy of software effort estimation. The main goal of their optimization was to minimize the effort required to complete each development task. They identified four important factors for task assignment: team size, concurrency, intensity, and fragmentation. They used these factors to improve the cost estimation model. The assignment with multiskilled employees for product development projects was analyzed by Chend and Chu [3]. They calculated employees’ workloads basing on fuzzy sets theory and proposed optimization model for task assignment problem. Their targets were to minimize project time and balance the workload of project attendants. Interesting research was also performed by Sampson [16]. He explores the problem of optimization of volunteer labor assignments. The author describes the differences between traditional labor assignment and volunteer labor assignment and concludes that task assignment models should be different for non-profit and commercial organizations. The problem of task assignment and personnel scheduling is explored also by Brucker et al., Carnahan et al., Schaerf and Meisels, Peters and Zelewski, Meisels and Schaerf[1, 2, 17, 14, 13].
The task assignment problem is well known but still not fully solved and needs more practi-cal and theoretipracti-cal exploration. Therefore, compared with the previous studies, in this paper, the authors present the comparative analysis of semi-automated and manual task assignment optimiza-tion in photoanalysis process. The article contains the characteristics of the photoanalysis process structure, manual procedure of task assignment in photoanalysis process and its semi-automated version with the use of PESBAT tool. Finally, authors present the comparative analysis of man-ual and semi-automated task assignment process, analyzing the given criteria: assignment time, mistakes rate, employees’ workload, and assessment bias.
The Structure of Photoanalysis Process
QMK sp. z o.o. is Polish consulting and analytical enterprise, located in Sopot. One of its products is a photoanalysis service. It allows clients to receive information on the quality of their salesforce work, number of products on shelves in client’s stores. Photoanalysis results show also whether point-of-sales materials presented on the shelves are up to date. Besides delivering various information to QMK’s clients, photoanalysis helps to assess the impact of the right product presentation on shelves and educates client’s workers by giving them feedback on the quality of their work.
Photoanalysis process is complicated and requires multiple interactions between QMK and
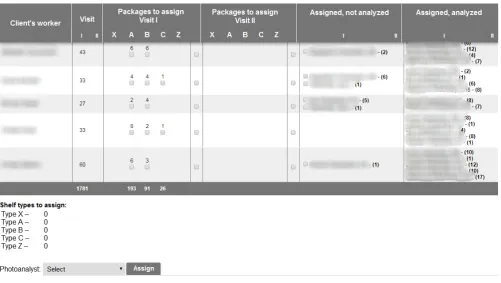
Figure 1. Task assignment section
its clients. The first step of the process is visiting client’s stores by client’s workers. They take photographs of shelves that need to be analyzed. Visits take place each working day, each store has to be visited only 2 times per month.
Next, the photographs are sent to QMK’s client’s server, where they are gathered into pack-ages. Each package contains photos performed at only one store. Client also creates a text file with information which helps to distinguish packages and import them to photoanalysis platform correctly.
Later client exports packages and a text file to QMK’s server and packages are imported to the photoanalysis platform. Once imported, packages are assigned to photoanalysts, who perform photoanalysis. After photoanalysis is completed, results are presented to the cliented, modified if some mistakes are discovered, and used for the preparation of various reports and ratings.
Although the process is not very complicated, its proper functioning requires integration be-tween QMK and its client’s IT systems. At present photoanalysis is performed manually. Beside photoanalysts, there are many clients’ workers engaged in the process, as well as a certain number of system administrators. Communication between QMK and its clients takes place via a web platform.
Task Assignment in Photoanalysis Process
After packages with photographs are correctly imported to QMK’s server and photoanalysis web-platform, they need to be assigned to photoanalysts for further processing. Task assignment is performed on a web-platform (Figure 1).
2nd visits performed by a given client’s worker. Columns 3 and 4 show how many packages of all types and visit rounds from a given client’s worker currently need to be assigned. During import packages are grouped by client’s worker and shelf type, hence it is impossible to assign packages one by one. Photoanalysis manager has to click the checkboxes in columns 3 and 4 to select needed groups of packages and later assign them to a selected photoanalyst (selection field is shown in the bottom of Figure 1). Columns 5 and 6 provide photoanalysis manager with information on the photoanalysis progress. The assignment has some restrictions:
payment for analysis of each shelf is equal, and analysis time differs, hence packages of various types should be assigned to photoanalysts proportionally to their share in the overall number of packages,
packages of photographs should be assigned to photoanalysts proportionally to their potential workloads,
throughout a month packages from each of client’s workers should be assigned to as many analysts as possible in order to minimize biased assessment,
all packages of photographs have to be assigned,
each group of packages can be assigned to only one photoanalyst.
Formulation of the problem is similar to the formulation of variable sized bin packing problem in [7]. The problem may be formally stated as follows:
For a set W of various workloads w1, w2...wn ∈ Z+ with various number of working hours and a set T of tasks t1, t2...tm ∈ Z+ which take different amounts of hours to be performed, having
W < T and Pn
i=1wi =
Pm
i=1ti, find bijection f : T → W such that ∀w ∈ W, w =
Pk
i=1ti that were assigned to thatw.
The above restrictions are easy to meet, though some calculations need to be performed in order to tell how many packages of each type a given photoanalyst should receive so that restrictions 1 and 2 are met. Having this information, photoanalysis manager should select several checkboxes in the task assignment section and assign selected groups of packages to a chosen photoanalyst. However, it can occur that some photoanalysts are overloaded, others have no packages assigned. In that situation, it is impossible to meet restrictions 1 and 2.
The above problem may be avoided by finding the largest groups of packages (checkboxes with the largest numbers near them) and assigning them to photoanalysts with larger workload potential. In practice that approach sufficiently extends the time needed for task assignment due to the need of scrolling through task assignment section and still does not guarantee that all large packages are found at the beginning of task assignment.
In order to reduce task assignment time and minimize the risk of breaking restrictions of task assignment process, an optimization and automation tool called PESBAT was created. The tool will be described in the next section.
Task Assignment with Use of PESBAT Tool
PESBAT stands for Programming Enhanced Solver Based Assignment Tool. It was developed to optimize package assignment process in QMK. PESBAT uses Microsoft Excel components. It consists of several spreadsheets with formulas, in which input data is transformed by macrodefi-nitions. PESBAT also uses Microsoft Excel Solver as its engine for optimization. Solver allows to use Simplex LP method to select groups of packages and assign them to photoanalysts in such a
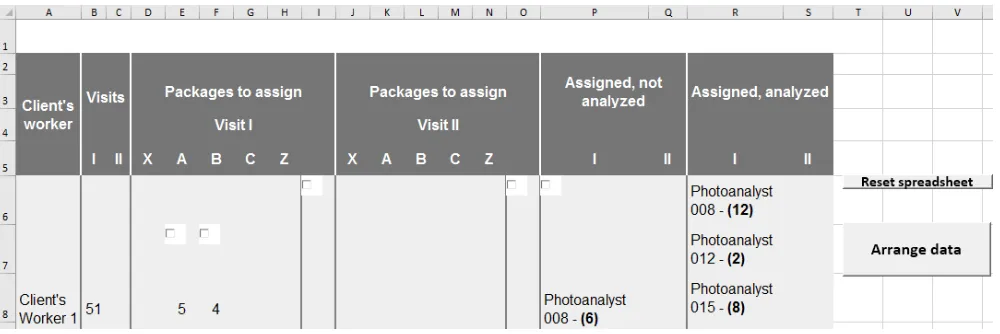
Figure 2. PESBAT: Step 1
way that all of the process restrictions are met. Analysis of the results of task assignment shows that the goal is achieved by assigning the least number of possible task that takes as much time as a given photoanalyst has. Solver performs these operations by using Simplex and dual Simplex method with bounds on the variables, which in this case have binary restriction – either to assign or not assign each given group of packages to photoanalyst that is being currently analyzed. Mi-crosoft Excel Solver was used for PESBAT development due to several reasons: integration with Excel, easiness of usage, built-in optimization algorithms, scalability.
Process of using PESBAT may be divided into 3 basic steps: 1. Data acquisition and preparation,
2. Calculation of potential workloads, 3. Package assignment.
PESBAT uses the table created by web-platform. The table should be copied from the website and pasted into PESBAT’s spreadsheet “Step 1”. There are 2 command buttons in the spreadsheet which allow to clear from or prepare data for further processing (Figure 2).
The “Arrange data” button initializes a macrodefinition that prepares data for further usage. The structure of the macro is as follows:
1. copy the input table to the spreadsheet “Step 2”,
2. delete the columns that will not be used for package assignment, unmerge all cells and delete empty rows,
3. put zeros to empty cells in the intersection of client’s worker rows and package type columns, 4. move the data concerning photographs produced during second visits under the section of
data concerning first visit packages,
5. change the height of rows and width of columns so that it would be easier to see the whole table.
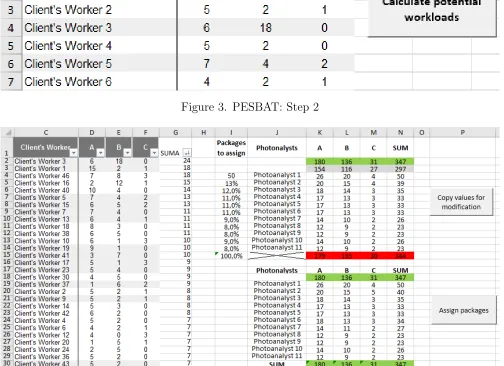
Figure 3. PESBAT: Step 2
Figure 4. PESBAT: Step 3
packages to be assigned. The “Copy values for modification” allows to copy workloads to another table where data can be modified without deleting formulas in the previous table. The “Assign packages” command button engages main PESBAT macrodefinition that is responsible for package assignment and creation of instructions for photoanalysis manager. The macrodefinition initializes Microsoft Excel Solver several times, uses data concerning photoanalysts’ workloads as target values and creates a column of binary variables near the table with a number of packages that each client’s worker has provided. The solver uses the Simplex LP algorithm to decide whether to use a given group of packages to reach the target value (photoanalyst workload) or not. Macrodefinition also uses a set of cells as its operating memory: the cells contain information that the next Solver iteration uses to understand which groups of packages were already assigned. Thanks to that, situations in which the same group of packages is assigned to several photoanalysts are eliminated. If it is impossible to meet the target value by assigning available packages, the program proposes to change the target value on the fly. The macrodefinition also uses several variables to navigate
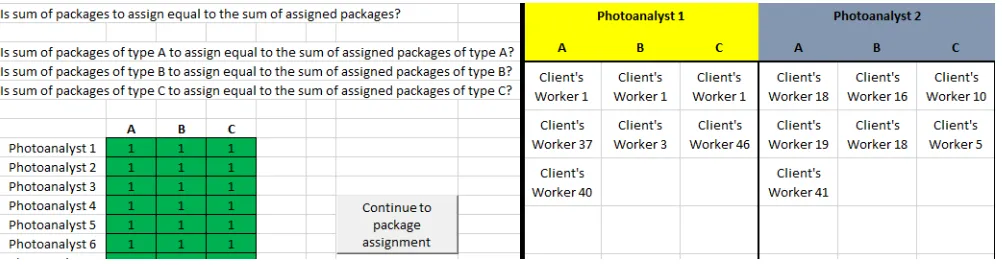
Figure 5. PESBAT: control table and output
through the spreadsheets and write data to the output table. Structure of the main macro is shown below:
1. set the navigation variables,
2. loop 1: further operations repeat for all types of packages,
(a) choose the type of package for assignment,
(b) reset the operating memory,
(c) loop 2: further operations will repeat for each of the photoanalysts,
i. select a photoanalyst,
ii. check operating memory to collect information on the packages that may be as-signed,
iii. reset Solver, initialize Solver and set its parameters, iv. assign groups of packages,
v. check if the assignment was successful, propose to change the target value if needed, vi. check which packages were assigned, update operating memory,
vii. transfer assignment data to the output spreadsheet,
viii. copy the data on the size of the assigned packages to the technical spreadsheet, ix. go to the beginning of loop 2,
(d) modify variables used for navigation,
(e) reset the operating memory,
3. give information on how long package assignment took.
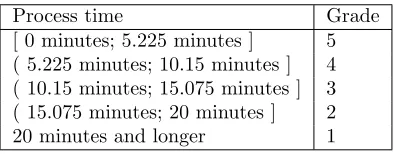
Table 1. Assignment time – grades.
Process time Grade [ 0 minutes; 5.225 minutes ] 5 ( 5.225 minutes; 10.15 minutes ] 4 ( 10.15 minutes; 15.075 minutes ] 3 ( 15.075 minutes; 20 minutes ] 2 20 minutes and longer 1
Table 2. Rate of mistakes – grades.
Mistake rate Grade [ 0%; 8.75% ] 5 ( 8.75%; 17.5% ] 4 ( 17.5%; 26.25% ] 3 ( 26.25%; 35% ] 2 35% and more 1
Microsoft Excel and QMK’s database. Finally, the output data may be easily converted to a text file and used for automated package assignment in the web-platform.
To assess potential of the tool better, discover its potential flaws and point out tasks where it should be used, a comparative analysis of manual and PESBAT-supported task assignment was conducted. The results of the comparison are presented in the next section.
Manual and Semi-Automated Task Assignment – Comparative Analysis
Criteria of Assignment Effectiveness
We selected 4 criteria to compare manual and semi-automated task assignment. They have various importance for method evaluation and will be graded on a scale from 1 to 5. Grades will be later multiplied by a number from 1 to 4 that represent the importance of each criterion. The maximum possible rating is 60, and minimum is 12.
Assignment time One of the main purposes of PESBAT tool is to reduce time required for task assignment. Data concerning 23 assignments was gathered, 11 assignments for each manual method and 12 for semi-automatic; this data will be analyzed in further subsection. Since time reduction is crucial, its importance multiplier is 4. The highest mark — a 5 — is possible to achieve by fully automatizing task assignment process, so that it would only be necessary to modify input values for workload calculation. That operation takes around 20 seconds (that is the time for workload calculation in manual method), and that time will be considered shortest possible. The maximum length of the process should not exceed 20 minutes, because tasks should be assigned as soon as possible after packages are imported to the web-platform (table 1).
Rate of mistakes in task assignment In some cases, mistakes may occur during task as-signment due to the human factor. One of PESBAT’s tasks is to reduce the percentage of wrong assignments. Mistakes in the assignment are not usually critical and it is possible to reassign pack-ages, hence importance multiplier is set at 3. Perfect assignment process would exclude mistakes, so 0% of mistakes corresponds to grade 5. Highest acceptable mistake rate is 35% (table 2),
[image:8.612.241.373.217.294.2]Table 3. Potential of biased assignment – grades.
Difference between av. SDTA for task suppliers and workloads Grade
[ 0 p.p.; 12.5 p.p. ] 5
( 12.5 p.p.; 25 p.p. ] 4
( 25 p.p.; 37.5 p.p ] 3
( 37.5 p.p; 50 p.p. ] 2
50 p.p. and more 1
Potential of biased assessment The biased assignment may happen if client’s worker makes a side agreement with photoanalyst in order to receive better reviews of his or her work. Several countermeasures were taken to avoid that problem, for example anonymizing of photoanalysts, but proper task assignment is still needed to avoid situations where some photoanalyst receives the majority of packages imported from a given client’s worker. The ideal process would assign packages in such a way that all packages from each given client’s worker are assigned to each of the photoanalysts according to their workloads. Grades for this parameter are based on a standard deviation of assigned packages to the average of the population. Population, in that case, consists of assignments of packages from the same client’s worker. If all packages are distributed between photoanalysts according to their workloads, the ratio of standard deviation to the average is the same as a deviation to average ratio for real workloads of photoanalysts. If the distribution of packages differs for each of client’s workers, the ratio will increase. Deviation ratio will be calcu-lated for all of the client’s workers for months from 12-2017 to 03-2018 (packages were assigned manually before 01-02-2018). Average ratio for all client’s workers for a given method will be used to assess the effectiveness of a method. The stages of the assessment process for the potential of the biased assignment are as follows:
1. Calculate SDTA (standard deviation to average ratio) for numbers of packages that each photoanalyst received. Calculations are made distinctively for each of client’s workers, 2. Calculate average SDTA for all client’s workers in a given month,
3. Calculate SDTA for real workloads that photoanalysts had in a given month,
4. Compare results of stages 2 and 3 for each month, express the difference in percentage points, 5. Calculate the average result of stage 4 for each method.
If the result of stage 5 is low, then the method ensures reduction of the potential for biased as-sessments (table 3).
Since biased assignment was not reported for a long time and several countermeasures have already been taken, the importance multiplier of the presented parameter is 2.
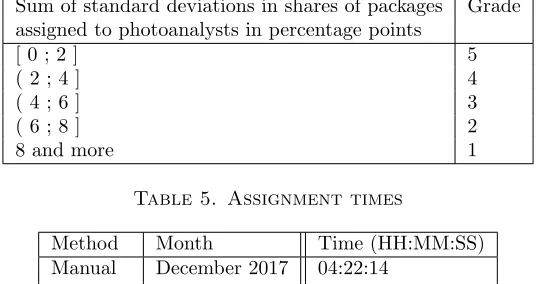
Table 4. Proportionality in assignments of packages of various types – grades.
[image:10.612.172.440.116.258.2]Sum of standard deviations in shares of packages Grade assigned to photoanalysts in percentage points
[ 0 ; 2 ] 5
( 2 ; 4 ] 4
( 4 ; 6 ] 3
( 6 ; 8 ] 2
8 and more 1
Table 5. Assignment times
Method Month Time (HH:MM:SS) Manual December 2017 04:22:14
Manual January 2017 06:25:48 PESBAT February 2018 06:43:27 PESBAT March 2018 06:24:02
in data that might point out that, for example, the share of Type A packages was much higher than the average for several photoanalysts, and for another group of photoanalysts that value was much lower than the average. Taking the above into consideration, it was decided that grades for presented parameter should correspond to standard deviation in shares of packages of each type for a population of all photoanalysts. Grades and value of the parameter that they correspond to are presented in table 4:
The presented parameter is of great influence for supporting good relationships between QMK and its workers, hence its importance multiplier is 3.
Comparative Analysis Results
Assignment time Assignment time may be calculated by either analyzing the activity of photoanalysis manager recorded in log files or by measuring directly how much time was spent for each particular assignment. Log files were analyzed to show how much time photoanalysis manager spent in task assignment section from December 2017 to March 2018. A macrodefition written in VBA was created to look for a point where the manager visits the task assignment section, read time from that moment, then look for a point where countdown should be stopped. Stop-points are: transfer to another web-platform section, change of the date or a break in activity. Breaks in activity are situations in which web-page address in the log file does not change for more than 3 minutes. If a break occurs, 1 minute and 30 seconds are added to the visit time. Later, a difference between visit start and visit end is calculated. Gathered data is presented in table 5:
Data concerning the manager’s activity in the system appeared to be difficult to analyze: breaks in activity and transfers between sections were taken into account, but still the amount of time spent in task assignment section from December 2017 to March 2018 is much higher according to the results than it should be according to direct measurements of assignment time conducted in April-June 2018. This difference may be explained by the fact that:
there are 2 photoanalysis projects carried out on the same copy of the web-platform. They have the same log file, and it is impossible to distinguish them having web-page address from the log files since the main section which distinguishes projects is absent
Figure 6. Assignment time data – direct measurements.
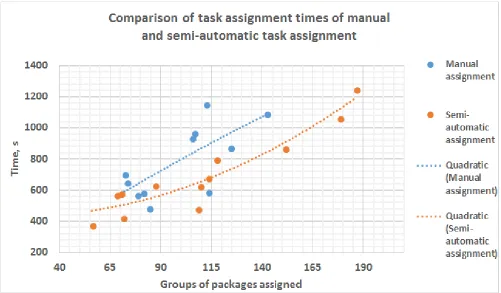
the formation of various reports, so not every visit in this section is a task assignment visit. Besides that, task assignment time was measured directly for 1 April 2018 - 14 June 2018. There are 23 measurements, 11 for manual and 12 for PESBAT-supported task assignment. The amount of assigned groups of packages is 1090 for manual and 1314 semi-automatic assignment. Groups of packages were taken into account in these measurements instead basic packages (imported from the client) because they are the units that need to be assigned, as they are represented by checkboxes in the assignment section, which should be selected in order to assign tasks to photoanalysts. The data is shown in figure 6, trend lines are created using quadratic equations and time of assignment is a sum of workload calculation time and time that was spent in a web-platform:
PESBAT shows its effectiveness especially for assignments of 100-120 groups of packages. There are cases when a semi-automatic assignment took half of the time that manual assignment needed for the same number of groups of packages. We can also observe situations when a manual as-signment took less time. Such intersections may be explained by several factors, e.g. speed of the internet connection and usage of operation memory of a computer that was used for workload calculations and package assignments.
Since the number of assignments varies for different sizes of assignment, we decided to take data from only the best represented assignment sizes – from 65 to 125 groups of packages per assignment. Average times of workload calculation, assignment and total time for both methods together with their grades are presented in the table 6.
Table 6. Average assignment time and grades (65-125 groups of packages per assignment)
Method Workload Assignment Total time Time reduction Grade
Manual 0.32 min. 12.28 min. 12.60 min. — 3 PESBAT 1.64 min. 8.42 min. 10.06 min. 20.16% 4
Table 7. Mistake rates during task assignment and grades (65-125 groups of packages per assign-ment)
Method Assignments No. Mistakes No. Mistake rate Grade
Manual 10 3 30% 2
PESBAT 8 1 12.5% 4
times of task assignment. A mistake is a situation when a group of packages is assigned to pho-toanalyst different than in PESBAT output (for semi-automatic assignment) or when at a certain point it is impossible to continue task assignments without breaking its restrictions, e.g. without assigning a package that is greater that photoanalyst’s maximal workload. Only assignments of 65 to 125 groups of packages were considered in analysis, because task assignments from other size groups are underrepresented (table 7).
[image:12.612.68.547.434.506.2]Potential for biased assessment It should be mentioned that client’s workers that had im-ported less packages than the number of photoanalysts were excluded from the analysis, since it is impossible to assign less than one package to a photoanalyst (table 8).
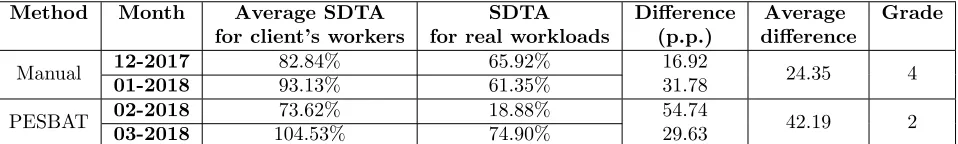
Table 8. Potential for biased assessment – results of analysis and grades
Method Month Average SDTA SDTA Difference Average Grade
for client’s workers for real workloads (p.p.) difference
Manual 12-2017 82.84% 65.92% 16.92 24.35 4
01-2018 93.13% 61.35% 31.78
PESBAT 02-2018 73.62% 18.88% 54.74 42.19 2
03-2018 104.53% 74.90% 29.63
The data shows that for manual assignment STDA measured for assignments for distinct client’s workers is higher by 24,35 p.p. than SDTA measured for workloads of photoanalysts, and by 42,19 p.p. higher for PESBAT-supported assignment. It is clear that manual assignment is a better method for avoiding biased assessment. During manual task assignment, the manager scrolls through the whole section and sees several checkboxes (groups of packages) that may be assigned to a particular photoanalyst.
However, the main source of the problem is that there are no fixed routes that client’s workers use, hence it is impossible to predict how many packages each particular client’s worker will import each day. This fact terminates the ability to plan assignments in such a way that packages from each client’s worker would be better distributed between photoanalysts.
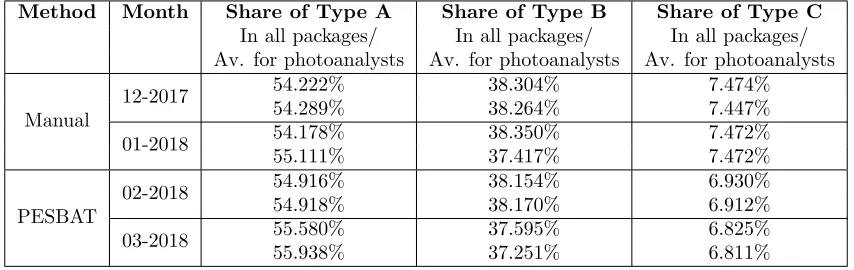
Proportionality in assignments of various types of packages We gathered data concerning packages that were assigned to QMK’s photoanalysts in months from December 2017 to March 2018. As it was mentioned earlier, average values for shares of different types of packages were not considered for assessment of methods. It appeared that average share of a given type of packages
for all photoanalysts is extremely close to share of that type of package in all assigned packages (table 9). Considering negligibility of differences between values presented in the above table,
Table 9. Proportionality in assignments of packages of various types - average values
Method Month Share of Type A Share of Type B Share of Type C
In all packages/ In all packages/ In all packages/ Av. for photoanalysts Av. for photoanalysts Av. for photoanalysts
Manual
12-2017 54.222% 38.304% 7.474% 54.289% 38.264% 7.447%
01-2018 54.178% 38.350% 7.472% 55.111% 37.417% 7.472%
PESBAT
02-2018 54.916% 38.154% 6.930% 54.918% 38.170% 6.912%
03-2018 55.580% 37.595% 6.825% 55.938% 37.251% 6.811%
standard deviation calculated for shares of types packages that were assigned to all photoanalysts during some period of time may be taken alone to represent the effectiveness of both methods (table 10). It is clear that both methods provide, on average, satisfying results in proportionality of assignments of packages of different types. However, PESBAT manages to reduce deviations from the needed value among the team of photoanalysts. The difference between performance of both methods may be caused by the fact that assigning tasks with the use of PESBAT generates less mistakes during assignments.
Conclusions
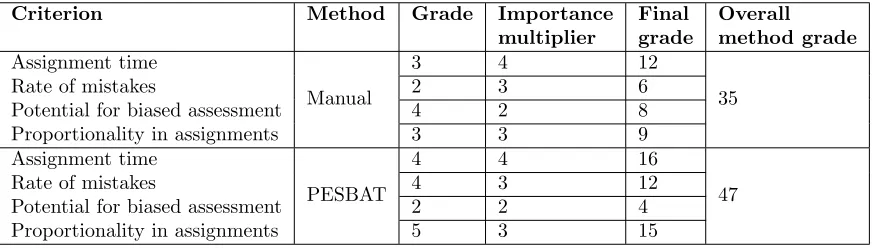
The results of comparative analysis of task assignment for manual and semi-automatic methods are presented in (table 11):
The article presents the task assignment problem for photoanalists and its optimization with PESBAT tool, however, there are known open source tools like OptaPlanner, GNU Octave or Google OR-tools, which can be applied to solve much more complicated problems. The next step of the research may be seen in a comparison of PESBAT to other tools for task assignment opti-mization and/or assignment problem.
The performed photoanalysis process analysis and the comparison of manual and semi-automated task assignment process using PESBAT indicate that:
the photoanalysis process has a lot of areas for optimization (e.g. task assignment, cre-ation of documentcre-ation, services evalucre-ation). Route planning and further improvement of
Table 10. Proportionality in assignments of packages of various types – standard deviations and grades
Method Month Type A Type B Type C Sum of st. Avg. for Grade
st. dev. (p.p.) st. dev. (p.p.) st. dev. (p.p.) deviations method
Manual 12-2017 1.20 1.19 0.22 2.61 4.657 3
01-2018 3.01 3.31 0.42 6.74
PESBAT 02-2018 0.53 0.40 0.35 1.28 1.605 5
[image:13.612.60.576.667.743.2]Table 11. Comparative analysis: manual vs. PESBAT task assignment – results
Criterion Method Grade Importance Final Overall
multiplier grade method grade
Assignment time
Manual
3 4 12
35
Rate of mistakes 2 3 6
Potential for biased assessment 4 2 8 Proportionality in assignments 3 3 9 Assignment time
PESBAT
4 4 16
47
Rate of mistakes 4 3 12
Potential for biased assessment 2 2 4 Proportionality in assignments 5 3 15
photoanalysis web-platform are possible fields for our future research,
negative effects caused by problems that may be presented as a mathematical model can be reduced using simple tools like Microsoft Office built-in VBA,
data gathering and conservation should be treated more seriously by enterprises, since it helps to assess problems and successes faster and ensure easier access to valuable information that helps to describe business processes more precisely.
the performed simulations show that the combination of Solver procedures and process au-tomation through the use of macros implemented in VBA leads to time savings (on average 20%, in several cases up to 60%). Time reduction may be increased by optimizing the code of macrodefinitions, by automizing data exchange between PESBAT and photoanalysis web-platform,
using developed PESBAT tool allows for more balanced task assignment, which reduces the time of order completion and improves quality of offered services,
rate of mistakes is sufficiently reduced for the semi-automatic method. It may be explained by clear instructions that PESBAT provides thanks to its pre-assigning functionality,
potential for biased assignment is lower for manual assignment since it does not eliminate human factor from the process. Such to some degree randomized assignment may be helpful since photoanalysts’ workloads and quantities of packages provided by client’s workers vary greatly. Modification of PESBAT’s pre-assigning algorithm may be needed to achieve better results in this field,
References
[1] Peter Brucker, Rong Qu, and Edmund Burke. Personnel scheduling: Models and complexity.
European Journal of Operational Research, 210(3):467–473, 2011.
[2] Brian J Carnahan, Mark S Redfern, and Bryan Norman. Designing safe job rotation schedules using optimization and heuristic search. Ergonomics, 43(4):543–560, 2000.
[3] Hui Cheng and Xuening Chu. Task assignment with multiskilled employees and multiple modes for product development projects. The International Journal of Advanced Manufacturing
Technology, 61(1-4):391–403, 2012.
[4] Mark E Crovella, Mor Harchol-Balter, and Cristina D Murta. Task assignment in a dis-tributed system (extended abstract): improving performance by unbalancing load. In ACM
SIGMETRICS Performance Evaluation Review, volume 26, pages 268–269. ACM, 1998.
[5] Kemal Efe. Heuristic models of task assignment scheduling in distributed systems. Computer, 15(6):50–56, 1982.
[6] Horst A Eiselt and Vladimir Marianov. Employee positioning and workload allocation.
Com-puters & operations research, 35(2):513–524, 2008.
[7] Mohamed Haouari and Mehdi Serairi. Relaxations and exact solution of the variable sized bin packing problem. Computational Optimization and Applications, 48(2):345–368, 2011.
[8] Mor Harchol-Balter, Mark E Crovella, and Cristina D Murta. On choosing a task assign-ment policy for a distributed server system. Journal of Parallel and Distributed Computing, 59(2):204–228, 1999.
[9] Muhammad Kafil and Ishfaq Ahmad. Optimal task assignment in heterogeneous distributed computing systems. IEEE concurrency, 6(3):42–50, 1998.
[10] Cheng Li, E Powell Robinson, and Vincent A Mabert. An evaluation of tour scheduling heuristics with differences in employee productivity and cost. Decision Sciences, 22(4):700– 718, 1991.
[11] Virginia Mary Lo. Heuristic algorithms for task assignment in distributed systems. IEEE
Transactions on computers, 37(11):1384–1397, 1988.
[12] John S Loucks and F Robert Jacobs. Tour scheduling and task assignment of a heterogeneous work force: A heuristic approach. Decision Sciences, 22(4):719–738, 1991.
[13] Amnon Meisels and Andrea Schaerf. Modelling and solving employee timetabling problems.
Annals of Mathematics and Artificial Intelligence, 39(1-2):41–59, 2003.
[14] Malte L Peters and Stephan Zelewski. Assignment of employees to workplaces under consid-eration of employee competences and preferences. Management Research News, 30(2):84–99, 2007.
[15] Ayed Salman, Imtiaz Ahmad, and Sabah Al-Madani. Particle swarm optimization for task assignment problem. Microprocessors and Microsystems, 26(8):363–371, 2002.
[16] Scott E Sampson. Optimization of volunteer labor assignments. Journal of Operations
Man-agement, 24(4):363–377, 2006.
[17] Andrea Schaerf and Amnon Meisels. Solving employee timetabling problems by generalized local search. InCongress of the Italian Association for Artificial Intelligence, pages 380–389. Springer, 1999.
[18] Chien-Chung Shen and Wen-Hsiang Tsai. A graph matching approach to optimal task as-signment in distributed computing systems using a minimax criterion. IEEE Transactions on
Computers, 100(3):197–203, 1985.
[19] Randy K. Smith, Joanne E. Hale, and Allen S. Parrish. An empirical study using task assignment patterns to improve the accuracy of software effort estimation. IEEE Transactions