ISSN:1992-8645 www.jatit.org E-ISSN:1817-3195
MEL FREQUENCY CEPSTRAL COEFFICIENTS (MFCC)
FEATURE EXTRACTION ENHANCEMENT IN THE
APPLICATION OF SPEECH RECOGNITION:
A COMPARISON STUDY
1SAYF A. MAJEED,2HAFIZAH HUSAIN,3SALINA ABDUL SAMAD,4TARIQ F. IDBEAA
1,2,3,4Digital Signal Processing Lab, Department of Electrical, Electronic and System Engineering,
Universiti Kebangsaan Malaysia, 43600 UKM, Bangi, Selangor, Malaysia
E-mail:[email protected],[email protected],[email protected],[email protected]
ABSTRACT
Mel Frequency Cepstral Coefficients (MFCCs) are the most widely used features in the majority of the speaker and speech recognition applications. Since 1980s, remarkable efforts have been undertaken for the development of these features. Issues such as use suitable spectral estimation methods, design of effective filter banks, and the number of chosen features all play an important role in the performance and robustness of the speech recognition systems. This paper provides an overview of MFCC's enhancement techniques that are applied in speech recognition systems. The details such as accuracy, types of environments, the nature of data, and the number of features are investigated and summarized in the table combined with the corresponding key references. Benefits and drawbacks of these MFCC's enhancement techniques have been discussed. This study will hopefully contribute to raising initiatives towards the enhancement of MFCC in terms of robustness features, high accuracy, and less complexity.
Keywords: Mel Frequency Cepstral Coefficients (MFCC); Feature Extraction; Speech Recognition.
1. INTRODUCTION
Speech is probably the most crucial tool for communication in our daily lives. Therefore constructing a speech recognition system is desirable at all times. Basically, speech recognition is the process of converting an acoustic signal to a set of words. The recognized words can be the final results, as for applications such as commands and control, data entry, and document preparation. They can also serve as the input to further linguistic processing in order to achieve speech understanding. Many parameters have an impact on the accuracy of speech recognition system such as speaker dependency, vocabulary size, recognition time, type of speech (continuous, isolated) and recognition environment condition. A speech recognition systems involve several procedures in which signal modeling or what is known as feature extraction and classification (pattern matching) are typically important. Feature extraction refers to procedure of transforming the speech signal into a number of parameters, while pattern matching is a task of obtaining parameter sets from memory which closely matches the parameter set extracted
from the input speech signal. In simple words, the essence a speech recognizer is to provide a powerful and accurate mechanism to transcribe speech into text [1].
ISSN:1992-8645 www.jatit.org E-ISSN:1817-3195 The intention of this review is to examine and
classify the most significant enhanced approaches in MFCC algorithm applied to speech recognition, which will offer a beneficial knowledge on the challenges and issues that have been confronted and their solutions. The rest of this paper is organized as follows: section 2 describes the conventional MFCC feature extraction algorithm. Section 3 discusses the enhancement techniques for the MFCC algorithm. Section 4 discusses the enhancement techniques of MFCC, and the conclusion is summarized in section 5.
2. MEL FREQUENCY CEPSTRAL
COEFFICIENTS (MFCC) FEATURE EXTRACTION
The first stage of speech recognition is to compress a speech signal into streams of acoustic feature vectors, referred to as speech feature vectors. The extracted vectors are assumed to have sufficient information and to be compact enough for efficient recognition [5]. The concept of feature extraction is actually divided into two parts: first is transforming the speech signal into feature vectors; secondly is to choose the useful features which are insensitive to changes of environmental conditions and speech variation [6]. However, changes of environmental conditions and speech variations are crucial in speech recognition systems where accuracy has degraded massively in the case of their existence. As examples of changes of environmental condition: changes in the transmission channel, changes in properties of the microphone, cocktail effects, and the background noise, etc. Some examples of speech variations include accent differences, and male-female vocal tract difference. For developing robust speech recognition, speech features are required to be insensitive to those changes and variations. The most commonly used speech feature is definitely the Mel Frequency Cepstral Coefficients (MFCC) features, which is the most popular, and robust due to its accurate estimate of the speech parameters and efficient computational model of speech [7]. Moreover, MFCC feature vectors are usually a 39 dimensional vector, composing of 13 standard features, and their first and second derivatives. The procedure of this MFCC feature extraction is explained and summarized as follows in Figure 1 [6].
Figure 1: The standard procedures of MFCC feature extraction [6]
Pre-emphasis: In this step, the signal spectrums are pre-emphasized, and the DC offset is removed, a low order digital system (generally a first order FIR filter) is applied to the digitized speech signal
x(n) to spectrally flatten the signal in order to make
it less susceptible to find precision effects later in the signal processing [7, 8].
( ) = 1 − 0.9 < < 1 (1)
The most typical value of a is about 0.95 [7]. However, the signal spectrum is boosted approximately 20 dB/decade by pre-emphasis filter [6-8].
Framing The speech signal is normally divided into small duration blocks, called frames, and the spectral analysis is carried out on these frames. This is due to the fact that the human speech signal is slowly time varying and can be treated as a quasi-stationary process. The very popular frame length and frame shift for the speech recognition task are 20-30 ms and 10 ms respectively [8].
Windowing After framing, each frame is multiplied by a window function prior to reduce the effect of discontinuity introduced by the framing process by attenuating the values of the samples at the beginning and end of each frame. The Hamming window is commonly used, it decreases the frequency resolution of the spectral analysis while reducing the sidelobe level of the window transfer function [6, 9]
( ) = ( ) ( ) (2)
Hamming window is used for speech recognition task as:
( ) = 0.54 − 0.46cos( ) (3)
[image:2.612.317.525.76.167.2]ISSN:1992-8645 www.jatit.org E-ISSN:1817-3195 information. Phase information is usually removed
and only the magnitude of the spectral coefficients are extracted. Additionally, it is common to utilize the power of the spectral coefficients [6, 8]. DFT can be defined as:
( ) = ∑ ( ) 0≤ , ≥ − 1 (4)
Where ( ) are the spectral coefficients, and
( )the framed speech signal
[image:3.612.98.288.348.461.2]Mel filtering A group of triangle band pass filters that simulate the characteristics of the human's ear are applied to the spectrum of the speech signal. This process is called Mel filtering [10]. The human ears analyze the sound spectrum in groups based on a number of overlapped critical bands. These bands are distributed in a manner that the frequency resolution is high in the low frequency region and low in the high frequency region as illustrated in Figure 2 [6].
Figure 2: The Mel-scale filter bank [6]
The Mel frequency is computed from the linear frequency as:
= 2525 × log(1 + ) (5)
Where is the Mel frequency for the linear frequency f. The filter bank energy is obtained after Mel filtering.
= ∑ | ( )| . ( ) (6)
Where| ( )|is the amplitude spectrum, is the frequency index, are the ithMel band pass filter,
1 ≤ ≤ , and is number of Mel-scaled triangular band-pass filters. is the filter bank energy.
Natural logarithm The natural logarithm approximates the relationship between the human's perception of the loudness and the sound intensity [11]. Furthermore, the natural logarithm converts
the multiplication relationship between parameters into addition relationship [12]. The convolutional distortions, like the filtering effect of microphone and channel, plus the multiplication in the frequency domain, like the amplification of soft sound, become simple addition after the logarithm [6].
Discrete cosine transform The cepstral coefficients are obtained after applying the DCT on the log Mel filterbank coefficients [13]. The higher order coefficients represent the excitation information, or the periodicity in the waveform, while the lower order cepstral coefficients represent the vocal tract shape or smooth spectral shape [14, 15]. DCT can be defined as:
= ∑ log( ) .( ) (7)
In speech recognition systems, only the lower order coefficients (order<20) are being used, thus a dimension reduction is achieved. Another advantage of DCT is that the created cepstral coefficients are less correlated compared to log Mel filterbank coefficients [6].
Log energy calculation The energy of the speech frame is additionally computed from the time-domain signal of a frame as a feature along with the normal MFCC features. In some cases, it is replaced by C0, the 0th component of the MFCC feature, which is the sum of the log Mel filterbank coefficients [6].
Derivatives and accelerations calculation The time derivatives (the first delta) and accelerations (second delta) are used to restore the trend information of the speech signals that have been lost in the frame-by-frame analysis. The derivative of coefficient x(n) can be calculated as [14]
̇( ) ≡ ( ) ≈ ∑ ( + ) (8)
Where 2M + 1 is the number of frames regarded in the evaluation. To produce the second order derivative, the same formula can be applied to the first order derivative. The final feature vectors are formed simply by adding the derived features to the original cepstral features.
3. MFCC ENHANCEMENT APPROACHES
Robustness is a major concern for speech recognition systems, especially when they are 0 0.5 1 1.5 2 2.5 3 3.5 4
0 0.1 0.2 0.3 0.4 0.5 0.6 0.7 0.8 0.9 1
ISSN:1992-8645 www.jatit.org E-ISSN:1817-3195 deployed or embedded in real world applications
that are surrounded by ambient noises or degradation factors. The authors explore several approaches that have been proposed to ameliorate the performance of speech recognizers in noisy environments.
3.1 Spectral Estimation Enhancement
As mentioned earlier in section 2, MFCC used DFT as a spectral estimation method. In this section, we will reviewed the most powerful approaches used to enhance the spectral estimation.
3.1.1 group delay function (GDF)
[image:4.612.313.524.560.649.2]This method based on the Fourier transform phase of a signal, instead of the conventional Fourier transform magnitude for speech recognition [16]. Where, it has been shown recently how the phase spectrum is informative [17, 18], leading to derive significant features from the phase spectrum of the signal. The group delay function is generally processed to obtain significant information like peaks in the spectral envelope. Given a discrete-time real signal x(n), Fourier transform is given by
( ) = | ( )| ( ) (9)
The Group delay function is then defined as
( ) = − ( ) (10)
Where ( )is the GDF and can be computed from the speech signal directly:
( ) = ( ) ( )| ( )|( ) ( ) (11)
Where R, and I denoted the real and imaginary part, ( ), and ( )are the Fourier transform of noisy ( )and clean ( )speech respectively.
Murthy and Gadde [16] have modified the group delay function (MGDF) to reduce the effect of zeros by replacing the power spectrum|X(w)| in the denominator with the cepstrally smoothed power spectrum(S(w)) using lower order cepstral window that capture the dynamic range of|X(w)|. This gives the MGDF as:
̃ ( ) = ( ) ( )( ( ))( ) ( ) (12)
However, there are limitations on representation of the speech signal, when the features derived
from either the power spectrum or the phase spectrum.
In 2004, [18] extracted the MFCC coefficients from the product spectrum which merge the power spectrum and the phase spectrum. These coefficients are called Mel-frequency product spectrum cepstral coefficients (MFPSCCs). In their work a comparison has also carried out with the conventional MFCC and MFMGDCCs which based on Mel-frequency modified group delay cepstral coefficients. Results indicated that the MFPSCCs offered the best performance. The product spectrum
Q(w)is the product of the power spectrum and the GDF as follows:
( ) = | ( )| ( ) = ( ) ( ) +
( ) ( ) (13)
3.1.2 autocorrelation processing
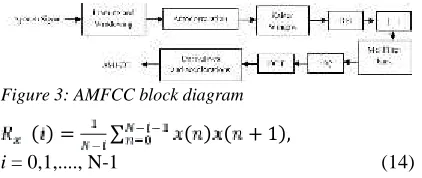
The first use of the autocorrelation domain with MFCC was in [18], while the extracted features called autocorrelation Mel frequency cepstral coefficient (AMFCC). Furthermore, autocorrelation domain has two important properties: Pole preserving property, the poles of the autocorrelation sequence is going to be just like the poles of the original signal [19]. This implies the features extracted from the autocorrelation sequence could substitute the features extracted from the original speech signal. The second property is noise separation, the speech signal information is distributed over all the lags in the autocorrelation function, while the noise signal is limited to lower lags in the autocorrelation function. Consequently, providing an effective way to eliminate the noise by removing lower-lag autocorrelation coefficients. Figure 3 illustrated the method of the AMFCC, while the autocorrelation for each frame is calculated using equation (14) [20, 21].
Figure 3: AMFCC block diagram
( ) = ∑ ( ) ( + 1),
i = 0,1,...., N-1 (14)
Where i is the lag index in the Autocorrelation sequence
ISSN:1992-8645 www.jatit.org E-ISSN:1817-3195 sequence. Then a Kaiser window which has a 80
dB side lobe attenuation is applied on the one-sided higher-lag autocorrelation sequence. Next the windowed autocorrelation sequence is processed by Fourier transform to get the power spectral estimation of the signal. This spectrum will be used to get the 13 AMFCCs. The dynamic range of the resulting spectrum estimate is the same order as the power spectrum of the original speech signal.
The final AMFCC features set (39 features) are obtained by concatenating the delta and double delta to the base features set, Experiment results by Shannon and Paliwal showed that these features were more robust to background noise than conventional MFCC [20].
The disadvantage of this method is using the Kaiser window which is computationally more costly compared to the Hamming window. Shannon and Paliwal [20], proposed a design method for computing a window function that contains twice the dynamic range of the Hamming window function used on the time domain signal, they called this window function double dynamic range (DDR) Hamming window and its dynamic range was about 86 dB. Their experiments proved that (DDR) Hamming window works just like the Kaiser window function in terms of its spectral estimation performance. Furthermore, the performance of AMFCC features was much better than MFCC features for noisy environment [20].
The AMFCC was one of the methods that work in the magnitude domain. On the other hand, the phase domain (angle) has received more attention by the researchers [22, 23]. Mainly because phase (angle) is less sensitive to the external noise than the magnitude. However, phase autocorrelation (PAC) is an example of the phase domain.
The measure of correlation in phase autocorrelation used the angle between the signal vectors rather than the dot product. Therefore the features expectation will be more robust to noise when compared with the conventional features, which are based on the normal autocorrelation [22].
The phase differences between various sinusoidal components in the speech signal were removed in Equation (14) which is computed as a dot product. However, if two vectors defined as:
= { ̃ [0], ̃ [1], … , ̃ [ − 1]}
= { ̃ [ ], … , ̃ [ − 1], ̃ [0], … , ̃ [ − 1]}(15)
[ ] = (16)
The magnitude of the two vectors and is the same, since the set of individual vector components of these two vectors is the same. If‖ ‖ represents the magnitude of the vectors and the angle between them in the N dimensional space, then Eq. (16) can be rewritten as:
[ ] = ‖ ‖ cos( ) (17)
The new set of correlation coefficients [ ]are created by using the angle θ as the measure of correlation, instead of the dot product. These coefficients [ ]are computed as:
[ ] = = cos ‖ ‖[ ] (18)
From the above mentioned equations, PAC coefficients [ ] depend only on which is expected to be less susceptible to the external noise, as compared to [ ].
This method was applied to MFCC in [22], the proposed features are known as PAC MFCC which showed superior to conventional MFCC in noisy speech, while in the clean speech the conventional MFCC showed superiority.
The two main reasons of this issue are firstly the frame energy information has been discarded, which supposedly was to be crucial for the clean speech. Secondly, the inverse cosine operation was further degraded the clean speech due to the smoothing of the spectral valley.
3.1.3 minimum variance distortionless response (MVDR)
The Minimum Variance Distortionless Response (MVDR) spectrum is also referred to as minimum variance (MV) spectrum, the Capon method, and the maximum likelihood method (MLM). This
method provides all-pole spectra that are robust for
modeling both voiced and unvoiced speech. However, the high order MVDR spectrum models voiced speech spectra effectively, especially at the perceptually important harmonics, and features a
smooth contoured envelope [24]. The power
ISSN:1992-8645 www.jatit.org E-ISSN:1817-3195
In contrast, in the MVDR method the power measuring filters determined by the distortionless filters are data dependent and frequency dependent. Consequently, the MVDR spectrum has been found to have higher frequency resolution than the DFT based methods [25, 26].
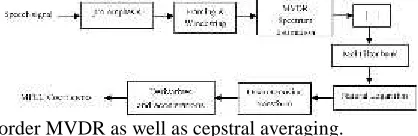
Utilization of MVDR in MFCC is reported in [25] where it has used as spectrum estimation techniques. Figure 4 shows a schematic diagram of
the MVDR-based MFCC. Regardless, the problem
with this method was the high computation of
[image:6.612.91.300.238.306.2]high-order MVDR as well as cepstral averaging.
Figure 4: Schematic diagram of the MVDR-based MFCC
Another study [26] has utilized the regularized minimum variance distortionless response (RMVDR). This method penalizes the rapid changes in all-pole spectral envelope and consequently, produces a smooth spectral estimate keeping the formant positions unaffected. Experimental results showed that the RMVDR gave significant improvement in word accuracy over the MVDR-based MFCC and conventional MFCC methods.
3.2 Enhancement of Mel Filter Banks
The functions of filter banks had been mentioned in section 2, However, many methods have been proposed at this stage to improve the robustness of the features in MFCC. Some researchers tried to optimize the shape of each filter in the filter-bank, while the others tried to manipulate with the number of filters. The most important and powerful techniques have been highlighted and discussed.
3.2.1 shape of the filter
In order to achieve more discriminative representation of speech features, a series of work of filter-bank design has been introduced in [27]. In this study, positions, bandwidths, and shapes of the filters in the filter-bank can all be adjusted and optimized based on the criterion of Minimum Classification Error (MCE). Although this may be true, the MCE training needs high computation complexity with many different parameters to be determined altogether for a certain task. As an example, the overall filter-bank is required to be re-trained when the back-end classifier structure is
relatively adjusted for an alternative task with different speech corpus.
However, [28] applied the principal component analysis (PCA) on the Mel filter-bank to drive the shape of each filter. Based on PCA, the shapes of filters are totally different from one another as well as not necessarily triangular. Let the kth filter coefficients are the components of the column vectorw , where
= [ (1) (2) … ( )] (19)
Then, the PCA optimized kth filter coefficients represented by the column vector , which is defined as:
, = max Σ (20)
The largest variance of the kth filter output
= , can be obtained when = , . Furthermore, , is generally proved to be the eigenvector of the covariance matrix Σ , of , corresponding to the largest eigenvalue. This method is easy to achieve for a given task and corpus. However, experiments indicated that the extracted features with PCA-optimized filter-bank are better performance in noisy environment and comparable performance for clean speech in comparison with the conventional MFCC features [28]. It's because the PCA-optimized filter-bank maximizes both the signal to noise variance as well as the variation of the features.
Nonetheless, this method has a major drawback as several filter coefficients might be negative because those coefficients are the components of an eigenvector of a covariance matrix, which means this may result in the filter output , =
, be negative, thus fails to be converted into
the log-spectral domain. This issue was solved by [29], who has modified the PCA under constraints for optimizing the filter. The PCA was modified as follows:
, = max ( ), ( ) =
( ) = Σ (21)
under two constraints,
( ) ≥ 0, 1 ≤ ≤ and ∑ ( ) = 1
ISSN:1992-8645 www.jatit.org E-ISSN:1817-3195 largest eigenvalue. While constraint two is similar
to the condition of an eigenvector.
3.2.2 number of filters
Only a few works are examined and compared the effect of the number of filters and enumerated parameters to the speech recognition accuracy. [30] examined a lot of experiments to verify the optimum number of coefficients enumerated in the MFCC that provide the best accuracy. Literally, these experiments were conducted either by an increasing of filters' number for a fixed number of coefficients or opposite, by increasing the number of coefficients for a fixed number of filters (bands). The bank of filters was increased from 4 to 26 filters while the number of coefficients was enumerated from 4×3=12 to 26×3=78, including the static MFCC, delta, and double delta. Their results showed that the best accuracy oscillates between 82 and 83.5%. However, with 9 filters and 7×3=21 coefficients, a very high accuracy and stable was obtained. This work considered evidence that the optimal setting of the MFCC can be achieved with a significantly less number of filters as compared to what was recommended by the critical bandwidths theory.
Recently, A novel approach that utilizes the Artificial Intelligence techniques like genetic algorithm (GA) and particle swarm optimization (PSO) to optimize the number and spacing of Mel filter bank in MFCC features has been used in [31]. The triangular Mel filterbank was optimized according to three parameters which match the frequency values: when the triangle for the filter
begins with α (Left), reaches up to its maximum β (center), lastly ends in γ (Right). Each chromosome
in GA represents a different filterbank, which is defined as a series of triangular filters represented
by three frequencies α, β, and γ. Filterbank can be
defined as:
= [ | = 1, … , ] (22)
Where is a 3-tuple (α , β , γ ), and number of filters. The filter edge frequencies needs to be improved within a limit, where (left edge < center edge < right edge) is required to be retained. MFCC filterbank optimization by genetic algorithm had better performance at lower SNRs like 6 dB, 12 dB and 18 dB as compared to conventional MFCC.
On the other hand, the particle swarm optimization (PSO) is a type of optimization tool depends on iteration, particle swarm optimization
(PSO) has memory ability besides his global searching ability. In the multi-dimensional space, each particle in the swarm is migrated towards the optimal point of having a velocity with its position. Three elements which control the velocity of a particle are inertial momentum, cognitive, and social. At a specific time, the best position (best fitness) found by each particle known as pbest, while gbest refers to the overall best out of all the particles in the population. The position of each particle moves toward pbest and gbest depending on the particle velocity, which is defined over the following iteration as [31, 32]:
= + − +
− (23)
Where w is the inertia weight, which is used to manage the impact of the previous history of velocities on the current velocity. Appropriate selection of the inertia weight gives a balance between global and local exploration abilities, thereby requires less iteration on average to obtain the optimum; and are acceleration constants which guiding the particles into the improved positions, they deal with the relative influence toward pbest and gbest by scaling each resulting distance vector; and are uniformly distributed random variables between 0 and 1, and refers to the evolution iteration. Selecting these parameters play a crucial role in the optimization process [33].
The individual initial population particles are set up randomly as X_i=(X_i1,X_i2,…,X_id), using
the same width as the width of MFCC filterbanks. In addition a size of 100 particles of the swarm has been selected as the ideal compromise between the performance and the computational time.
Experiments in [31], proved that the optimized filterbank by PSO has less numbers of filters performed either lower or equal in performance when compared to conventional MFCC. Moreover, PSO is superior to GA due to its high accuracy and fast convergence (around 15 generations) in comparison to that for GA (around 35 generations).
ISSN:1992-8645 www.jatit.org E-ISSN:1817-3195 vocal tract was considered as a straight uniform
tube of length L based on this Model, changing in L by a specific factorα leads to a scaling of the frequency axis by α. Hence, the frequency axis needs to be scaled to compensate for the variability caused by various vocal tracts of individual speakers [35]. A mathematical relation of this scaling can be defined:
= ( ) (24)
Where is warped-frequency, and ( )is the frequency-warping function.
There are a lot of interesting to obtain a direct linear transformation between static conventional (MFCC) features C and the static VTLN-warped MFCC ( ), since = .WhereA represents a matrix transformation, which from it the VTLN-warped cepstra can be obtained directly from static conventional MFCC features .
[36] suggested to integrate the VTLN-warping into the Mel bank in which the Mel filter-bank is inverse-scaled for each α. This is basically
[image:8.612.92.297.454.562.2]the most widely used procedure for VTLN-warping as it is shown in Figure (5), refers to the (inverse) VTLN-warped Mel filter-bank. Traditionally the warp-factor (α) used for warping the spectra is in the range of 0.80 to 1.20 according to physiological justifications.
Figure 5: Warp VTLN Method [36]
The warped cepstral features can be computed by:
= [log( . )] (25)
Where is the warped cepstral features, P is the power spectrum of a frame of speech signal, is the DCT transformation, and is the Mel-VTLN Filter bank.
However, the features extracted from different speakers with similar utterance should be matched as much as possible after using the VTLN [37, 38].
3.2.4 minimum mean square error (MMSE) noise suppressor
The concept of this algorithm or what is known as MFCC-MMSE is to estimate the clean speech MFCC from the noisy speech for each cepstrum dimension by minimizing the mean square error between the estimated MFCC and the true MFCC uses the assumption that noises are additive [38]. This algorithm is applied on the Mel filter bank’s
outputs which can be better smoothed (lower variance) compared to Fourier Transform spectral amplitude.
MFCC-MMSE algorithm which has been motivated by the MMSE criterion is proposed by [39]. In this work MFCC-MMSE algorithm has been compared with the traditional MMSE. The results showed its superiority. Another advantage is its economical computation in comparison with the traditional MMSE considering that the number of the frequency channels in the Mel-frequency filter bank is significantly smaller than the number of bins in the DFT domain [39, 40].
3.2.5 teager energy operator (TEO)
Teager Energy Operator (TEO) has the capability to capture the energy fluctuation within a glottal cycle [41] also it reflects the nonlinear airflow structure of speech production. The earlier using of TEO in feature extraction was in [42-44]. Classic energy measure shows only the amplitude of the signal, while Teager Energy (TE) shows the variations in both amplitude and frequency of the speech signal. This extra information in the energy estimation enhances the performance of speech recognition.
This concept was presented systematically on speech production modeling in [45]. Teager Energy operator in time domain was given by:
Ψ[ ( )] = ( ) − ( + 1) ( − 1) (26)
WhereΨis the TEO for the speech signal ( ).
The energy estimation by TEO is robust if the TEO is applied to the band-pass signals. TEO provides a more suitable representation of nonlinear variations of energy distribution in frequency domain [43, 46]. So the TEO in frequency domain can be written as
Ψ[ ( )] = ( ) − ( + 1) ( − 1) (27)
ISSN:1992-8645 www.jatit.org E-ISSN:1817-3195 Average energy E of ith sequence Y (k)of mth
frame is:
E = ∑ |[ ( )]| (28)
i = 1,2,...., L m = 1,2,..,M
Where L is the total number of filters in a Mel filter bank and Ni is the number of frequency
samples in the spectrum. So average frame energy
E of mthframe is
E = ∑ E (29)
Correspondingly, average Teager energy of
ithsequenceΨ[ ( )]of mthframe is
= ∑ |Ψ[ ( )]| (30)
While the average frame Teager energy of
mthframe is
= ∑ (31)
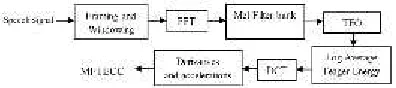
[image:9.612.92.290.462.506.2]MFCC algorithm has been modified depending on TEO in [47], where each Mel filter output is enhanced using TEO. The estimated features referred to as Mel Frequency Teager Energy Cepstral Coefficients (MFTECC). Figure (6) below shows the MFTECC feature extraction method.
Figure 6: MFTECC feature extraction method
Teager Energy was calculated for each triangular Mel filter bank output by equation (27), then the 39 cepstrum coefficients are estimated by applying DCT on log of , the delta, and double delta coefficients. The results indicated that the proposed MFTECC worked better than conventional MFCC when the speech signal corrupted by various additive noises [47].
3.2.6 minimum variance distortionless response (MVDR)
As mentioned earlier, the Minimum Variance Distortionless Response (MVDR) has been used for
power spectrum estimation [24-26]. However,
another use of MVDR was for spectral envelope
extraction instead of the spectrum estimation.These
features are known as Perceptual MVDR-based
cepstral coefficients (PMCCs), and it substantially outperformed the MVDR-based MFCC method [48, 49].
It is well known that the main function of the filterbank is to smooth the harmonic information like pitch which it is existed in the FFT spectrum as well as to track the spectral envelope. The performance of filterbank in smoothing the pitch information is noticeably decreased for high-pitch speakers, simply because filters are spaced closely at low frequencies. As a result, the filterbank makes a gross spectrum that carries significant pitch information which is not desirable for speech recognition applications [50]. On the other hand, It was proved in [24] that MVDR is a suitable spectral envelope modeling method for a broad number of speech phoneme classes, particularly for high-pitched speech. Accordingly, [51] have deduced that it is safe and useful to discard the filterbank and integrate the perceptual considerations into the FFT spectrum. Thus, Perceptual MVDR (PMVDR) has proposed by them, which is directly performed warping on the DFT power spectrum, while the filterbank processing step was entirely removed [51]. This can be accomplished by implementing the perceptual scale through 1st order all-pass system, in which the Mel scales were based on
adjusting the single parameter α of the system, in
the first order system the ( ), and the warped frequency described as:
( ) = , | | < 1 (32)
= tan ( ) ( )( ) (33)
Where ω represents the linear frequency, while
the valueof α manages the level of warping.In this work the comparison in performance of PMVDR, PMCC, and MFCC was performed, the final results showed that the PMVDR works more effectively than MFCC and PMCC in terms of accuracy and computational complexity [51].
3.3 Psychoacoustic Modeling
ISSN:1992-8645 www.jatit.org E-ISSN:1817-3195 simultaneous based on the time of occurrence of the
signals. Nevertheless, In temporal masking, if the masker appears earlier in time leading the signal, the masking effect is named forward masking. While it is known as backward masking if the masker occurs after the signal [53]. Forward masking is more effective than backward masking, for that reason, many modeling and applications have been focused on forward masking [54, 55].
[image:10.612.318.525.134.182.2]In simultaneous masking, if the two sounds occur simultaneously, then the masking effect between them is known as simultaneous masking. One of the most effective process of simultaneous masking is lateral inhibition (LI). LI is a kind of phenomenon associated with sensory reception of biological systems, the basic function of lateral inhibition is to sharpen input changes. The characteristic curve of lateral inhibition is shown in Figure 7a, the easiest method to model the lateral inhibition is 1D Mexican-hat filter as shown in Figure 7b [56, 57].
Figure 7: Characteristic curve of Lateral Inhibition[57]
LI simply looks to the masking effects for each frame in the frequency domain. While forward masking becomes effective in time domain. Forward masking affects the signals with similar frequency as the masker, which usually takes place after the masker in time domain. Based on the neuron response studies, a strong masker can mask a weaker signal of a close frequency occurring later in time [58]. Thus the idea of a pioneering 2D psychoacoustic modeling, which takes care of the masking effect over a 2D surface based on time and frequency. Using this algorithm, the masker will provide masking effect both in the time domain and frequency domain [57].
[57] have integrated the MFCC algorithm with 2D Psychoacoustic filter and Forward masking. The 2D Psychoacoustic filter is developed depending on the assumption that the simultaneous masking or (LI) and temporal masking share similar set of parameters because both have the same shape of the characteristic curve which is similar to 1D Mexican hat. Nevertheless the validity of this assumption
relies on lots of things, including frame rate, and sampling rate. Figure 8 shows the flowchart of MFCC with 2D Psychoacoustic Modeling.
Figure 8: Flowchart of MFCC with 2D Psychoacoustic Modeling
[image:10.612.318.511.344.452.2]The results were compared with conventional MFCC under different SNR, The recognition rate increases by nearly 5% on average, which can be considered an excellent enhancement [55, 57]. However, there are various mathematical models for explaining a temporal masking effect [59-61]. They all concluded that the parameters of temporal masking cannot be symmetric. It must be warped to obtain a new set of temporal masking parameters, which should emulate the characteristic curve in Figure 9.
Figure 9: Temporal Masking [55]
[image:10.612.91.298.344.440.2]Therefore, both sides of the mask should linearly warped. Beginning from the 1D Mexican hat in Figure 7(b), each side was modified proportionally, making the right side become 7/4 times of the original length while the left side become 1/4 the length of the original. The warped parameter and the original parameter shown in Figure 10.
[image:10.612.320.518.547.693.2]ISSN:1992-8645 www.jatit.org E-ISSN:1817-3195 This 2D psychoacoustic filter uses to improve the
high frequencies and sharpen the spectral peaks. In 2011, [55] have proposed and applied the warped 2D Psychoacoustic filter with MFCC, a comparison has done against conventional MFCCs, forward masking (FM), lateral inhibition (LI), and the original 2D filter. All of them are integrated with MFCC algorithm. The final results confirm that 2D Psychoacoustic filter successfully increases the recognition rate under noisy environments. Table 1 shows the experimental results. Avg 0-20 refers to the average over SNR 0-20 dB.
Table 1: Recognition Rate (%) of Warped 2D Filter Vs. Other Techniques [55]
SNR (dB) Clean 10 Avg 0-20
MFCC (39) 99.3617 81.16 71.29
FM 99.0283 85.89 77.34
LI 99.4217 83.29 73.97
FM+LI 99.0617 86.26 77.47
Original 2D 99.3150 87.41 77.64
Warped 2D 99.3267 90.21 80.36
Further study done by [62] has indicated that the duration of speech signal can has an effect on the entire masking, which is known as temporal integration (TI). A temporal integration describes how portions of information are linked together by the listener which are coming to the ears at different times in mapping speech sounds onto meaning [63]. It is well known that speech has active/non-active durations its power is more focused in some areas, both longer in duration and larger in energy. Consequently, temporal integration apt to impose more impact on speech. [62] were successfully implemented forward masking (FM), lateral inhibition (LI) and temporal integration (TI) using a 2D psychoacoustic filter in a MFCC based speech recognition system. They are proving that temporal integration can help to improve the SNR of the noisy speech. The proposed 2D psychoacoustic filter was successfully removed noise. Furthermore, significant improvements were achieved based on experimental results.
3.4 Utilization of Wavelet Transform
The wavelet transform utilizes short windows to determine the high frequency information in the signal, while the low frequency content of the signal measured by long windows. In theory any function with zero mean and finite energy can be a wavelet.
The first utilization of the wavelet transform in speech recognition has been done in [64] who have implemented the Discrete Wavelet Transform (DWT) to the Mel-scaled log filterbank energies of
a speech frame to obtain the new features known as Mel-Frequency Discrete Wavelet Coefficients (MFDWC). MFDWC tried to achieve good time and frequency localization similar to subband-based (SUB) features and multi-resolution (MULT) features. Regardless, MFDWC has superior time/frequency localization in comparison to SUB and MULT features. The MFDWC features yielded better recognition rates than SUB, MULT and the conventional MFCC [64].
Sub-Band Wavelet Packets (WPs) decomposition strategy has been another approach used in [65]. In this work, the frequency band has been divided into three bigger bands. The first band from 0-1 kHz and the third band from 3-5.5 kHz are the wide dividing frequency bands. The second band from 1-3 kHz was divided into detailed frequency bands spacing the same as the Mel scale due to the well-known fact that the most sensitive frequency range of the human ear is from 1 kHz to 3 kHz. The experiment results demonstrated that the recognition rate of Sub-Band WPs approach successfully outperformed that of the conventional MFCC. Their proposed Sub-Band WPs approach was improved the recognition rate while the dimension of feature did not increase [65].
However, [66] proposed new MFCC
enhancement technique based on the bark wavelet [66]. The Bark wavelet is designed in particular for speech signal. It is depending on the psychoacoustic Bark scale. Furthermore, Gaussian function selected as mother function of Bark wavelet, mother wavelet needs to have the equal bandwidth in the Bark domain. The wavelet function in the Bark domain written as:
( ) = (34)
The constant is selected as 4ln2, when the bandwidth is 3dB. b is the bark frequency which can be obtained from the linear frequency by:
= 13. arctan(0.76 ) + 3.5. arctan(. ) (35)
ISSN:1992-8645 www.jatit.org E-ISSN:1817-3195
Figure 11: The block diagram of BWMFCC features coefficients
The wavelet transform portioned signal frequency into 25 sub-bands. Then DFT has applied to each of those bands. Subsequently Mel filter bank and logarithmic energy are carried out on the synthesized spectra. Then applying the bark wavelet transform to the logarithmic energy to get the final speech features. The result indicated that BWMFCC features can keep on high recognition rate under low SNRs [66].
The weakness of the BWMFCC is the weak understandability of the speech signals which are analyzed by the fixed wavelet threshold. [67] have applied adaptive wavelet thresholding to enhance the noisy speech corrupted by white and colored noises. Based on the types of noise, Several types of the adaptive threshold function of the wavelet transform are utilized to improve the noisy speech signals.
ℎ ( , ) = 0 ( )(| | − ) | | <| | ≥ (36)
Where is the wavelet coefficient before de-noising on scale i, ℎ ( , ) is the wavelet coefficient after thresholding, is the soft threshold function defined as (37):
= 2 (37)
Where N is the sequence length of the input signal,δis the noise standard deviation. The soft threshold function of equation (37) may vary based on the variety of the noise standard deviation. This approach is known as Enhanced Bark wavelet MFCC (EBWMFCC), which has more effective features than BWMFCC in low SNR [67].
3.5 Log Function Enhancement
The main objective of Logarithm function is to compress the Mel filter bank energies as well as to lower their dynamic range. The problems of Logarithm function are inability to identify the energies which are less affected by noise. Also, the
negligible distortions in the power spectrum domain become significant after the logarithmic compression of Mel filter bank energies [68]. In order to find solutions to this problem. [69] have observed that the low energy banks are often more damaged by the noise due to the steep's slope of the log transformation in the lower energy. Therefore they proposed to replace the lower segment of the Log function by a power function as:
( ) = ≤
log + − log > (38)
This function ( ( )) incorporates a power function and the log function, where C is the noise masking level chosen based on the noise level, and is the compression coefficient specified to minimize the effects of noise while reserving as much speech information as possible to produce high clean speech. According to their experimental results the optimal values of C andλwere C = 107 and λ = 2. With this method the performance was improved effectively.
Another solution was introduced by [68], they proposed a compression function that is computed based on SNR- dependent root function in Mel sub-bands instead of log function in conventional MFCC.
The idea of this method was to compensate additive noise effects on MFCC features, the general form of proposed method can be shown by
= ( , , ) = ( − ) (39)
Where is compensated Mel filter bank output, is the compression factor and the bias relies on noise spectral characteristics. Equation (39) comprises two steps: subtraction and energy compression. In subtraction step, the reduction is performed because of the additive noise. While in compression step, the less affected filter bank energies by noise are emphasized. After that, the compensated MFCC can be calculated by the following equation (DCT equation):
= ∑ .( ) = ∑ ( −
) .( ) (40)
[image:12.612.90.304.72.190.2]ISSN:1992-8645 www.jatit.org E-ISSN:1817-3195 function. The proposed method is illustrated in
Figure 12.
Figure 12: Block diagram of the compensated MFCC [68]
The compression root function is formulated as:
= . 1 − − = . ( , ) (41)
Where is known as a constant root between 0 and 1, is a parameter that manages the steepness of the compression function, G denotes to SNR-dependent function with values between 0 and 1, and is the signal to noise ratio in ith Mel frequency sub-band. In equation (41), the low must be more compressed at sub-bands, while the high needs less compression at sub-bands. For this reason, the needs to be close to zero for high values, whilst for low values the should be close to one. formulated based on
can be computed as:
= 1 −
( )= 1 − ( ) (42)
WhereµSNR andσSNR are mean and standard deviation of SNR calculated from all Mel sub-bands of a speech frame.
However, based on the equation (41) and equation (42), the sub-band SNR controls the change in compression root . This proposed method is known as CMSBS which refers to Compression and Mel Sub- Band Spectral subtraction. CMSBS has been shown significantly increasing in the accuracy of speech recognition in the presence of various additive noises with various SNR values [68].
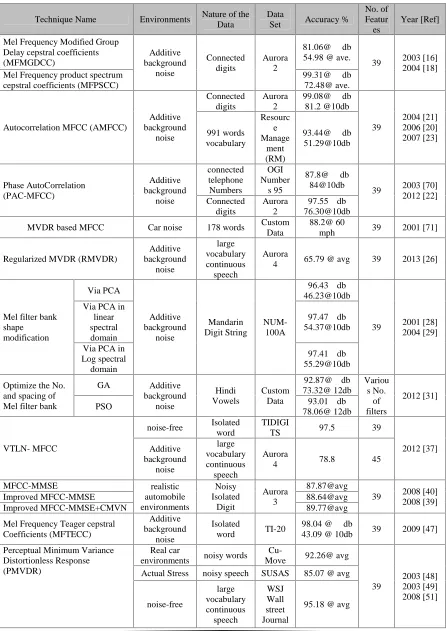
Furthermore, Table 2. summarized the most powerful enhancement techniques in MFCC algorithm with a comparison in accuracy of noisy and clean speech.
4. DISCUSSION
Although the conventional MFCC algorithm is better in clean speech, but it is highly sensitive in noisy speech. The drawbacks of MFCC features in noisy environments rely on many factors. These factors include spectrum estimation methods, design of effective filter banks, and the number of chosen features, which are also affecting the complexity of the speech recognition systems.
In conventional MFCC, only the magnitude of DFT is used as spectrum estimation, while the phase is discarded. Researchers have identified the importance of the phase spectra in performance of speech recognition systems due to their less sensitivity to additive noise compared to the magnitude spectra.
Spectrum estimation enhancement methods are varied from adding the phase spectra to the computation of spectrum estimation to using the phase spectra alone as the spectrum estimation. A good example is a group delay function (GDF). However, the authors believed that both magnitude and phase spectra are complementary to each other and should not neglect any of them.
Other factors which have a significant impact on the robustness of MFCC features is designing the Filterbank. From previous studies, It was clear that is possible to obtain robust features when a certain shape of Filter banks is selected for a certain environment. However, this method is impractical because it needs re-tuning and selecting the filter shape at every use as well as when changing the environment. In addition, it has been shown that the higher accuracy can be obtained with less number of filters compare to those used in MFCC. Therefore, the computational complexity of the subsequent stages will be reduced.
ISSN:1992-8645 www.jatit.org E-ISSN:1817-3195 5. CONCLUSION
Speech recognition systems have been recently used in wide varieties of real applications especially after the enormous technological revolution where smart phone and other gadgets within the reach of everyone. On the other hand, It is well known that MFCC features affect the accuracy of the speech recognition systems. In this review, the fundamentals of the MFCC have been discussed and a wide variety of MFCC enhancement methods have been reviewed and investigated. Most of these methods were classified in a way that became easier for the researchers to identify the improving's location and techniques used in the original MFCC algorithm. These methods vary in simplicity, and environment conditions. Usually, simplification can lead to reduce the recognition accuracy. However, the main challenges in conventional MFCC are the complexity, robustness of the features, and the weak performance in the presence of noise. However, most of the scientific studies have indicated that a large number of features can be significantly useful when it comes to noisy speech. But the processing of these features is considered computationally complex. So, there must be compatibility between the number of features on the one hand and the required accuracy of the other hand. In addition to the knowing the type of the environment and the existing noise. All these factors have a great effect on the performance and robustness of the speech recognition systems. The attention in this paper focused on the MFCC algorithm enhancement techniques in speech recognition. This research will lead to the increasing need to develop a robust and improved MFCC features in speech recognition system.
REFERENCES
[1] S. Gaikwad, B. Gawali, P. Yannawar, and S. Mehrotra, "Feature extraction using fusion MFCC for continuous marathi speech recognition," in India Conference (INDICON), 2011 Annual IEEE, 2011, pp.
1-5.
[2] S. Davis and P. Mermelstein, "Comparison of parametric representations for monosyllabic word recognition in continuously spoken sentences," Acoustics, Speech and Signal
Processing, IEEE Transactions on, vol. 28,
pp. 357-366, 1980.
[3] H. Hermansky, "Perceptual linear predictive (PLP) analysis of speech," The Journal of the
Acoustical Society of America, vol. 87, p.
1738, 1990.
[4] N. S. Nehe and R. S. Holambe, "Isolated Word Recognition Using Normalized Teager Energy Cepstral Features," in Advances in
Computing, Control, & Telecommunication Technologies, 2009. ACT '09. International Conference on, 2009, pp. 106-110.
[5] Y. Lü and Z. Wu, "Maximum likelihood subband polynomial regression for robust speech recognition," Applied Acoustics, vol. 74, pp. 640-646, 2013.
[6] X. Xiong, "Robust speech features and acoustic models for speech recognition," PhD. Thesis, 194 p., Nanyang Technological University, Singapore, 2009.
[7] M. Anusuya and S. Katti, "Front end analysis of speech recognition: a review,"
International Journal of Speech Technology,
vol. 14, pp. 99-145, 2011.
[8] L. R. Rabiner and B. B. H. Juang,
Fundamentals of Speech Recognition:
Prentice Hall, 1993.
[9] S. K. Mitra, Digital signal processing: a
computer-based approach vol. 1221: McGraw-Hill New York, 2011.
[10] X. Huang, A. Acero, and H.-W. Hon, Spoken
language processing vol. 15: Prentice Hall
PTR New Jersey, 2001.
[11] G. Von Békésy and E. G. Wever, Experiments
in hearing vol. 8: McGraw-Hill New York,
1960.
[12] T. F. Quatieri, Discrete-time speech signal
processing: Pearson Education, 2002.
[13] L. R. Rabiner and R. W. Schafer, Theory and
Applications of Digital Speech Processing:
Pearson, 2010.
[14] J. W. Picone, "Signal modeling techniques in speech recognition," Proceedings of the IEEE, vol. 81, pp. 1215-1247, 1993.
[15] Y. Ephraim and M. Rahim, "On second-order statistics and linear estimation of cepstral coefficients," Speech and Audio Processing,
IEEE Transactions on, vol. 7, pp. 162-176,
1999.
[16] H. A. Murthy and V. Gadde, "The modified group delay function and its application to phoneme recognition," in Acoustics, Speech,
and Signal Processing, 2003. Proceedings.(ICASSP'03). 2003 IEEE International Conference on, 2003, pp.
ISSN:1992-8645 www.jatit.org E-ISSN:1817-3195 [17] K. K. Paliwal and L. Alsteris, "Usefulness of
phase spectrum in human speech perception," in Proc. Eurospeech, 2003, pp. 2117-2120. [18] D. Zhu and K. K. Paliwal, "Product of power
spectrum and group delay function for speech recognition," in Acoustics, Speech, and Signal
Processing, 2004. Proceedings.(ICASSP'04). IEEE International Conference on, 2004, pp.
I-125-8 vol. 1.
[19] D. McGinn and D. Johnson, "Estimation of all-pole model parameters from noise-corrupted sequences," Acoustics, Speech and
Signal Processing, IEEE Transactions on,
vol. 37, pp. 433-436, 1989.
[20] B. J. Shannon and K. K. Paliwal, "Feature extraction from higher-lag autocorrelation coefficients for robust speech recognition,"
Speech Communication, vol. 48, pp.
1458-1485, 2006.
[21] B. J. Shannon and K. K. Paliwal, "MFCC Computation from Magnitude Spectrum of higher lag autocorrelation coefficients for robust speech recognition," in Proc. ICSLP, 2004, pp. 129-132.
[22] S. Ikbal, H. Misra, H. Hermansky, and M. Magimai-Doss, "Phase AutoCorrelation (PAC) features for noise robust speech recognition," Speech Communication, 2012. [23] G. Farahani, M. Ahadi, and M. M.
Homayounpour, "Autocorrelation-based Methods for Noise-Robust Speech Recognition," Robust Speech Recognition and
Understanding, p. 239, 2007.
[24] M. N. Murthi and B. D. Rao, "All-pole modeling of speech based on the minimum variance distortionless response spectrum,"
Speech and Audio Processing, IEEE Transactions on, vol. 8, pp. 221-239, 2000.
[25] S. Dharanipragada and B. D. Rao, "MVDR based feature extraction for robust speech recognition," in Acoustics, Speech, and Signal
Processing, 2001. Proceedings.(ICASSP'01). 2001 IEEE International Conference on,
2001, pp. 309-312.
[26] M. J. Alam, P. Kenny, and D. O'Shaughnessy, "Speech recognition using regularized minimum variance distortionless response spectrum estimation-based cepstral features," in Acoustics, Speech and Signal Processing
(ICASSP), 2013 IEEE International Conference on, 2013, pp. 8071-8075.
[27] A. Biem, S. Katagiri, E. McDermott, and B.-H. Juang, "An application of discriminative feature extraction to filter-bank-based speech recognition," Speech and Audio Processing,
IEEE Transactions on, vol. 9, pp. 96-110,
2001.
[28] S.-M. Lee, S.-H. Fang, J.-w. Hung, and L.-S. Lee, "Improved MFCC feature extraction by PCA-optimized filter-bank for speech recognition," in Automatic Speech Recognition and Understanding, 2001. ASRU'01. IEEE Workshop on, 2001, pp.
49-52.
[29] J.-w. Hung, "Optimization of filter-bank to improve the extraction of MFCC features in speech recognition," in Intelligent Multimedia, Video and Speech Processing, 2004. Proceedings of 2004 International Symposium on, 2004, pp. 675-678.
[30] J. Psutka, L. Müller, and J. V. Psutka, "Comparison of mfcc and plp parameterization in the speaker independent continuous speech recognition task,"
Proceedings of Eurospeeech, pp. 1813-1816,
2001.
[31] R. Aggarwal and M. Dave, "Filterbank optimization for robust ASR using GA and PSO," International Journal of Speech Technology, vol. 15, pp. 191-201, 2012.
[32] Z. Li, X. Liu, X. Duan, and F. Huang, "Comparative research on particle swarm optimization and genetic algorithm,"
Computer and Information Science, vol. 3, p.
P120, 2010.
[33] J. F. Kennedy, J. Kennedy, and R. C. Eberhart, Swarm intelligence: Morgan Kaufmann, 2001.
[34] A. Andreou, T. Kamm, and J. Cohen, "Experiments in vocal tract normalization," in
Proc. CAIP Workshop: Frontiers in Speech Recognition II, 1994.
[35] A. Zolnay, D. Kocharov, R. Schlüter, and H. Ney, "Using multiple acoustic feature sets for speech recognition," Speech Communication, vol. 49, pp. 514-525, 2007.
[36] L. Lee and R. Rose, "A frequency warping approach to speaker normalization," Speech
and audio processing, ieee transactions on,
vol. 6, pp. 49-60, 1998.
[37] D. R. Sanand and S. Umesh, "VTLN Using Analytically Determined Linear-Transformation on Conventional MFCC,"
Audio, Speech, and Language Processing, IEEE Transactions on, vol. 20, pp.
ISSN:1992-8645 www.jatit.org E-ISSN:1817-3195 [38] R. Sinha and S. Umesh, "A shift-based
approach to speaker normalization using non-linear frequency-scaling model," Speech Communication, vol. 50, pp. 191-202, 2008.
[39] D. Yu, L. Deng, J. Droppo, J. Wu, Y. Gong, and A. Acero, "A minimum-mean-square-error noise reduction algorithm on mel-frequency cepstra for robust speech recognition," in Acoustics, Speech and Signal
Processing, 2008. ICASSP 2008. IEEE International Conference on, 2008, pp.
4041-4044.
[40] D. Yu, L. Deng, J. Droppo, J. Wu, Y. Gong, and A. Acero, "Robust speech recognition using a cepstral minimum-mean-square-error-motivated noise suppressor," Audio, Speech,
and Language Processing, IEEE Transactions on, vol. 16, pp. 1061-1070, 2008.
[41] P. Maragos, J. F. Kaiser, and T. F. Quatieri, "Energy separation in signal modulations with application to speech analysis," Signal Processing, IEEE Transactions on, vol. 41,
pp. 3024-3051, 1993.
[42] D. Dimitriadis, P. Maragos, and A. Potamianos, "Auditory Teager energy cepstrum coefficients for robust speech recognition," in Proc of Interspeech, 2005, pp. 3013-3016.
[43] H. Gao, S. Chen, and G. Su, "Emotion classification of infant voice based on features derived from Teager Energy Operator," in
Image and Signal Processing, 2008. CISP'08. Congress on, 2008, pp. 333-337.
[44] A. Potamianos and P. Maragos, "Time-frequency distributions for automatic speech recognition," Speech and Audio Processing,
IEEE Transactions on, vol. 9, pp. 196-200,
2001.
[45] J. F. Kaiser, "On a simple algorithm to calculate theenergy'of a signal," in Acoustics,
Speech, and Signal Processing, 1990. ICASSP-90., 1990 International Conference on, 1990, pp. 381-384.
[46] T. L. Nwe, S. W. Foo, and L. C. De Silva, "Classification of stress in speech using linear and nonlinear features," in Acoustics, Speech,
and Signal Processing, 2003. Proceedings.(ICASSP'03). 2003 IEEE International Conference on, 2003, pp.
II-9-12 vol. 2.
[47] N. Nehe and R. Holambe, "Mel Frequency Teager Energy Features for Isolate Word Recognition in Noisy Environment," in
Emerging Trends in Engineering and Technology (ICETET), 2009 2nd
International Conference on, 2009, pp.
904-908.
[48] U. H. Yapanel and S. Dharanipragada, "Perceptual MVDR-based cepstral coefficients (PMCCs) for robust speech recognition," in Acoustics, Speech, and Signal
Processing, 2003. Proceedings.(ICASSP'03). 2003 IEEE International Conference on,
2003, pp. I-644-I-647 vol. 1.
[49] U. H. Yapanel and J. H. Hansen, "A new perspective on feature extraction for robust in-vehicle speech recognition," in Proceedings of
Eurospeech, 2003.
[50] L. Gu and K. Rose, "Split-band perceptual harmonic cepstral coefficients as acoustic features for speech recognition," ISCA Interspeech-01/EUROSPEECH-01, Aalbrg, Denmark, pp. 583-586, 2001.
[51] U. H. Yapanel and J. H. Hansen, "A new perceptually motivated MVDR-based acoustic front-end (PMVDR) for robust automatic speech recognition," Speech Communication, vol. 50, pp. 142-152, 2008.
[52] B. Gold, N. Morgan, and D. Ellis, Speech and
audio signal processing: processing and perception of speech and music: Wiley. com,
2011.
[53] M. N. Kvale and C. E. Schreiner, "Short-term adaptation of auditory receptive fields to dynamic stimuli," Journal of neurophysiology, vol. 91, pp. 604-612, 2004.
[54] A. J. Oxenham, "Forward masking: Adaptation or integration?," The Journal of
the Acoustical Society of America, vol. 109, p.
732, 2001.
[55] P. Dai and I. Y. Soon, "A temporal warped 2D psychoacoustic modeling for robust speech recognition system," Speech Communication, vol. 53, pp. 229-241, 2011.
[56] X. Luo, Y. Soon, and C. K. Yeo, "An auditory model for robust speech recognition," in
Audio, Language and Image Processing, 2008. ICALIP 2008. International Conference on, 2008, pp. 1105-1109.
[57] P. Dai, Y. Soon, and C. K. Yeo, "2D psychoacoustic filtering for robust speech recognition," in Information, Communications
and Signal Processing, 2009. ICICS 2009. 7th International Conference on, 2009, pp. 1-5.
[58] S. A. Shamma, "Speech processing in the auditory system II: Lateral inhibition and the central processing of speech evoked activity in the auditory nerve," The Journal of the
Acoustical Society of America, vol. 78, p.
ISSN:1992-8645 www.jatit.org E-ISSN:1817-3195 [59] B. Strope and A. Alwan, "A model of
dynamic auditory perception and its application to robust word recognition,"
Speech and Audio Processing, IEEE Transactions on, vol. 5, pp. 451-464, 1997.
[60] K.-Y. Park and S.-Y. Lee, "An engineering model of the masking for the noise-robust speech recognition," Neurocomputing, vol. 52, pp. 615-620, 2003.
[61] P. T. Nghia and P. V. Binh, "A new wavelet-based wide-band speech coder," in Advanced
Technologies for Communications, 2008. ATC 2008. International Conference on, 2008, pp.
349-352.
[62] P. Dai and I. Y. Soon, "A temporal frequency warped (TFW) 2D psychoacoustic filter for robust speech recognition system," Speech
Communication, vol. 54, pp. 402-413, 2012.
[63] N. Nguyen and S. Hawkins, "Temporal integration in the perception of speech: introduction," Journal of Phonetics, vol. 31, pp. 279-287, 2003.
[64] Z. Tufekci and J. Gowdy, "Feature extraction using discrete wavelet transform for speech recognition," in Southeastcon 2000. Proceedings of the IEEE, 2000, pp. 116-123.
[65] J. Hai and E. M. Joo, "Using sub-band wavelet packets strategy for feature extraction," in Proceedings of the 2nd WSEAS
International Conference on Electronics, Control and Signal Processing, 2003, p. 80.
[66] X.-y. Zhang, J. Bai, and W.-z. Liang, "The speech recognition system based on bark wavelet MFCC," in Signal Processing, 2006
8th International Conference on, 2006.
[67] Z. Jie, L. Guo-liang, Z. Yu-zheng, and L. Xiao-ying, "A novel noise-robust speech recognition system based on adaptively enhanced bark wavelet mfcc," in Fuzzy
Systems and Knowledge Discovery, 2009. FSKD'09. Sixth International Conference on,
2009, pp. 443-447.
[68] B. Nasersharif and A. Akbari, "SNR-dependent compression of enhanced Mel sub-band energies for compensation of noise effects on MFCC features," Pattern recognition letters, vol. 28, pp. 1320-1326,
2007.
[69] Z. Wu and Z. Cao, "Improved MFCC-based feature for robust speaker identification,"
Tsinghua Science & Technology, vol. 10, pp.
158-161, 2005.
[70] S. Ikbal, H. Misra, and H. Bourlard, "Phase autocorrelation (PAC) derived robust speech features," in Acoustics, Speech, and Signal
Processing, 2003. Proceedings.(ICASSP'03). 2003 IEEE International Conference on,
2003, pp. II-133-6 vol. 2.
[71] S. Dharanipragada and B. D. Rao, "MVDR based feature extraction for robust speech recognition," in Acoustics, Speech, and Signal
ISSN:1992-8645 www.jatit.org E-ISSN:1817-3195 Table 2. Summary Of Enhanced Mfcc Algorithm Techniques
Technique Name Environments Nature of the Data
Data
Set Accuracy %
No. of Featur es
Year [Ref]
Mel Frequency Modified Group Delay cepstral coefficients (MFMGDCC) Additive background noise Connected digits Aurora 2
81.06@∞ db 54.98 @ ave.
39 2003 [16] 2004 [18] Mel Frequency product spectrum
cepstral coefficients (MFPSCC)
99.31@∞ db 72.48@ ave.
Autocorrelation MFCC (AMFCC)
Additive background noise Connected digits Aurora 2
99.08@∞ db 81.2 @10db 39 2004 [21] 2006 [20] 2007 [23] 991 words vocabulary Resourc e Manage ment (RM)
93.44@∞ db 51.29@10db Phase AutoCorrelation (PAC-MFCC) Additive background noise connected telephone Numbers OGI Number s 95
87.8@∞ db 84@10db
39 2003 [70] 2012 [22] Connected digits Aurora 2 97.55∞ db 76.30@10db
MVDR based MFCC Car noise 178 words Custom Data
88.2@ 60
mph 39 2001 [71]
Regularized MVDR (RMVDR)
Additive background noise large vocabulary continuous speech Aurora
4 65.79 @ avg 39 2013 [26]
Mel filter bank shape modification Via PCA Additive background noise Mandarin Digit String NUM-100A 96.43∞ db 46.23@10db
39 2001 [28] 2004 [29] Via PCA in
linear spectral domain
97.47∞ db 54.37@10db
Via PCA in Log spectral domain
97.41∞ db 55.29@10db
Optimize the No. and spacing of Mel filter bank
GA Additive background noise Hindi Vowels Custom Data 92.87@∞ db 73.32@ 12db Variou s No. of filters 2012 [31]
PSO 93.01∞ db
78.06@ 12db
VTLN- MFCC
noise-free Isolated word
TIDIGI
TS 97.5 39
2012 [37] Additive background noise large vocabulary continuous speech Aurora
4 78.8 45
MFCC-MMSE realistic automobile environments Noisy Isolated Digit Aurora 3 87.87@avg
39 2008 [40] 2008 [39]
Improved MFCC-MMSE 88.64@avg
Improved MFCC-MMSE+CMVN 89.77@avg
Mel Frequency Teager cepstral Coefficients (MFTECC) Additive background noise Isolated word TI-20
98.04 @∞ db
43.09 @ 10db 39 2009 [47]
Perceptual Minimum Variance Distortionless Response (PMVDR)
Real car
environments noisy words
Cu-Move 92.26@ avg
39
2003 [48] 2003 [49] 2008 [51] Actual Stress noisy speech SUSAS 85.07 @ avg
noise-free large vocabulary continuous speech WSJ Wall street Journal
![Figure 1: The standard procedures of MFCC featureextraction [6]](https://thumb-us.123doks.com/thumbv2/123dok_us/8910129.958853/2.612.317.525.76.167/figure-standard-procedures-mfcc-featureextraction.webp)
![Figure 2: The Mel-scale filter bank [6]](https://thumb-us.123doks.com/thumbv2/123dok_us/8910129.958853/3.612.98.288.348.461/figure-the-mel-scale-filter-bank.webp)
![Figure 5: Warp VTLN Method [36]](https://thumb-us.123doks.com/thumbv2/123dok_us/8910129.958853/8.612.92.297.454.562/figure-warp-vtln-method.webp)
![Figure 9: Temporal Masking [55]](https://thumb-us.123doks.com/thumbv2/123dok_us/8910129.958853/10.612.318.511.344.452/figure-temporal-masking.webp)

![Figure 12: Block diagram of the compensated MFCC[68]](https://thumb-us.123doks.com/thumbv2/123dok_us/8910129.958853/13.612.99.291.124.315/figure-block-diagram-of-the-compensated-mfcc.webp)