CONTENT-BASED IMAGE RETRIEVAL FOR ASSET
MANAGEMENT BASED ON WEIGHTED FEATURE AND
K-MEANS CLUSTERING
JUMI¹, AGUS HARJOKO2, AHMAD ASHARI3 1,2,3
Department of Computer Science and Electronics, Faculty of Mathematics and Natural Sciences, Gadjah Mada University, Yogyakarta, Indonesia
E-mail: [email protected], [email protected], [email protected]
ABSTRACT
Assets have different shapes, colors and textures. A shape feature is the main characteristic, which distinguishes each type of asset in addition to the other features, i.e. the color and the texture. The value of features in the image-based asset information retrieval is used as the key field by comparing the similarities between the images. These similarities can be determined based on the differences in the feature values of query images and the images in the database. The closer to zero the difference, the higher the degree of similarities. The degree of similarities will affect the accuracy level of the image retrieval. In this research, image retrieval accuracy and computing time measurement were analyzed. The retrieval accuracy could improve using the property-weighting scheme of weighted features. Moment invariants, color moments and statistical texture are selected to representation shape, color and texture feature. Preprocessing before extraction was done through grayscale, resizing, edge enhancement, histogram equalization. Image asset data clustering was done using K-Means clustering. The research findings suggest that the retrieval accuracy with a total of 400 asset-image data is more than 95% for weighting scheme of Ws (weighted shape) = 50%, Wc (weighted color) = 30%, Wt (weighted texture) = 20% and 10 clusters with the average computing time of 5 millisecond.
Keywords: Weighted, Feature, Retrieval, Moment, K-Means
1. INTRODUCTION
The development of information technology enables information retrieval using image features as a key field. The accuracy level of the retrieval is influenced by a variety of variables, including the precision and accuracy in the calculation of the features values. Other variables that affect the accuracy is the weighting scheme of those features values.
Basically, the image of an object has different feature domination, which requires different feature weighting schemes depending on its object. For example, the image of an asset object has a more dominant shape feature to distinguish the similarities between image assets. While the color and texture features of the image assets serve as supporting features for image similarity measurement [1].
Image similarity measurement can be classified into three main groups, namely similarities in terms of the shape, color, and texture [2]. Similarities are used to sort image-based data retrieval. The closer to zero the difference, the higher the degree of similarities [2]. Data clustering based on weighted feature values is a process to improve accuracy and accelerate information retrieval.
In this research, the stages of the feature weighting scheme were carried out with different percentages and clustering. These stages to improve accuracy and accelerate information retrieval. The information retrieval is done by comparing the features’ values of query images and the images in the database [3].
Previous research on image similarity retrieval based on the extraction of features, i.e. shapes, colors and textures, was done by ignoring the values of those features and clustering with the similarity accuracy results by more than 85% [4]. The main thing the present research will do is analyzing image-based information retrieval using the weighting scheme for feature values and calculating the computing time the retrieval takes after clustering using the K-Means technique.
2. RELATED WORKS
similarity. Weighting with a size of 0.1 or 0.2 on
the color and texture features generates the highest retrieval accuracy value.
Image retrieval using the weighting method by reviewing that features are relevant and irrelevant using SVM has also been carried out [5]. This research generates relevant features based on the
classification level and assigned a higher value for relevant features and then discarded the irrelevant ones. The weighted features were used to compute the kernel function and SVM training. After that, the SVM training was used to automatically classify new images.
The use of variables value based the variant of the cluster distance has been done in feature weighting-based research [6]. A new value is used to determine the cluster membership of an object in the subsequent iteration and is used to identify important variables in the clustering.
Re-weighting the features of the shape, color and texture has also been done on a large database size [7]. The findings of the research indicate that the re-weighting of these three features proves to produce a higher level of accuracy for retrieval on large-scale image databases with high-dimensional image features. The retrieval process of the desired images from a collection of images on a web page based on the features is called Content Based Image Retrieval (CBIR). In this research, CBIR-based retrieval used a combination of two features and weighted similarity which can be determined according to the user’s choice to improve the efficiency of the retrieval results.
Retrieval by weighting the texture feature using DCT (Discrete Cosine Transform) has also been carried out in CBIR-based image retrieval [8]. The features’ values will be used as the coefficient of the image’s value to be used as the basis for the retrieval.
Image indexing based on the concurrence matrix weighted color feature value generates a relatively high retrieval accuracy value [9]. In this research, the value of the color feature was weighted and indexed based on the similarities in terms of the diagonal and non-diagonal elements.
Furthermore, retrieval using the histogram-based color feature has also been done to improve the retrieval accuracy [10]. In this research, feature weighting was carried out dynamically. Retrieval using the histogram-based color feature has also been carried out. In this research, sample pixel image weighting was performed [11]. The number of pixels and the size of the image when shooting will greatly affect the retrieval accuracy, so that the sample pixel values were weighted.
An image database has a number and variety of image types. Therefore, in order to accelerate and make accurate the information retrieval, clustering or data classification is necessary. K-Means is a clustering technique with proven accuracy in data clustering. A number of studies using the K-Means
clustering include data clustering based on the formula of the variables values [12].
The use of K-Means clustering is also performed by combining the entropy value. In the present study, the clustering was done by calculating the entropy value [13].
3. RESEARCH METHOD
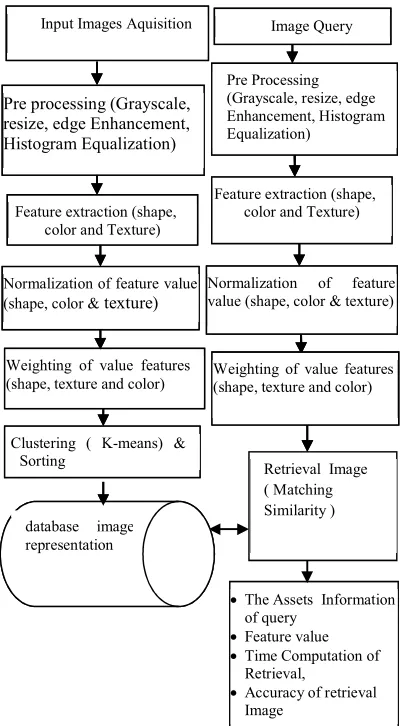
[image:2.595.305.506.373.736.2]In some of the above previous studies, none of them combined the methods of feature weighting and clustering based on features of the shape, color and texture in the process of CBIR-based image retrieval. This research followed the image retrieval with the following research stages shown in Figure 1.
Figure 1: Proposed System
Normalization of feature
value (shape, color & texture) Image Query
Pre Processing (Grayscale, resize, edge Enhancement, Histogram Equalization)
Feature extraction (shape, color and Texture)
Weighting of value
features (shape, texture and color)
Input Images Aquisition
database image representation
Clustering ( K-means) & Sorting
Pre processing (Grayscale, resize, edge Enhancement, Histogram Equalization)
Feature extraction (shape, color and Texture)
Weighting of value features (shape, texture and color) Normalization of feature value (shape, color & texture)
Retrieval Image ( Matching Similarity )
•The Assets Information
of query
•Feature value
•Time Computation of
Retrieval,
•Accuracy of retrieval
Image
Normalization of feature
value (shape, color & texture) Image Query
Pre Processing (Grayscale, resize, edge Enhancement, Histogram Equalization)
Feature extraction (shape, color and Texture)
Weighting of value features (shape, texture and color) Input Images Aquisition
database image representation
Clustering ( K-means) & Sorting
Pre processing (Grayscale, resize, edge Enhancement, Histogram Equalization)
Feature extraction (shape, color and Texture)
Details of these research stages are described as follows:
3.1 Preprocessing
Preprocessing is a stage of image quality improvement prior to feature extraction, which aims to improve the accuracy of the image feature extraction results. There are differences in the preprocessing of the shape feature extraction and that of the color and texture feature extraction. The difference aims to get the quality image before feature extraction.
3.1.1 Preprocessing of the Shape Feature
a. Resizing
The image size will affect the length of time of the feature extraction. The smaller the size, the faster the computation of the feature extraction. At this stage, images were resized to 200 x 200 pixels.
b. Grayscale
Especially in the calculation of the shape feature, the color feature is not calculated, so that the image was changed into grayscale to make the computation process faster.
c. Edge Enhancement and Histogram Equalization (HE)
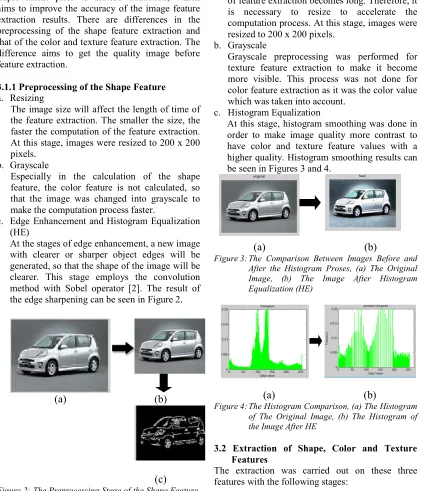
At the stages of edge enhancement, a new image with clearer or sharper object edges will be generated, so that the shape of the image will be clearer. This stage employs the convolution method with Sobel operator [2]. The result of the edge sharpening can be seen in Figure 2.
(a)
(b)
(c)
Figure 2: The Preprocessing Stage of the Shape Feature, (a) A Grayscale Image, (b) A Resized Image, (c) An Image After Edge Enhancement
3.1.2 Preprocessing of the Color and Texture Features
a. Resizing
The large size of the image makes the process of feature extraction becomes long. Therefore, it is necessary to resize to accelerate the computation process. At this stage, images were resized to 200 x 200 pixels.
b. Grayscale
Grayscale preprocessing was performed for texture feature extraction to make it become more visible. This process was not done for color feature extraction as it was the color value which was taken into account.
c. Histogram Equalization
At this stage, histogram smoothing was done in order to make image quality more contrast to have color and texture feature values with a higher quality. Histogram smoothing results can be seen in Figures 3 and 4.
[image:3.595.91.515.188.679.2](a)
(b)
Figure 3: The Comparison Between Images Before and After the Histogram Proses, (a) The Original Image, (b) The Image After Histogram Equalization (HE)
(a)
(b)
Figure 4: The Histogram Comparison, (a) The Histogram of The Original Image, (b) The Histogram of the Image After HE
3.2 Extraction of Shape, Color and Texture Features
The extraction was carried out on these three features with the following stages:
3.2.1 Extraction of the Shape Feature
Moment invariant will produce seven constant
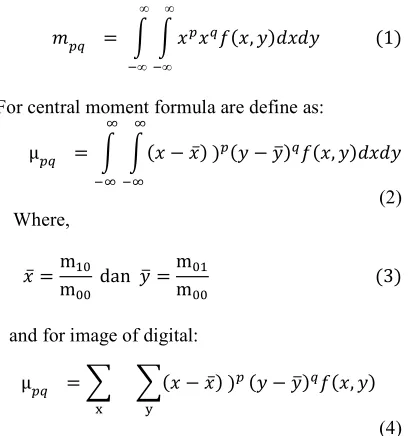
moment invariant values towards the RST [3]. The moment invariant also allows the analysis on the shape of a moment set of a function f (x, y) of two variables defined as follows [2]:
Moment order (p + q) for a continuous function f (x, y) with p, q = 0, 1, 2, ... are defined as follows:
, ∞
∞ ∞
∞
1
For central moment formula are define as:
μ ̅ ,
(2) Where,
̅ mm dan mm 3
and for image of digital:
μ ̅ ,
(4)
As for the region, it is described using seven moment invariants that can be found from the central moment: μ00, μ10, μ01, μ20, μ11, μ02, μ30, μ12, μ21, μ03, and by defining the normalized central moments, i.e. ηpq = μpq/ μγ00, where γ = 0.5 (p + q) + 1 for p + q = 2, 3, and so on, which finally will result in seven moment invariants, these seven moment invariants are shown in equations 5 to 11.
M1 η20+ η02 (5)
M2 η20+ η02 2 + 4η211 (6) M3 η30 - η12 2 + 3η21 - η03 2 (7) M4 η30 + η12 2 + η21 + η03 2 (8) M5 η30 - 3η12 η30+ η12 [ η30 + η12 2 -
3 η21 + η03 2] + 3η21 - η03 η21 + η03[3 η30 + η12 2 - η21 - η03 2]
(9) M6 η20 - η02 [ η30 + η12 2 - η21 + η03 2]
+ 4η11 η30 + η12 η21 + η03
(10) M7 3η21 - η30 η30 + η12 [ η30 + η12 2 -
3 η21 + η03 2] + 3η12 - η30 η21 - η03[3 η30 + η12 2 - η21 + η03 2]
(11)
The values of those seven moment invariants do not change against rotation, translation and scale [14].
3.2.2 Extraction of the Color Feature
Preprocessing with histogram equalization in Figure 3 resulted in a more contrast image. The image was used as an input image of the color feature extraction. The extraction method employed was color moment. This method is able to distinguish images based on their color feature [15]. Color moment is a quite good method to recognize the color feature. It uses three main moments of an image’s color distribution, namely the mean, standard deviation, and skewness [14]. Each color component, i.e. HSV (Hue, Saturation and Value) has 3 moments. Calculation of these three moments was carried out using equations 12, 13 and 14.
a. Moment 1 – Mean :
+, -.1
/0
10
P34
12
Mean : as average of image feature value.
b. Moment 2 – Variants :
53 61. 78/
/0
1
+3 9 (13)
Standard deviation: Range of distributed of mean c. Moment 3 – Skewness :
Skewness is a measure of the asymmetry of the data around the mean, calculated by equation 14. Skewness is a measure of the asymmetry degree of color distribution.
:8 6N 1 P34
40
<
E3 >
? (14)
Distance of color distribution from image query with image database can be calculated with equation 15
.
@ABCBD E, F G8
D
80
|+8 +89|
+ G89 |58
589I+G8> I:8 :89|
Where,
[image:4.595.90.296.227.445.2]E = The average value of the color image
(Mean).
(H,I) = Two of images being compared i = is the component color of HSV Index
(H=1, S=2, V=3)
r = is the number of index ( 3 ) 5 = is the Square root of the variance
(Standard Deviation).
S = Is the size from the degree of asymmetry in the distribution (Skewness).
N = The number of total pixels in the image.
J = Pixel of index.
Wi = Weight of each moment.
Pij = The value from i-th of the component color on j-th of the pixel
3.2.3 Extraction of the Texture Feature
Texture refers to the regularity of certain patterns shapeed from the arrangement of an image’s pixels. The texture value can be used as one of the variables to measure image similarity.
Statistical Texture is one method to describe texture using a statistical approach to the histogram intensity of an image or a region. It can provide imagery measurements such as smoothness, coarseness and regularity, all of which are the variables of the texture feature.
Texture feature values in this research were measured using five features, namely: smoothness, standard deviation, skewness, uniformity and entropy.
a. Smoothness
If a random variable Z that describes intensity, with P(Zi) as its histogram where i = 0,1,2,..., L-1 and L is the number of the intensity level and m is the mean of Z (intensity mean), then the moment number-n of Z against the mean is described in equation 16
.
μ
KZ
M
3 KN
30
P M
3 (16)With m is the average value of Z ( intensity average), as shown in equation 17.
M3 N
30
p M3 (17)
Based on the equation 16, then the values of μ0 = 1 and μ1 = 0 are the values of the moment number 0 and 1. The second moment or μ2 is called
the variance σ2 (Z), which is an important part of the texture description. The moment is the measurement of the intensity contrast which provides a description related to the relative smoothness. The variance value is calculated using equation 18.
σ9 M
8 Q
80
9P Z 3
(18)
b. Standard Deviation
Standard deviation denoted by σ (z) is also often used as a measure of texture.
54
6R
1LT
Pij 4W
L
i 0
2
X
19The measurement of the standard deviation used equation 19.
c. Skewness
Skewness of a histogram was calculated using equation (20)
.
Z> M M3 N
30
3p M3 (20)
d. Uniformity
Another texture measurement that can be used to describe an image based on its histogram is the measurement of gray level uniformity, which in this research was calculated using the following formula:
∪ \ 79
Q
80
M3 (21)
e. Entropy
As for the measurement of the average entropy, it is carried out using equation 22.
] 7 M3 log97 M3 Q
80
(22)
Entropy is a measure of an image’s irregularity structure.
f. Texture Similarity Values
Dbcdefgh H, I W3
h
30
|m3 m39| + W39 |σ3
σ39I+W3> Iμ3 μ39|I+W3l IU3
U39|I+W3n Ie3 eμ39|
(23)
3.3 Feature Normalization
Normalization is necessary to make the range or interval of different features’ values in the same scale with a smaller range. It aims to give equal weight to the values of different features of the extraction results. Normalization in this research used equation 24
.
@p , @ , min @
max @ min @
(24)
Where Dꞌ is feature value number i after normalization, D is feature value of number i before normalization, min (D) is minimum value of each feature and max (D) is the maximum value of each feature.
3.4 Feature Weighting
Weighting of different features in this research was varied to analyze retrieval accuracy. Four weighting schemes. The first scheme is W1 (0.4, 0.3, 0.3) which is a weighting scheme for 40% shape feature weighting, 30% color feature weighting, and 30% color texture weighting. The second scheme is W2 (0.5, 0.3, 0.2) which is a weighting scheme for 50% shape feature weighting, 30% color feature weighting, and 20% color texture weighting. The third scheme is W3 (0.2, 0.3, 0.5) which is a weighting scheme for 20% shape feature weighting, 30% color feature weighting, and 50% color texture weighting and the fourth scheme is W4 (0.3, 0.5, 0.2) which is a weighting scheme for 30% shape feature weighting, 50% color feature weighting, and 20% color texture weighting.
3.5 K-Means Clustering
The use of clustering in this research aims to accelerate the retrieval process. K-Means is a clustering technique using a centroid (the center point of the cluster) to represent a cluster [16]. In addition, K-Means can quickly classify large data [17].
K-Means clustering begins by determining the number of clusters differently. The next stage is putting all the data into clusters based on the shortest distance between an object to the centroid. Variations in the number of clusters will affect the
number of images in each cluster. Indexing is done on each cluster to accelerate the retrieval process.
K-Means algorithm is used to determine the position of a cluster of each image by firstly calculating the image distance with all the centroids using the euclidean distance method. Cluster mapping is done by selecting the closest distance to all the existing centroids. The distance is calculated using equation 25.
@ E, F 6 rsK tuK 9 v
K0
(25)
Where D (H, I) is the distance of image H to centroid I, XHn is the value of the feature number n
of image H, CIn the value of the feature number n of
centroid I and n refers to the total number of dimensions
K-Means clustering begins by determining the number of clusters differently. The testing is done by using variations in the number of center clusters ranging from 3 to 15 of the cluster point center. Variations in the number of clusters will affect the number of images in each cluster.
3.6 Similarity Measurement
Similarity measurement of query images and images in the database used the concept of Euclidean distance and was performed on one cluster only. Similarity measurement was calculated using equation (26) by using eleven dimensions or features, i.e. three shape features including moment invariant values number 3, 5 and 7; 3 color features using Hue values and 5 texture features, namely smoothness, standard deviation, skewness, uniformity and entropy.
@ w, x 6 wK xK 9
v
K0
(26)
Where Q
and M
refers to the features of query images and images in the database in the dimension number n.Results of the similarity calculation were sorted in such a way that the similarity whose value is the closest to zero has the highest level of similarity.
3.7 Retrieval Accuracy
AK AR AS x 100% 27
Where,
AR (Actual Relevant) : Number of relevan image retrieved by user.
AS (Actual Search) : Total number of retrieved by system .
4. RESULT AND ANALYSIS
In this research, testing was carried out using five types of image assets with a total of 400 images of 200 x 200 pixels. Retrieval testing was done using variations in the number of clusters and the percentage of feature values. The testing resulted in 50% weighting variation for the shape feature value, 30% weighting variation for the color feature value and 20% weighting variation for the texture feature value, with a variation of 10 clusters as shown in Figure 5.
Figure 5: Retrieval Using Shape, Color, and Texture Values Using Weighting Scheme W2(0.5, 0.3 and 0.2)
Figure 5 presents the retrieval results with a similarity rank ranging from 1 to 10 from the image asset database. Testing using weighting variations and variations in the number of clusters will generate different retrieval outputs for the same data.
At this stage, retrieval accuracy of the image asset database was calculated. Furthermore, retrieval accuracy of the image asset database before and after clustering, which varied ranging from 3 to 15 clusters, was analyzed.
4.1 Retrieval With Clustering
The analysis of retrieval accuracy at this stage used an image asset database before clustering which varied in terms of the weighting of shape, color and texture features. The values of retrieval
accuracy using the same feature values and different feature values can be seen in Table 1.
Table 1: The Percentage of Retrieval Accuracy Using the Same Feature Values and Different Feature Values for the Image Asset Database
Image Equal
Weighted
W1 W2 W3 W4
I1 75,55% 78,59% 86,75% 84,38% 61,33%
I2 74,67% 79% 87% 83,87% 60,67%
I3 75,05% 79,45% 87,10% 83,33% 60%
I4 74,69% 79,15% 87,50% 86,67% 59,33%
I5 75,65% 78,75% 86,67% 84,38% 60,67%
I6 75% 78,50% 86,36% 84% 60%
I7 75,76% 79,45% 86,67% 83,87% 59,33%
I8 74,89% 78,65% 87,33% 83,33% 60,67%
I9 74,87% 79,55% 86% 84% 61,33%
I10 75,35% 79,25% 87,33% 84,38% 60,67%
Table 1 shows that the retrieval accuracy with the variation of W2 generates the highest average accuracy and the variation of W4 produces the lowest accuracy.
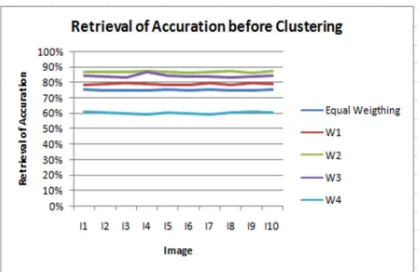
[image:7.595.89.297.383.519.2]The retrieval accuracy graph using the same feature values and different feature values for the image database before clustering can be seen in Figure 6.
Figure 6: The Graph of Retrieval Accuracy Using the Same Feature Values and Different Feature Values Before Clustering for the Image Asset Database
Based on Figure 6, it is indicated that the variation in the W2 weighting generates the highest retrieval accuracy compared to other weighting variation.
4.2Retrieval Without Clustering
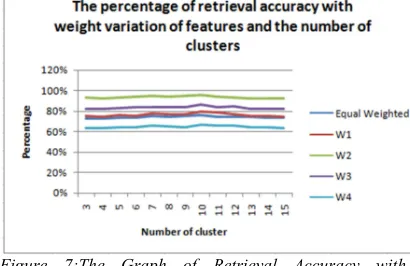
[image:7.595.308.518.414.550.2]Table 2: The Percentage of Retrieval Accuracy with Variations in Feature Weighting and the Number of Clusters
Number of cluster
Equal Weight
W1 W2 W3 W4
3 72,55% 75,59% 92,67% 82,38% 63,33%
4 72,67% 75% 92,33% 82,33% 63,67%
5 73,05% 76,45% 93,33% 83,36% 64,00%
6 73,69% 76,15% 93,67% 83,67% 64,33%
7 74,65% 77,75% 94,33% 84,38% 65,67%
8 74% 77,50% 94% 84% 65,00%
9 74,76% 77,45% 94,67% 83,87% 64,33%
10 75,89% 79,65% 95,67% 86,67% 66,93%
11 74,47% 79,15% 93,55% 84% 66,23%
12 74,15% 77,25% 93% 85,33% 65,67%
13 74,20% 76,15% 92,23% 82,63% 64,63%
14 73,25% 75,59% 92,13% 82,44% 64,55%
15 73,13% 75,29% 92,09% 82,23% 63,43%
Based on Table 2, it is shown that the W2 weighting variation with 50% shape feature weighting, 30% color feature weighting and 20% texture feature weighting and a variation in the number of clusters (10 clusters) produces the highest retrieval accuracy by over 95%.
As for the W4 weighting variation with 30% shape feature weighting, 50% color feature weighting and 20% texture feature weighting and a variation in the number of clusters (3 clusters), it generates the lowest retrieval accuracy by less than 64% The retrieval accuracy graph of the image asset database using the same and different feature weighting, namely W1, W2, W3 and W4 with variations in the number of clusters ranging from 3 to 15 clusters can be seen in Figure 7.
Figure 7:The Graph of Retrieval Accuracy with Variations in Feature Weighting and the Number of Clusters
Figure 7 shows that the retrieval accuracy tends to increase as the variation in the number of clusters reaches up to 10 clusters and tends to decrease if the variation in the number of clusters reaches more 10 clusters.
4.2.3 Computing Time
Computing time required for retrieving an image of the image asset database depends on the size of the image database and the database management technique. The average computing time required to retrieve an image database before clustering with variations of the number of clusters can be seen in a graph presented in Figure 8.
Figure 8: Shows that Comparison of Computing Time With Number Cluster of Variation.
5. CONCLUSIONS
The level of accuracy during the image asset retrieval process is determined by a number of variables. Those variables include image acquisition, feature extraction methods and techniques used for database retrieval.
In this research, it is found that the use of different feature weighting schemes for each normalized feature value and variations in the number of clusters will affect increases in the levels of accuracy and speed of image asset database retrieval. The highest retrieval accuracy level is obtained with a variation in the number of clusters as many as 10 clusters with the W2 weighting variation, i.e. 50% shape feature weighting, 30% color feature weighting and 20% texture feature weighting.
The research findings suggest that the shape feature of image assets is the dominant factor for determining the degree of similarity in the retrieval process, while the color and texture features are supplementary features. The average computing time required for retrieval is 5 milli-second.
REFERENCES:
[image:8.595.307.517.220.339.2] [image:8.595.88.293.507.640.2][2]. Gonzales, R. C., Woods, R. E., 2008, Digital
Image Processing, Third Edition, Pearson Prentice Hall, New Jersey.
[3]. Castleman, K. R., 1996, Digital Image Processing, Prentice Hall Inc., New Jersey. [4]. Jumi and Harjoko, A., 2012, Image Similarity
Analysis Based on Shape, Color and Texture Feature of Asset Image, International Conference on Computer Science Electronics and Instrumentation, Yogyakarta, Indonesia, ISBN 978-602-97479-2-8, pp. 7-12.
[5]. Keping, W. X.W. and Zhong, Y.,2010, A
Weighted Feature Support Vector Machines Method for Semantic Image Classification,
International Conference on Measuring Technology and Mechatronics Automation, China.
[6]. Joshua Z. H., Michael K. N., Hongqiang R., and Zichen L., 2005, Automated Variable Weighting in K-Means Type Clustering, IEEE
VOL. 27, NO. 5.
[7]. Yimin W. and Aidong Z., 2002, Feature Re-Weighting Approach For Relevance Feedback in Image Retrieval, IEEE.
[8]. Xiang Y. H, Yu-Jin B., and Dong H., 2003, Image Retrieval Based on WeigthedTexture Features using DCT Coefficients of JPEG Images, International Conference Information and Computer Security (ICICS), Singapore. [9]. Dong L. And Edmund Y. L., 2006, Image
Indexing Using Weighted Color cooccurrence Matrix and Feature Selection, Tencon Region 10 Conference, IEEE,1-4244-0549-1, pp. 1-4. [10]. He G., Xueshi B., Zheweu S. and Xiaofei L.,
2010, An Image Retrieval Algorithm Based on Dynamic Weights and Features Combination, Conference on Environmental Science and Information Application Technology, China.
[11]. Atmaja, A.S. and Hananto, M.W., 2010, Implementation of Weighted Sample Pixel Method for Image Retrieval Application, International Conference on Distributed Frameworks for Multimedia Applications, Jogjakarta, Indonesia
[12]. Joshua Z. H., Michael K. N., Hongqiang R., and Zichen L., 2005, Automated Variable Weighting in k-Means Type Clustering, IEEE.
[13]. Taoying, L. And Yan, C., 2008, A Weight Entropy K-Means Algorithm for Clustering Dataset with Mixed Numeric and Categorical Data, Fifth International Conference on Fuzzy Systems and Knowledge Discovery, 978-0-695-3305, IEEE, pp. 36-41.
[14]. Acharya T, Ray, A. K, 2005, Image Processing Principle and Applications, John Willey & Sons, USA
[15]. Susilo, A., 2006, Web Image Retrieval for indentification of flower based on color feature, Proceeding IES, Surabaya.
[16]. Fahim A. M., Salem A. M., Torkey F. A. and Ramadan M. A., 2006, An efficient enhanced k-means clustering algorithm, Journal of Zhejiang University Science , pp. 1626–1633. [17]. Arai, K. and Barakbah, A.R. ,2007,