698
A COMPARATIVE STUDY OF MULTI ATTRIBUTE
RANKING MECHANISMS FOR P2P NETWORKS
SWAMINATHAN B
1AND SHEILA ANAND
21
Associae Professor, Department of Computer Science and Engineering, 2
Dean (Research) Computer Studies, Department of Information Technology, 1, 2
Rajalakshmi Engineering College, Chennai, India; E-mail: [email protected], [email protected]
ABSTRACT
P2P systems are distributed, decentralized networks that enhance resource sharing. The decentralized, open and anonymous nature of P2P systems can raise serious concerns for a peer. There is no control or accountability on the content or resources that a peer can share on the network. Hence, the process of selecting the right peer for collaboration and its decision making process becomes difficult. This paper discusses the implementation of three methods of Multi Criteria Decision Making (MCDM) models Analytic Hierarchy Process (AHP), Preference Ranking Organization Method for Enrichment Evaluations (PROMETHEE) and ELimination and Choice Translating REality (ELECTRE). A detailed comparative study of the three models was performed and the results are presented. From the results it can be inferred that while the execution time for AHP method is higher than that of the other two methods, it has the optimal selection of the given alternatives according to the requirement. PROMETHEE AND ELECTRE support the selection of best choice among the alternatives.
Keyword - AHP, PROMETHEE, ELECTRE, Collaborate, Decision Making
1. INTRODUCTION
P2P systems are distributed, decentralized networks that enhance resource sharing, functionality sharing, ad-hoc collaboration, improved reliability and scalability. Peers can join and leave the network dynamically and many of the peers in the network may not have interacted with each other earlier. However, the decentralized, open and anonymous nature of P2P systems can raise serious concerns for a peer. There is no control or accountability on the content or resources that a peer can share on the network. Hence, the process of selecting the right peer for collaboration and its decision making process becomes difficult.
This paper discusses the three methods used as multi attribute ranking mechanism for P2P networks. In this paper, the comparative study of the three of the multiple criteria decision making (MCDM) methods are implemented, compared and analyzed. The first method is the Analytic Hierarchy Process (AHP) developed by [9]. The second is the Preference Ranking Organization
Method for Enrichment Evaluations (PROMETHEE) developed by [2] and further extended by [3]. The third method is Elimination and choice translating reality (ELECTRE) developed by [7]. To the best of our knowledge these methods have not been studied for peer selection for collaboration.
The rest of the paper is organized as follows. Section 2 presents an overview of the peer collaboration process. Section 3 briefly describes these three methods. In Section 4, these methods have been implemented for peer collaboration and the comparative results is observed and analyzed. Section 4 concludes the paper.
2. P2P COLLABORATION
699
add the host to their contact managers. Most of the peers will send invitation responses, whether accepted or declined, back to the host peer in a timely fashion. The host peer processes all invitation responses to determine who has accepted, who has declined, and who has not answered. It may cancel invitations to those who have not answered, or perform some other activity.
Collaboration session can now happen between the registered peers. P2P applications can use the collaboration infrastructure to coordinate communications and complete their tasks. The process of ranking of peers is significant for selecting the peers for collaboration for a particular task or application. The collaborative work of P2P systems require heterogeneous resources to be used. Hence, ranking mechanism based on multiple attributes is required to enable the participating peer to select the right peers for collaboration.
3.DISCUSSION OF THE MCDM METHODS
The three methods AHP, PROMETHEE and ELECTRE have been explained in this section and illustrated using a sample peer collaboration example.
3.1 AHP
Many multiple attribute decision making methods are used for ranking in the manufacturing environment. Analytic hierarchy process (AHP) is one of the most popular analytical techniques for ranking. AHP can efficiently deal with objective as well as subjective attributes. AHP has been extensively used in integrated manufacturing by [8], in the evaluation of technology investment decisions in [1], in flexible manufacturing systems [14], layout design in [4], and also in other engineering problems [15]. The application of AHP technique for multi-attribute ranking for P2P collaboration is explained and illustrated with examples. The calculation techniques of AHP begin with the construction of a matrix expressing the relative values of a set of attributes. For example, the relative importance of the resources like number of processors, CPU speed, and Memory size is determined with respect to the cost of resource sharing and ease of operation. The relative importance of the attributes has to be decided based on the P2P application that is being collaborated. Usually, the decision-maker has to choose his answer among 1-9 discrete choices.
Each choice is a linguistic phrase. Some examples of such linguistic phrases are: "A is more important than B", or "A is of the same importance as B", or "A is a little more important than B", as tabulated by the rating scale table in [9].
The importance can be scaled as Equal importance, weak importance of one over another and strong importance. For example, the rating scale of [9] is used for assigning a number for relative importance of the attributes used for illustration, 1 for Equal importance, 3 for weak importance of one over another and 5 for strong importance. A basic assumption is that if attribute A is absolutely more important than attribute B and is rated at 5, then B must be absolutely less important than A and is valued as 1/5.
The initial matrix for the pair wise comparison is given with the principal diagonal containing entries of 1 as each factor is as important as itself. The sample attributes are named as Number of Core Processors (P), CPU Speed (C) and Memory size (M). The initial matrix can now be given as:
Attributes C P M
C 1
P 1
M 1
The criteria can be fixed based on the importance of the attributes relative to the objective used for peer ranking with respect to cost of resource sharing and ease of operation. The matrix obtained is named as Judgement Matrix. The Judgement matrix for sample attributes like Number of Core Processors, CPU Speed and Memory size are fixed based on the observed data and is computed as follows:
700
Number of
Processors 1 2 4 1 1 1/5 3
2 5 1 5
4 1/3 1/5 1
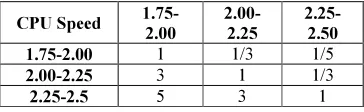
The relative importance for the attribute CPU Speed is computed by determining the discrete values for a range represented as GHz. Here, the range 2.25-2.5 GHz is considered with the relative importance value to be 5, the ranges 2.00- 2.25 GHz and 2.25-2.5 are with the values to be 3. The judgement matrix for the attribute CPU Speed is given as:
CPU Speed 1.75-2.00
2.00-2.25
2.25-2.50 1.75-2.00 1 1/3 1/5
2.00-2.25 3 1 1/3
2.25-2.5 5 3 1
The memory size required is categorized as the ranges 1-3 GB, 3-4 GB and 4-32 GB. The relative importance value is computed to be 5 for 3-4 GB, 1-3 GB and 3-4-32 GB. Hence, the judgement matrix for the attribute Memory size is given as:
Memory
Size 1-3 3-4 4-32 1-3 1 1/5 3
3-4 5 1 5
4-32 1/3 1/5 1
The interdependency among the attributes is determined and is represented using the matrix termed as Overall Preference Matrix. The pair-wise comparisons are carried out for all factors to be considered, and the matrix is completed. There is no standard way to make the pair-wise comparison. Considering a P2P collaborative application, let it be supposed that the attribute Number of Processors among the attributes considered is slightly more important than Memory size. In the matrix it is rated as 5 in the cell P, M and 1/5 in M, P. Also, Memory size is considered to be more important than CPU Speed and is rated as 3 in the cell M, C and 1/3 in the cell C, M. The overall preference matrix obtained as:
Attributes C P M C 1 1/5 1/3
P 5 1 1/3
M 3 3 1
The eigenvector called as the Priority Vector for the attributes is calculated for every attribute. The elements in each row of the matrix are multiplied with each other and then the nth root
[image:3.595.98.280.291.347.2]is taken for computing the priority vector values. Since, the number of attributes is 3, cubic root value is calculated and is summarized Table 1.
Table 1: Priority vector of the attributes
Attributes C P M
0.2 0.1 0.2 0.7 0.26 0.7 0.1 0.64 0.1
The judgement can be verified by calculating a Consistency Ratio (CR) to measure how consistent the judgements have been relative to large samples of random judgements. If the CR is greater than 0.1, the judgements are untrustworthy because they are too close to randomness, pair wise comparisons have to be re-evaluated and must be repeated. The computed CR values are 0.117, 0.03 and 0.117.
Additionally, the priority vector for considering the interdependency among the attributes is calculated to be (0.11, 0.32, and 0.57). The next step is to normalize the relative values by dividing the values with their sums which is termed as Final Priority Vector. The normalized values for the judgement matrix are computed and the final priority vector for the considered sample is (0.349, 0.547 and 0.104). The value 0.547 shows that the attribute Number of Processors is given more importance; 0.349 shows that the attributes CPU speed and the Memory size is given less importance compared to Number of processors.
3.2 PROMETHEE
PROMETHEE is a well established decision support system by [3] which deals with the appraisal and selection of a set of options on the basis of several criteria, with the objective of identifying the pros and the cons of the alternatives and obtaining a ranking among them. Preference function based outranking method is a special type of Multi-Criteria Decision-Making (MCDM) tool that can provide a ranking ordering of the decision options. The steps involved in this method are:
701
calculated for each pair of options and can range from 0 to 1. The value ‘0’ means that there is no difference between the pair of options, value ‘1’ indicates a big difference.
By multiplying the preferences by the criteria’s weights and adding the single values, a matrix of global preferences is calculated. In this matrix, the sum of the row expresses the strength of an alternative (dominance). The sum of the column expresses how much an alternative is dominated by the other ones (sub-dominance). A linear ranking is obtained by finding the difference between the sub-dominance and the sub-dominance value.
The PROMETHEE II method is explained by considering the alternates as A1, A2,...An and the Criteria as C1,C2...Cm where the criteria set C1 denotes the CPU Speed, C2 represents Number of cores and C3 is considered to be the Free Memory space. The sample dataset considered criteria weight age values for finding the right decision are w1 = 0.2, w2 = 0.3, w3 = 0.5. The sample dataset required for illustrating PROMETHEE II method is given as:
C1 C2 C3 A1 1.5 1 3 A2 3.5 4 25 A3 1.5 2 1
The process of PROMETHEE II method is initiated with the normalized decision matrix, which is generated using either of the formulae given in the Equations (1) and (2) in [12].
,,…,,,… . . . 1
,,…,,,… … 2 Max and Min in equations specifies the maximum and minimum values of each criterion for the considered alternatives. The Max and Min values for each criterion are given in the table (2).
Table 2: Maximum & Minimum
Max 3.5 4 25 Min 1.5 1 1
[image:4.595.350.461.189.225.2]The normalized decision matrix which is generated using the formula in the Equation (1) for the considered sample dataset is given as:
Table 3: Normalized decision matrix
0 0 0.0833
1 1 1
0 0.333 0
The difference in criteria values for each pair-wise alternative is computed and the evaluation matrix is generated using the preference function given in Equation (3) and the preference functions for all pairs of alternatives for the sample dataset is given in Table (4).
, ′ 0 ′
, ′ ′ ′
[image:4.595.139.241.417.468.2]… 3
Table 4: Preference functions for all pairs of alternatives
Location
Pair C1 C2 C3 (1,2) 0.0 0.0 0.0
(1,3) 0.0 0.0 0.00833336
(2,1) 1.0 1.0 0.9166667
(2,3) 1.0 0.6667 1.0
(3,1) 0.0 0.3334 0.0
(3,2) 0.0 0.0 0.0
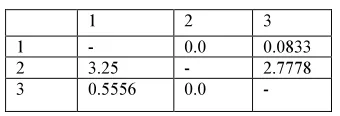
The aggregated preferences function values for all the paired alternatives is computed using the Equation (4) and Table (5) represents the aggregated preference values.
, ′ ∑
∗ ,′
[image:4.595.320.490.593.651.2]∑ … 4
Table 5: Aggregated Preference Functions
1 2 3
1 - 0.0 0.0833
2 3.25 - 2.7778
3 0.5556 0.0 -
702
outranking flow is the difference between the leaving and entering flows which is computed using the Equation (7).
∑ , ′
′ ′ … 5 ∑ ′,
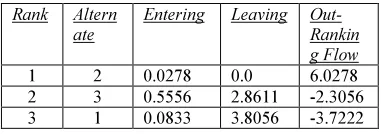
[image:5.595.87.279.349.416.2]′ ′ … 6 … 7 Based on these outranking flows, the PROMETHEE I method can provide a partial pre-order of the alternatives whereas the PROMETHEE II method can give the complete pre-order by using a net flow, though it loses much information of preference relations. The entering and leaving flows for the considered dataset and its outranking is given in Table (6).
Table 6: Entering, Leaving and Out-Ranking Flows
Rank Altern
ate
Entering Leaving
Out-Rankin g Flow
1 2 0.0278 0.0 6.0278 2 3 0.5556 2.8611 -2.3056 3 1 0.0833 3.8056 -3.7222
Finally, the ranking of all the considered alternatives is determined depending on the values of net-outranking flow. For the considered example, the alternative with higher value of outranking flow which is 6.0278 is chosen to be the best alternative.
3.3 ELECTRE-I
Elimination and choice translating reality (ELECTRE) by [4] is one of the multiple criteria decision making (MCDM) methods. This method allows decision makers to select the best choice with maximum advantage and minimum conflict in the function to multi-attribute criteria. Different versions of ELECTRE have been developed including ELECTRE I, II, III, IV and TRI. All methods are based on the same fundamental con-cepts but differ both operationally and according to the type of the decision problem. Specifically, ELECTRE-I is designed for selection problems in [6].
The main idea is the proper utilization of “outranking relations” in [11]. Outranking relation is formed based on the dominance of relations among alternatives in the ELECTRE I method. This method creates the possibility to model a decision making process by using two types of
coordination indices. These indices are concordance and discordance matrices
in [6
]. The decision maker uses concordance and discordance indices to analyze outranking relations among different alternatives and to choose the best alternative using the crisp data in [13].It is assumed that A1,A2…..Am are m possible alternatives for optimal resource sharing in P2P collaboration. Let C1,C2…Cn are criteria that are used to describe the alternatives after the assignment defined as Xij for the degree of alternative Ai with respect to criteria Cj. Let W1, W2…Wn be the weight for importance of the criteria C1,C2…Cn. The computation flow process of ELECTRE I method is stated in the following paragraphs. The weight values of all the criteria is defined using the Equation (8) from [5].
∑
… 8 W = { w1 , w2, w3, …, wn};
0≤w1,w2,…,wn≤1 (w1+w2+w3, ... +wn = 1)
The assumed weight values for every criteria is 0.2, 0.5, and 0.3 whose summation is 1. The sample dataset for illustrating ELECTRE I method is given as:
1
2
5
.
1
25
4
5
.
3
3
1
5
.
1
As the initial step, the normalized matrix R = [rij] is generated using the Equation (9).
!"# $ %∑$
… 9
The generated normalized matrix for the considered dataset is given as:
=
=
0016
.
0
0952
.
0
0896
.
0
0394
.
0
1905
.
0
209
.
0
0047
.
0
0476
.
0
0896
.
0
]
[
r
ijR
703
V R ∗ W
+. ,⋮ ⋯ . ,⋱ ⋮
, ⋯ ,0 . . . 10
=
=
=
0005
.
0
0476
.
0
0179
.
0
00118
.
0
0952
.
0
0418
.
0
0014
.
0
0238
.
0
0179
.
0
*
]
[
*
j ijw
r
W
R
V
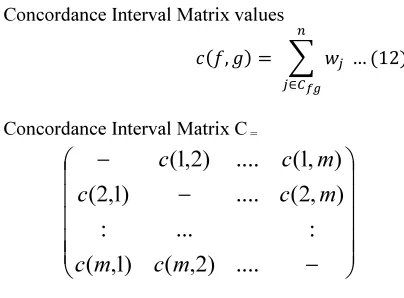
The coordination index Concordance (Cfg) and its interval matrix values are computed using the Equation (11) and the concordance interval matrix is computed using the Equation (12).
Concordance index
1 2j | x 6 x 7 … 11 Concordance Interval Matrix values
8, 9 : ∈
… 12
Concordance Interval Matrix C =
−
−
−
....
)
2
,
(
)
1
,
(
:
...
:
)
,
2
(
....
)
1
,
2
(
)
,
1
(
....
)
2
,
1
(
m
c
m
c
m
c
c
m
c
c
The concordance Interval Matrix for the considered sample dataset is given as:
−
−
−
=
0
7
.
0
1
1
5
.
0
0
C
The coordination index Discordance (Dfg) and its interval matrix values are computed using the Equation (13) and the discordance interval matrix is computed using the Equation (14).
Discordance index
; 2j |x< x 7 … 13 Discordance Interval Matrix values
=, 9 ∈ |" "|
∈,,∈|" "| . . . 14
Discordance Interval Matrix
D =
−
−
−
....
)
2
,
(
)
1
,
(
:
...
:
)
,
2
(
....
)
1
,
2
(
)
,
1
(
....
)
2
,
1
(
m
d
m
d
m
d
d
m
d
d
The discordance Interval Matrix for the considered sample dataset is given as:
−
−
−
−
=
2381
.
0
1
1
1
0397
.
0
1455
.
0
1
D
The average dominance indices are computed using the Equations (15) and (16) and the values 1>>>> and ;>>>>> for the sample dataset is computed to be 0.5833 and 0.5044 respectively.
1
>>>> ∑∑# ,
… (15)
;
>>>>> ∑∑$ , … (16)
The net superior and inferior value C and D respectively are calculated using the Equations (17) and (18). Cf sums together the number of competitive superiority for all alternatives, and the alternative with higher value is the better one. On the contrary, Df is used to determine the number of inferiority ranking the alternatives. The smaller net inferior value gets better dominant.
C ∑ cf, g ∑ cg, f% %
… (17)
D ∑ df, g ∑ dg, f% %
[image:6.595.86.288.363.512.2]… (18)
Table 7: Net-Superior & Net-Inferior Values
Rank Net-Superior Net-Inferior
Alternate Value Alternate Value
1 1 -1.2 2 2.3836
2 3 -0.8 3 -0.277
3 2 2 1 -2.1058
4. IMPLEMENTATION AND RESULTS
704
[image:7.595.300.518.74.246.2]could be dedicated for collaborative tasks. The requesting peer gives its specification and ranking of peers is done on the basis of the attributes that would satisfy the requirements. This system was implemented in Java and tested with the dataset generated by [16] from Computer Networking Research laboratory. The system was tested with 640 peers by varying the number of attributes to be 3, 5 and 7. The attributes that were considered in this system are given in Table 8.
Table 8: Attribute Representation
Attribute Notation used
Units Data type
CPU Speed CSp GHz Float
No. of Core Processors
NCore - Integer
CPU Free Space CFree % Float Memory Size MSize GB Float Memory Free Space MFree % Float
Disk Size DSize GB Float
Disk Free Space DFree GB Float Data Receiver Rate Rx Bps Float
Data Transmission Rate
Tx bps Float
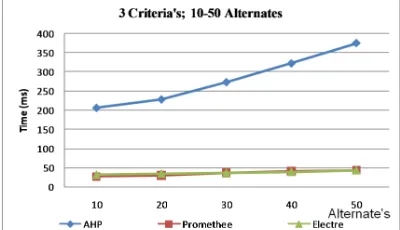
Each attribute has a value that belongs to a given domain. The domain is typically bounded and may represent a continuous or discrete value. For example, free memory is continuous, number of Processors is discrete. Attribute values are further classified as static (e.g., CPU speed, operating system) and dynamic (e.g., free memory and transaction rate). The performance analysis of the system is compared for the attributes with criteria to be 3, 5 and 7. The graph shown in Figures 1a and 1b shows the performance analysis of the three methods for 640 peers for having the number of criteria be fixed as 3.
Figure 1a: Performance of 3 criteria's 10-50 Alternates
Figure 1b: Performance of 3 criteria's 50-640 Alternates
It is observed that the process of decision making is fast for AHP when the number of peers is less but increases sharply when the number of peers participating in the collaborative process is more. It can be further observed that the time taken by PROMETHEE and ELECTRE methods is similar and remains more or less constant with increase in the number of peers.
The performance analysis of the system for 640 peers for the criteria setting to be 5 and 7 are shown in Figures 2 and 3.
[image:7.595.306.509.412.531.2]Figure 2a: Performance of 5 criteria's; 10-50 Alternates
[image:7.595.89.289.584.699.2]705
Figure 3a: Performance of 7 criteria's; 10-50 Alternates
Figure 3b: Performance of 7 criteria's; 50-640 Alternates
It is observed that the graphs show that initially, the time taken for decision making is independent of the criteria selection. However, the time increases proportionally to the number of criteria. The process of decision making is fast when the number of peers is less irrespective of the number of criteria. Also, the graphs infer that PROMETHEE and ELECTRE methods take lesser time for ranking the alternatives when compared to AHP method.
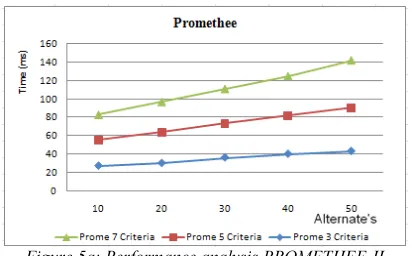
Figure 4, 5, and 6 shows the comparative performance of the individual methods for different criteria.
Figure 4a: Performance analysis AHP method of the system for 10-50 peers.
Figure 4b: Performance analysis AHP method of the system for 50-640 peers.
706
Figure 5b: Performance analysis PROMETHEE -II
method of the system for 50-640 peers.
Figure 6a: Performance analysis ELECTREE-I method
of the system for 10-50 peers.
Figure 6b: Performance analysis ELECTREE-I method
of the system for 50-640 peers.
The execution time of AHP model is more due to the concept of pair wise comparison. Hence as the number of criteria or the number of peers increase, the number of comparison also increases and the execution time would be higher. This is clearly observed from the results. While comparing the models PROMETHE and ELECTRE, the execution time required for PROMETHE is slightly more than that of ELECTRE. The process time also increases when the number of peers or criteria increases. However, the increase in time of PROMETHEE and ELECTRE methods is comparatively less than that of AHP.
It should also be observed that from the discussion of the methods, that the AHP method requires preprocessing as compared to the other methods. While all the three methods can be used for selection of the right peer for collaboration, there are differences in the approach used by the three methods. PROMETHEE and ELECTRE support the decision making system to choose the best choice in the available scenario. The AHP method supports the optimal selection of choices according to the requirements of the user.
5. CONCLUSION
The process of selecting the right peer for collaboration requires decision to be made on multi criteria. In this paper, MCDM models AHP, PROMETHEE and ELECTRE were implemented and compared for peer collaboration on different criteria and for varying number of criteria. It was observed that the decision making process time was the highest for AHP as compared with PROMETHEE and ELECTRE. The time taken for AHP methods increased sharply with increase in the number of peers and number of criteria. While there was increase for PROMETHEE and ELECTRE methods, the increase in execution time was comparatively less. While the AHP method supports the optimal selection of choices according to the requirements of the user, PROMETHEE and ELECTRE provide the best choice in the available scenario.
REFERENCES:
[1] Boucher, T.O. and McStravic, E.L.: 1991. Multi-attribute Evaluation Within a Present Value Framework and its Relation to the Analytic Hierarchy Process. The Engineering Economist, Volume 37, Issue 1, 37: 55-71, DOI: 10.1080/00137919108903055.
[2] Brans, J.P. 1982: L’ingénierie de la décision: élaboration d’instruments d’aide à la décision. La méthode PROMETHEE. Presses de l’Université Laval.
707
Accessed: 06/04/2011 11:48; 0025-1909/85/3106/0647 Copyright @ 1985, The Institute of Management Sciences Your use of the JSTOR archive indicates your acceptance of JSTOR's Terms and Conditions of Use, available
[4] Cambron, K.E. and Evans, G.W., 1991. Layout Design Using the Analytic Hierarchy Process. Computers & IE, 20: 221-229. URL:http://bit.csc.lsu.edu/trianta/Journal_PA PERS1/AHPEVL1.pdf
[5] Ermatita Department of Information System, Computer Science Faculty of Sriwijaya University Indonesia (Doctoral Program Student Computer Science Gadjah Mada University) Jl. Palembang-Prabumulih, Ogan Ilir, INDONESIA, [email protected], Sri Hartati, Retantyo Wardoyo, Agus Harjoko; Departement of Computer Science and Electronics Mathematics and Natural Sciences Faculty Gadjah Mada University, Indonesia; Electre Methods In Solving Group Decision Support System Bioinformatics On Gene Mutation Detection Simulation; International Journal of Computer Science & Information Technology (IJCSIT), Vol 3, No 1, Feb 2011; DOI : 10.5121/ijcsit.2011.3104.
[6] Esra AYTAÇ 2010; Esra AYTAÇ, Ayşegül TUŞ IŞIK, Nilsen KUNDAKCI; Fuzzy ELECTRE I Method for Evaluating Catering Firm Alternatives Yemek Firması Alternatiflerini Değerlendirmede Bulanık ELECTRE I Yöntemi
[7] Jihong Pang, College of Mechanical Engineering, Chongqing University, Chongqing 400044, China, Department of Management, Guangxi University of Technology, Liuzhou 545006, China, E-mail: [email protected], Genbao Zhang and Guohua Chen. College of Mechanical Engineering, Chongqing University, Chongqing 400044, China, E-mail: [email protected];
[email protected], ELECTRE I Decision Model of Reliability Design Scheme for Computer Numerical Control Machine; JOURNAL OF SOFTWARE, ACADEMY PUBLISHER; Page 894-900; VOL. 6, NO. 5, MAY 2011.International Journal of Computer Science & Information Technology (IJCSIT),
Vol 3, No 1, Feb 2011; doi:10.4304/jsw.6.5.894-900
[8] Putrus, P., 1990. Accounting for Intangibles in Integrated Manufacturing (nonfinancial justification based on the Analytical Hierarchy Process). Information Strategy, 6: 25-30.
[9] T. L. Saaty, "The Analytic Hierarchy Process," New York:, McGraw Hill International,, 1980. DOI:10.5539/ijbm.v8n8p22
[10] Satinee Lertprapai Review: Multiple Criteria Decision Making Method with Applications, Department of Mathematics, Faculty of Science Burapha University, Chonburi, Thailand 20131 [email protected]; International Mathematical Forum, Vol. 8, 2013, no. 7, 347 - 355.
[11] Vahdani and Hadipour, 2011 Behnam Vahdani, Hasan Hadipour; Extension of the ELECTRE method based on interval-valued fuzzy sets; Soft Computing March 2011 Volume 15, Issue 3, pp 569-579; DOI : 10.1007/s00500-010-0563-5.
[12] Vijay Manikrao Athawale, Department of Mechanical Engineering, Government Polytechnic, Amravati - 444603, India, Shankar Chakraborty, Department of Production Engineering, Jadavpur University, Kolkata - 700032, India; Facility Location Selection using PROMETHEE II Method; Proceedings of the 2010 International Conference on Industrial Engineering and Operations Management Dhaka,Bangladesh, January 9 – 10,pp59-64 2010.
FUZZ-708
IEEE 2009, Korea, August 20-24 2009; DOI 978-14244-3597-5/09
[14] Wabalickis R.N., 1988. Justification of FMS with the Analytic Hierarchy Process. Journal of Manufacturing Systems, 17: 175-182, DOI: 10.1108/17410380510626204
[15] Wang, L., and Raz, T. 1991. Analytic Hierarchy Process Based on Data Flow Problem. Computers & IE, 20:355-365, DOI:10.1016/0360-8352(91)90007-S