www.hydrol-earth-syst-sci.net/18/5025/2014/ doi:10.5194/hess-18-5025-2014
© Author(s) 2014. CC Attribution 3.0 License.
A virtual water network of the Roman world
B. J. Dermody1, R. P. H. van Beek2, E. Meeks3, K. Klein Goldewijk1,4, W. Scheidel5, Y. van der Velde6, M. F. P. Bierkens2, M. J. Wassen1, and S. C. Dekker1
1Utrecht University, Department of Environmental Sciences, Copernicus Institute, Utrecht, the Netherlands 2Utrecht University, Department of Physical Geography, Utrecht, the Netherlands
3Stanford University Library, Palo Alto, USA
4Netherlands Environmental Assessment Agency, De Bilt, the Netherlands 5Stanford University, Department of Classics, Palo Alto, USA
6Wageningen University, Department of soil, geography and landscape, Wageningen, the Netherlands
Correspondence to: B. J. Dermody ([email protected])
Received: 19 May 2014 – Published in Hydrol. Earth Syst. Sci. Discuss.: 20 June 2014 Revised: – – Accepted: 25 November 2014 – Published: 11 December 2014
Abstract. The Romans were perhaps the most impressive ex-ponents of water resource management in preindustrial times with irrigation and virtual water trade facilitating unprece-dented urbanization and socioeconomic stability for hun-dreds of years in a region of highly variable climate. To understand Roman water resource management in response to urbanization and climate variability, a Virtual Water Net-work of the Roman World was developed. Using this netNet-work we find that irrigation and virtual water trade increased Ro-man resilience to interannual climate variability. However, urbanization arising from virtual water trade likely pushed the Empire closer to the boundary of its water resources, led to an increase in import costs, and eroded its resilience to cli-mate variability in the long term. In addition to improving our understanding of Roman water resource management, our cost–distance-based analysis illuminates how increases in import costs arising from climatic and population pres-sures are likely to be distributed in the future global virtual water network.
1 Introduction
Trade is central to safeguarding food security under the twin pressures of growing demand and intensified climate vari-ability (Godfray et al., 2010; Schmidhuber and Tubiello, 2007). The redistribution of food through trade sustains populations where local food resources are insufficient to meet demand or where climatic variability causes low yields
forcings and crop response to climate change make future predictions on VW trade and VW content highly uncertain (Fader et al., 2010; Konar et al., 2013; Zhao et al., 2014).
Sivapalan et al. (2012) recommend studying past soci-ety’s relations with water, a term they refer to as historical socio-hydrology, to understand fundamental processes link-ing humans and water resources. They propose that water has played a role in the growth, evolution and eventual col-lapse of many past societies. Therefore by studying the re-lation of past societies with water we can illuminate fac-tors that are also relevant in the present day, such as how close we are to reaching the planetary boundaries of current freshwater resources (Bogardi et al., 2013; Rockström et al., 2009). Historical socio-hydrology principles were applied in an analysis of the coevolution of society and water resources over the last 2000 years in the Tarim river basin of north-west China (Liu et al., 2014). Based on historical reconstruc-tions, Liu et al. (2014) developed a conceptual model which identified a positive, destructive feedback loop related to eco-nomic gains from water resources and a negative, restorative feedback loop related to the impacts of exploitation of wa-ter resources. That same model was shown to be representa-tive of the changes in the Murrumbidgee catchment in Aus-tralia over the last 100 years indicating that an historical basis for understanding socio-hydrological systems shows promise (van Emmerik et al., 2014). In a modelling context, one of the principal advantages of using historical data is that it is possible to constrain simulations based on historical re-constructions and compare model output with what actually happened (given the inherent uncertainties of historical re-constructions) (Cornell et al., 2010; van der Leeuw et al., 2011). Such an approach can indicate if the assumptions and processes incorporated in models are valid. A modelling ap-proach can also be revealing in an historical context (Cornell et al., 2010). For example, the use of physically based models in an historical context facilitates the refinement of theories about past human relations with their environment based on what was physically possible given the constraints of the en-vironment.
In the preindustrial period, the Roman Empire was likely the greatest exponent of virtual water trade as evidenced by the widespread trade in water resources, and particularly grain, throughout the Mediterranean and Black Sea region (Erdkamp, 2005; Kessler and Temin, 2007; Rickman, 1980; Scheidel, 2010). Supplying the main cities of the Empire with sufficient grain was one of the principal preoccupations of the ruling elite throughout the lifetime of the Republic and Empire, to the extent that a stable supply of grain to the city of Rome became personified by the deity Anonna (Ma-zoyer and Roudart, 2006; Rickman, 1980). In a close parallel to current demographic trends (Chen, 2007; United Nations, 2012), an explosion in urban populations during the Late Re-publican era (Bowman and Wilson, 2011) led many cities to overshoot their local ecohydrological carrying capacities bringing about an increased reliance on imports of VW
(Erd-kamp, 2005). Similar trends, but of a much greater magni-tude, are seen in the present day across the globe in countries such as China where rapid urbanization, increased affluence and relaxing of trade restrictions have brought about a 20-fold increase in VW imports in less than a quarter of a cen-tury (Hubacek et al., 2009; Shi et al., 2014).
As with current society, the Romans sought to secure food security in two principal ways: through in situ water re-source management using rainfed agriculture and irrigation (Fader et al., 2010; Torell et al., 1990; Wada et al., 2011) and through VW trade (Barnaby, 2009; Shi et al., 2014; Yang and Zehnder, 2001). Irrigation enabled the Romans to max-imize exploitation of local water resources whilst VW trade allowed them to inhabit regions where local water resources were insufficient for the resident population (Garnsey, 1988; D’Odorico et al., 2010). The Romans also made use of large municipal grain stores which were replenished after each har-vest owing to spoilage. These municipal stores acted as a buffer for when imports became disrupted (Erdkamp, 2005). Temporal market speculation on grain through hoarding is thought to have been limited in the Roman period, how-ever. Market speculation was a high-risk venture owing to the loss in value of grain as a result of storage and the high uncertainty associated with predicting surpluses or deficits in subsequent years (Erdkamp, 2005). As a result VW distribu-tion predominantly responded directly to yield surpluses and deficits integrated over a short number of years rather than complex economic dynamics arising from speculation (Erd-kamp, 2005; Horden and Purcell, 2000).
In terms of in situ water resource management the Romans made use of a wealth irrigation technologies such as dams, aqueducts, canals, cisterns, water wheels and qanats (Barker, 1996; Wilson, 1997). The maintenance and operation of irri-gation infrastructure was tightly controlled with users taxed on the extent of land they irrigated in regions such as Egypt or on the magnitude of their harvest in Spain, Sicily and Sar-dinia (Beltrán Lloris, 2006; Erdkamp, 2005). The Romans were far from the first Mediterranean civilization to use such water management practices but the extent and organization was unprecedented and enabled them to achieve high agricul-tural yields throughout their Empire (Barker, 1996). Not only did irrigation increase grain production but surface water was a far more reliable source of water compared with precipita-tion, particularly in large river basins such as the Nile Delta, the Po Valley and the Orontes, Ebro and Vera catchments in present-day Syria and Spain (Beltrán Lloris, 2006; Butzer et al., 1985; van der Leeuw, 1998).
There was a parallel free market, however it was thought that the urban grain supply was too important to be risked on the free market and was ensured by hierarchical methods (Rickman, 1980). The principal constraint on VW redistri-bution in the Roman period was the “struggle against dis-tance” (Braudel, 1995). However, advanced shipping tech-nology during the Roman period combined with the relative safety of summer maritime travel within the Mediterranean facilitated unprecedented trade in bulk goods such as grain (Houston, 1988). As with the present day, trade costs of these bulk goods co-varied with distance (Hummels, 2007). How-ever, transport by ship was significantly cheaper compared with overland transport owing to the difficultly in land-based transport of bulk goods by horse and cart (Jones, 1986; Schei-del, 2013) – a feature of trade in bulk goods that remains de-spite modern advancements in transport technology (Limão and Venables, 2001).
In this paper we set out to examine how irrigation and VW trade contributed to Roman resilience against the twin pres-sures of urbanization and climate variability. In order to un-derstand this we have developed a Virtual Water Network of the Roman World. Our VW network contains two princi-pal components: a hydrological model and a dynamic, agent-based VW redistribution network. We simulate yields under variable climate conditions using the hydrological model PC Raster Global Water Balance Model (PCR-GLOBWB) (van Beek and Bierkens, 2009; van Beek et al., 2011). VW trade is simulated using Orbis, the Stanford Geospatial Network of the Roman World (Scheidel, 2013) as our network structure, with link weights reflecting transport costs at AD 200 associ-ated with the “struggle against distance” (Braudel, 1995). We do not model the feedbacks between the trade dynamics and hydrology (similar to the socio-hydrological approach pro-posed by Liu et al. (2014) and Elshafei et al. (2014) for ex-ample); rather we apply a scenario-based approach using his-torical reconstructions and the physical hydrological model as constraints. Our analysis of the Roman water resource management not only adds to our understanding of that civi-lization but also helps us to understand the fundamental pro-cesses underpinning VW trade in the present day (Sivapalan et al., 2012).
2 Methods
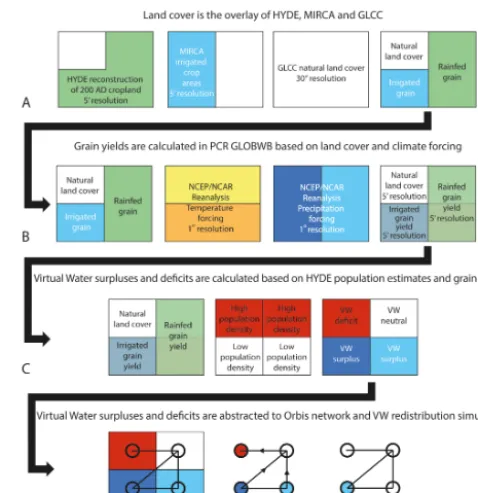
[image:3.612.308.547.64.310.2]The schematic of our Virtual Water Network of the Roman World is shown in Fig. 1. To summarize our methodology; we calculated yields using the global hydrological model PCR-GLOBWB based on estimates of the extent of Roman cropland in AD 200 from the History Database of the Global Environment (HYDE) (Klein Goldewijk et al., 2011). Land with a potential for irrigation was assigned within HYDE cropland regions based on the MIRCA data set of Portmann et al. (2008). Natural land cover was assigned based on the Olson classification (Olson, 1994a, b). The yield response
Figure 1. Schematic of our virtual water network of the Roman
world. (a) The overlay of the History Database of the Global Envi-ronment (HYDE) cropland reconstructions for AD 200, monthly ir-rigated and rainfed crop areas (MIRCA) and global land cover char-acterization (GLCC) forms the land cover attributes in our model. Regions are only assigned as irrigated where MIRCA irrigated re-gions overlap with historical cropland rere-gions. (b) Grain yields in irrigated and rainfed agricultural regions are simulated in PC Raster Global Water Balance model (PCR-GLOBWB) based on 52 years of spatially and temporally variable temperature and precipitation forcing. (c) Regions are defined based on a Thiessen polygon op-eration between network nodes (Fig. S1). Virtual water surpluses and deficits are calculated for each region based on HYDE recon-structions of Roman population distribution and grain yields calcu-lated in PCR-GLOBWB. We fix the annual grain consumption at 200 kg per person. (d) The virtual water surpluses and deficits are abstracted to the Orbis network and virtual water redistribution is simulated. Deficit nodes import virtual water from surplus nodes along the minimum cost path. Imports continue until the demand of deficit nodes is met. See Fig. S2 for a spatially explicit schematic of our virtual water network of the Roman world.
2.1 Simulating cereal yields under variable climate We computed VW based on cereals at 5’ minute spatial resolution under rainfed and irrigated cultivation using the Global Hydrological model PCR-GLOBWB (see van Beek et al. (2011) and van Beek and Bierkens (2009) for a de-tailed description of the model). PCR-GLOBWB is a spa-tially explicit three-layer (two soil layers and one groundwa-ter reservoir) hydrological model that computes the vertical water balance for different land cover types under prescribed meteorological conditions and routes the specific runoff to obtain discharge fields. One of the outputs of the vertical ter balance is the actual transpiration (so-called green wa-ter) which was used here to estimate grain yields (Dooren-bos and A.H. Kassam, 1979). When soil moisture is limiting, yield may be maximized for a healthy and fertilized crop if the crop water requirements are met by irrigation (blue wa-ter) and the crop transpires at the potential rate sustained by the atmospheric demand (Allen et al., 1998). Following this principle, yield can be taken to be proportional to the water use efficiency multiplied by transpiration (Zwart et al., 2010). The crop water requirements equal the difference between potential and actual evapotranspiration for the cropped area and correspond to the irrigation water demand when divided by the irrigation efficiency that accounts for conveyance and application losses. Using these principles, irrigation water demand and the realized yield were evaluated on a monthly scale with consideration of climate variability. To this end, the potential and actual evapotranspiration rates of cropped areas when fed by rainfall only were used to compute the ir-rigation water demand (see Wada et al., 2011 for details) and to ascertain what proportion of the irrigation water demand can be satisfied with the available discharge.
PCR-GLOBWB requires meteorological and land cover data as input. As meteorological forcing we used the Na-tional Center for Environmental Prediction/NaNa-tional Center for Atmospheric Research (NCEP/NCAR) corrected by the Climate Research Unit (CRU) climate reanalysis data set over the period 1949–2000 (Ngo-Duc et al., 2005), which downscales NCEP/NCAR data to a regular 1-degree global grid with a daily resolution. Using current reanalysis data for the Roman period was deemed acceptable as the recon-structed Roman climate optimum was estimated to be com-parable with the mean Northern Hemisphere temperature be-tween 1961 and 1990 (Ljungqvist, 2010). In terms of pre-cipitation, early modelling studies had suggested that greater forest cover in the Roman period maintained a wetter cli-mate (Reale and Dirmeyer, 2000; Reale and Shukla, 2000). However, historical, archaeological and palaeoclimatological evidence indicates that the mean background climate in the Mediterranean during the Roman period was broadly simi-lar to the present day although there were likely centennial– millennial shifts in synoptic climate systems which would have made certain regions relatively drier or wetter on av-erage at different times during the Roman period (Büntgen
et al., 2011; Dermody et al., 2012). The impacts of longer-term shifts in the synoptic climate systems on Roman wa-ter resource management will be assessed in a follow-up pa-per. The CRU TS 2.1 data set only specifies variables for the global land mass, so as to ensure global coverage, the orig-inal NCEP/NCAR values were inserted if no values were specified. From this data set, daily precipitation totals and the average temperature were used directly as model input. The model also requires reference potential evapotranspira-tion as direct input which was computed using the Hamon method (Allen et al., 1998), which only requires temperature as meteorological input compared to more complex equa-tions. Monthly climatology’s of wind speed and relative hu-midity were used indirectly to estimate the crop factors (see below).
To partition precipitation (rainfall, snow) into intercep-tion and throughfall and to prescribe the crop-specific po-tential evapotranspiration, PCR-GLOBWB requires the in-terception capacity, ground cover and the crop coefficient for each land cover type. The natural land cover parametriza-tion is based on the Global Land Cover Characterizaparametriza-tion (GLCC) at 30 second spatial resolution with the Olson clas-sification (Olson, 1994a, b) and the parameter set of Hage-mann et al. (1999). Irrigated areas were inserted using the MIRCA data set of Portmann et al. (2008) (see van Beek et al., 2011; Wada et al., 2011 for details). The fraction of each cell assigned as crop and pasture land was defined based on History Database of the Global Environment (HYDE) re-constructions for AD 200 at 50 horizontal resolution (Klein Goldewijk et al., 2011) (Fig. S3). HYDE does not explic-itly account for crop rotation and the issue of crop rotation in the Roman period remains controversial, with some au-thors claiming that no rotation was practised in Roman times whereas others claim two-field rotation was practised with one half of fields laying fallow at any one time (Fox, 1986). Based on White (1970), we adopt an intermediate value of continual three-field cropping with 2 years of a cereal crop and 1 year of fallow assigned as sparse grassland according to GLCC. In irrigated regions we employ multi-season cereal cropping based on the crop calendars from the MIRCA data set (Portmann et al., 2008).
The land cover parametrization is derived from the 3000 distribution of the GLCC (Olson, 1994a, b). In order to in-corporate the information on cultivated area for the Roman period from the HYDE data set, having a spatial resolution of 50, the distribution of cultivated and pasture areas was
re-constructed at the resolution of 3000. Within each 50cell, all
3000cells were ranked on suitability; using the GLCC
dis-tance from the boundaries of these areas outwards. Suitabil-ity was then scaled between the minimum and maximum val-ues to yield a range between 0 and 1. This suitability was then used to iteratively select the most suitable cells until the de-sired area was met. Precedence was first given to cultivated area, followed by pasture. The remaining area was filled with the reconstructed natural vegetation from the GLCC data set. The resulting mosaic at 3000was consecutively used to com-pute the effective values of the land cover parametrization per land use type at 50. Any remaining cells were assigned as semi-natural land cover types that were extrapolated spa-tially on the basis of the Holdridge life zones (Leemans, 1990, 1992). For the semi-natural vegetation, a subdivision between short and tall natural vegetation was made on the basis of forest fraction.
Cropland was subdivided proportionally into irrigated and rainfed land on the basis of the MIRCA data set, giving, with pasture, a total of five land cover classes within each cell. Monthly characteristics were prescribed to account for seasonal growth changes in cereals and natural vegetation. For short-natural, tall-natural and pasture land cover types, these values were based on the original Olson classifica-tion and the corresponding parametrizaclassifica-tion of Hagemann et al. (1999). For the irrigated and rainfed cropland, the crop factors and calendars were taken directly from the MIRCA data set (Portmann et al., 2008) for cereals under rainfed and irrigated conditions and weighted by area. Water use efficiency for all cereals was assigned the value for winter wheat and crop yield taken to be equivalent to 25 % of the total above-ground biomass compared to the 35 % used by Zwart et al. (2010) for present-day crops, in line with esti-mates from Roman and pre-agricultural revolution sources (Erdkamp, 2005; Goodchild, 2007). It is important to high-light that we only calculated yields based on cereal crops whereas large portions of land would have also been given over to viticulture, olives, market gardens and so forth (Col-umella, 70AD; Erdkamp, 2005).
HYDE population values were used to calculate VW wa-ter demand as well as the workforce available for harvest. In addition to water availability, labour availability constrains the area that can be cultivated. The labouring population was calculated based on the grid-based population estimates from the HYDE data set (Klein Goldewijk et al., 2011). We esti-mated a harvesting period of 1 month with an average har-vest area per person per day of 0.2 ha which equates to 6 ha per person per year. We restricted harvesting to the able-bodied population aged between 12 and 55. Based on demo-graphic life tables from Roman Egypt, this equated to 55 % of the population that were capable of helping with the har-vest (Frier, 1982). HYDE population values were also used to calculate VW demand based on a consumption of 200 kg of grain per person per year (Erdkamp, 2005). For the 20 most populous cities in the Empire, the grid-based popula-tion values of HYDE were corrected using Chandler’s (1987) estimates of Roman urban population. For each cell we
sub-tracted the population demand from the realized yield pro-viding yearly maps of surplus and deficit VW (Fig. S4).
2.2 Simulating virtual water redistribution
Orbis, the Stanford Geospatial Network of the Roman World forms the basis for our VW redistribution network of the Roman world (Meeks, 2013; Scheidel, 2013). Orbis broadly reflects the transport network in the Roman Empire around AD 200 with all links confirmed as Roman era transport routes although we cannot be certain that all were active in AD 200. Orbis should be taken in the spirit for which it was intended, which is to outline the dramatic contrasts between terrestrial, fluvial and maritime transportation expenses and the patterns they imposed on the flow of goods within the Roman Empire (Scheidel, 2013). Orbis contains a database of 751 roman towns and cities that form the nodes within our network. These cities are linked by (1371×2) directed edge segments that represent the cost to transport a kilogram of grain in denarii along Roman roads, rivers and over sea in each month of the year based on “Diocletian’s Edict on Max-imum Prices” and physical cost distance calculations (Schei-del, 2013). The links between each node have a cost rep-resenting transport in each direction. For example, up-river transport is more costly compared with down-river transport. We used transport costs for the month of June because the majority of grain was transported during summer months when sea conditions were calm (Erdkamp, 2005; Horden and Purcell, 2000).
We collapsed nodes within 10 km of each other into one node owing to the resolution of the underlying gridded data, leaving us with 649 nodes. To simplify calculations in our dynamic redistribution model, we converted the directed net-work of Orbis into an undirected netnet-work by taking the aver-age cost of the directed links between nodes resulting in a to-tal of 1371 undirected links. As we are interested in Mediter-ranean climate variability, we restricted our analysis to the part of the network that extends from 10◦W to 45◦E and 25 to 46◦N, however all simulations were carried out for the en-tire Empire. In order to convert grid-based surplus and deficit data to the Orbis network structure we assigned city regions using a Thiessen polygon operation between our city nodes (see Fig. S1 for city regions). All gridded data within these regions were summed and applied to the relevant city or town node. Therefore certain nodes in the network were either VW rich or VW poor based on the total grain yield minus total grain demand within that city region. The VW surplus and deficits in each node changed each year based on changes in yield owing to climate variability. We represent VW water imports and exports in tonnes of grain year−1rather than cu-bic metres of water to make our findings more accessible to non-specialists in hydrology.
Scheidel, 2010), our network is demand driven with each VW-poor node (nodes with a VW deficit) individually de-manding VW from linked VW-rich nodes. That is to say, our network simulates a hierarchical grain supply system whereby urban centres ensure supplies through taxation in kind, constrained by the struggle against distance (Braudel, 1995). Although much of the evidence on which we base our trade rules pertain to the city of Rome, it is likely that other major cities used similar methods to ensure grain supplies. Similarly to D’Odorico et al. (2010), we do not simulate VW trade between VW-rich nodes although this may have oc-curred. Since the links in our network are undirected, flow direction is dictated by the VW potential among VW-rich and VW-poor nodes. Thus, VW flow in our network responds directly to changes in yields arising from climate variabil-ity. VW redistribution is simulated over 52 years of climate variability (Ngo-Duc et al., 2005), with a year ending when demand at all deficit nodes has been satisfied or all surplus nodes are depleted. We quantify the stress on the system in terms of the cost to import VW with costs measured at all VW-poor nodes.
3 Results and discussion
3.1 Yield response to climate variability
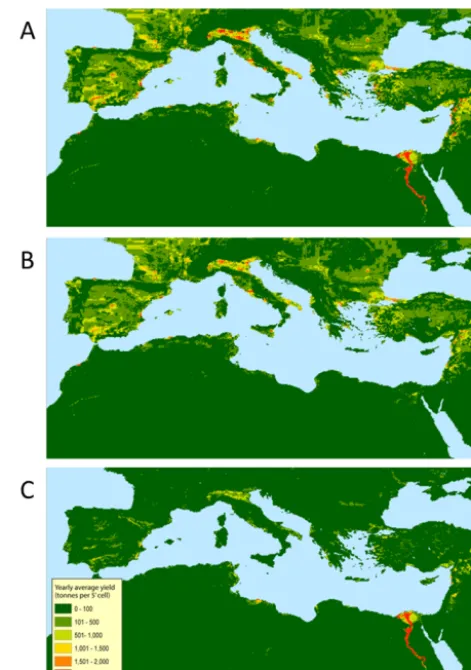
The yearly average simulated yield for cereals per 50 cell is shown in Fig. 2a with the contribution to the total from rain-fed (Fig. 2b) and irrigated (Fig. 2c) land shown separately. The yields in kg ha−1are shown in Fig. S5, however since HYDE cropland fractions vary per cell, the yield per 50cell
gives a clearer impression of spatial variability in total yield amount. Rather than reporting VW partitioned into its green and blue component sources we partitioned VW into VW derived from rainfed and irrigated land. Yields from rainfed land derive only from green water whereas yields from irri-gated land incorporate blue water where there is a shortfall in green water to meet the evaporative demand (van Beek et al., 2011). Our simulations indicate that the most productive rainfed agricultural regions are located in present-day Spain, France, the Po Valley, western Turkey and the Fertile Cres-cent (present-day Syria, Iraq and Israel) (Fig. 2b). Irrigation agriculture is also widespread (Fig. 2c), with the largest ar-eas of irrigated agriculture located in Egypt, the Po Valley, southeastern Turkey, the Fertile Crescent and Spain. Rainfed agriculture accounts for 71.5 % of the total yield in the re-gion with irrigation accounting for the remaining 28.5 %. The kg ha−1yields (Fig. S5) are consistent with yield estimates based on Roman sources and yields prior to the agricultural revolution in Europe (Erdkamp, 2005; Goodchild, 2007).
[image:6.612.309.545.65.400.2]Lower than expected yields are calculated for Sicily and present-day Algeria and Tunisia related to what is known from historical sources about the productivity of these re-gions (Erdkamp, 2005). The low yields in these rere-gions are
Figure 2. Average cereal yield (tonne per 50cell). (a) Average cereal yield in tonnes per 50cell, calculated in PCR-GLOBWB and based on 52 years of climate forcing. The yields from rainfed (b) and ir-rigated (c) agriculture are shown separately. See Fig. S5 for yield in kg ha−1. Yields are highest in irrigated regions where year-round supply of surface water allows for multi-cropping, which can take advantage of the seasons when temperatures for growth are optimal.
due to a probable underestimation of cropland fractions in the HYDE data set (Fig. S3b). HYDE provides estimates of cropland fractions and population concentration at 50 spa-tial resolution globally for the entire Holocene using land suitability algorithms and back-calculating from current pop-ulation and cropland distributions (Klein Goldewijk et al., 2011). Thus, it is not surprising that for certain regions crop-land fractions are inconsistent with historical accounts for the specific date of AD 200 (Fig. S3) (Klein Goldewijk and Ver-burg, 2013). For the purposes of this paper it was decided to use unadjusted HYDE grid-based estimates of cropland to transparently show our methodology.
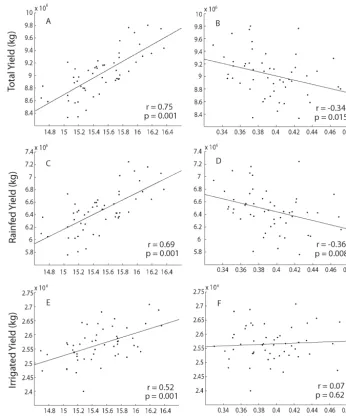
tem-Figure 3. Yield plotted against temperature and precipitation. Total yield (a and b) in the Mediterranean increases with increasing temperature
and decreases with increasing precipitation. The trend is strongest in regions where agriculture is rainfed (c and d). Irrigated regions (e and
f) also exhibit increased yields with increasing temperature whereas the impact of precipitation is negligible. The reduced yield under
higher precipitation is likely related to decreased temperatures under increased precipitation in most of the Mediterranean and thus lower evapotranspiration (Fig. S6). This indicates that the majority of the Mediterranean is temperature-limited for cereals.
perature and precipitation averaged over land cells in the Mediterranean region (25◦N, 46◦N and 10◦W, 45◦E). Each point represents a single year of climate forcing with tem-perature and precipitation plotted on thex-axis and yield on the y-axis. Under warmer temperatures, grain yield signif-icantly increased in both rainfed (p=0.001) and irrigated (p=0.001) regions (Fig. 3a, c, e). Somewhat counterintu-itively, yield significantly decreased in rainfed regions un-der increased precipitation (p=0.008) (Fig. 3d). No sig-nificant relation was found between precipitation and yields in irrigated regions (p=0.62) (Fig. 3f). Yield is calculated based on evapotranspiration, with warmer conditions
[image:7.612.125.472.66.483.2]Added to this, many of the regions with large-scale irrigation have very dry climates (Lionello, 2012) with the vast propor-tion of water resources coming from surface water sources.
Increased yield under warmer temperatures and decreased precipitation indicate that in most of the Mediterranean, grain yields are temperature limited and not water lim-ited. The spatial distribution of the correlation between cli-mate during the growing season and yield indicates that wa-ter is limiting only in very dry regions such as the south-ern Fertile Crescent, parts of North Africa and coastal re-gions (Fig. S7). Increased grain yields under higher tem-peratures were also found for Mediterranean climate con-ditions in Western Australia in simulations using the Agri-cultural Production Systems Simulator (APSIM)-N wheat model to predict the impact of changing temperature, pre-cipitation and CO2on yield (van Ittersum et al., 2003; Keat-ing et al., 2003; Ludwig and Asseng, 2006). In the southern part of the study area (>500 mm precipitation), wheat yields were predicted to increase with increasing temperature irre-spective of predicted changes in rainfall, whilst in the drier north (<350 mm precipitation) rainfall reduction was par-tially counteracted by increased temperatures (Ludwig and Asseng, 2006). It should be stressed that the response to cli-mate is very heterogeneous throughout the Mediterranean (Fig. S7). Nonetheless, as we will show, Mediterranean-scale changes are highly relevant at the smaller city-region scale in an integrated network such as the Virtual Water network of the Roman world.
3.2 Virtual water redistribution
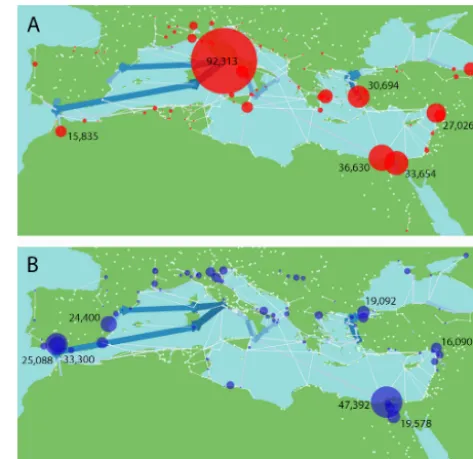
Rome is the largest importer of VW in our network with imports averaging 92 313 tonnes year−1 (Fig. 4a). Egypt is the largest exporter of virtual water, however much of this export is local with large quantities flowing to the densely populated Egyptian cities of Alexandria and Memphis with a proportion also flowing towards Italy (Fig. 4b). The largest flows of VW occur between eastern and southern Spain and Rome. There are also large flows between southeastern Italy and the densely populated region around the Bay of Naples. Other large flows occur along the Turkish Aegean Coast, within the Po Valley and locally in the region around An-tioch in present-day southeast Turkey. Although only 28.5 % of yield is from irrigated land, VW from irrigated agriculture accounts for 34 % of VW flow among nodes. The dispro-portionately large exports from irrigated land are owing to the location of irrigated cropland close to the coast or along rivers where transport is less costly compared with transport over land. Indeed, all large VW flows originate in areas close to the coast or a large river. Rome has by far the biggest VW demand followed by other large coastal cities such as Alexandria, Ephesus and Antioch (Fig. 4a).
[image:8.612.310.547.66.296.2]The node degree distribution of the VW redistribution work is shown in Fig. 5a. As with many real-world net-works the node degree distribution of our network exhibits a
Figure 4. Virtual water imports and exports (tonne grain year−1). The relative amount of VW imported (a) and exported (b) from each node is illustrated by the size of the nodes, whilst the associ-ated numbers show the average VW imported or exported each year expressed in tonnes of grain. The edge colour and thickness indi-cates the relative volume of VW flow between nodes. The largest flows are between eastern and southern Spain and Italy, locally within Egypt, from south-eastern Italy to western Italy and along the Aegean coast of Turkey. Rome is by far the largest importer of VW, followed by Alexandria and Memphis in Egypt, Ephesus on the west coast of Turkey, Antioch in south-eastern Turkey and Corinth in Greece.
Figure 5. Cost to import VW in relation to node degree. (a) The
node degree distribution of the virtual water redistribution network.
(b) Lower-degree nodes generally have higher costs to import VW
compared with high-degree nodes. For the highest-degree nodes, the cost to import is higher than nodes with an intermediate number of links as many of the highly connected nodes in our network are also ports or urban centres with high demand. Therefore nearby nodes are often depleted leading to the need to import from further away with an associated increase in cost. (c) For nodes with 1–4 links, import costs remain high irrespective of the level of demand. How-ever, for nodes with 5–8 links and 9–12 links, costs increase under increasing demand. 100 % demand represents the standard model simulations presented elsewhere in the paper.
that import cost is closely related to node degree, indepen-dent of the transport costs of edges connected to that node.
In a network where costs co-vary with distance, higher im-port costs for low-degree nodes arise because a node with few transport links has a higher chance of depleting neigh-bouring nodes compared with a high-degree node, assum-ing equal demand. Once neighbourassum-ing nodes are depleted, a VW-poor node must import from further away, thus increas-ing cost. However, as node degree increases it is less likely that all neighbouring nodes become depleted, which on av-erage will reduce import distance and costs. It is notable that for the highest-degree nodes, import costs are higher on av-erage (Fig. 5b). In network theory, highly connected nodes are known as hubs. Hub nodes are mostly located along the Mediterranean coast in our network (Scheidel, 2013). Konar et al. (2011) and Suweis et al. (2011) demonstrated that these hub nodes play a critical role in providing access for poorly connected nodes to the larger VW network. In Orbis, hub nodes are usually ports (for example the port node at Ostia near Rome) or urban centres. Thus the demand of hub nodes is in reality the sum of demand from many inland nodes or large local populations. Owing to the high demand levels of these hub nodes they often deplete all their neighbouring VW-rich nodes and must import from further away, thus in-creasing import costs.
Changes in import costs indicate how stressed our VW network of the Roman world is. For example, if total net-work cost is 0, then all regions have sufficient local water resources to meet the demands of the local population. If to-tal network cost>0 then local water resources in at least one city region are insufficient to meet the local population de-mand, meaning that VW import is required. To investigate the impact of increased stress on our network, we simulated VW redistribution across a stress gradient based on increases or decreases in population at each VW-poor node. We chose to only change populations at VW-poor nodes as these are generally representative of urban regions and therefore re-flect urban population growth during the late Republican and early Imperial era (Scheidel, 2001). Our analysis indicates that lower-degree nodes exhibit a negligible increase in cost as a result of increased demand (Fig. 5c). However, high-degree hub nodes exhibit an incremental increase in cost for increasing demand.
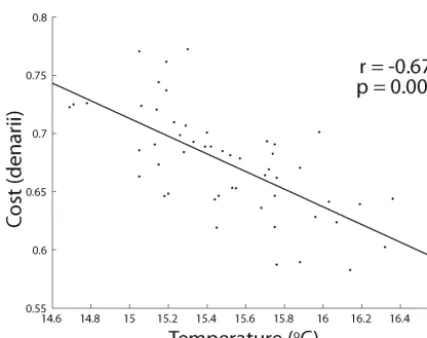
Figure 6. Cost of imports in relation to temperature. There is a
neg-ative relation between the cost to import VW and temperature be-cause yields increase on average in the Mediterranean with increas-ing temperature. Therefore competition for VW resources reduces and as a result, import distances decrease.
increase substantially for increases in demand. However, for hub nodes that are adapted to low costs, increases in demand can cause substantial increases in import cost. This pattern is only applicable in a network such as our VW network of the Roman world, where lower-degree nodes tend to be located inland (Fig. S8b) (Scheidel, 2013), which is also typical of the present-day global trade network for bulk goods (Limão and Venables, 2001).
We find that the total import cost of our water redistribu-tion network is closely linked to climate, in particular tem-perature (Fig. 6). During warm years, increased yields mean that many regions have sufficient local VW to meet demand so imports are unnecessary. However, even in the case where import is required, total demand will drop with the result that a VW-poor node competes with fewer VW-poor nodes for increased VW resources. Consequently, nearby surplus nodes are less likely to become depleted and imports oc-cur over shorter average distances. As stated, reconstructions of climate during the Roman period indicate that tempera-tures were anomalously warm (Chen et al., 2011; Davis et al., 2003; Ljungqvist, 2010; Wang et al., 2012), creating optimal conditions for the growth of grain. Therefore, the average transport distance of VW in the Empire was likely reduced (Fig. 6) compared with the subsequent, cooler Dark Ages cold period beginning around AD 400 (Bond et al., 2001; De-sprat et al., 2003; McDermott et al., 2001).
3.3 Roman water resource management
Taking Rome as an example, our simulations indicate that the majority of its VW was imported from Spain with Sar-dinia, southern France and Egypt also contributing substan-tial quantities (Fig. 4). However, historical sources indicate
that Egypt, North Africa and Sicily were the dominant ex-port regions of VW to Rome (Bransbourg, 2012; Erdkamp, 2005). As previously stated, grain yields are underestimated in HYDE for North Africa and Sicily, thus Spain supplants these regions as the primary exporters of VW to Rome in the western Mediterranean in our network. Additionally, our network solves VW transport along the most efficient routes with VW-poor nodes having perfect knowledge of the VW status of the closest VW-rich node. Thus import routes are constantly adapted to keep cost to a minimum. However, for the Roman period this is an unrealistic scenario as the effi-ciency of knowledge transfer varied based on distance, fre-quency of trade relations and so forth (Kessler and Temin, 2007). Probably Romans had little knowledge of yields in remote regions of the Empire until grain ships arrived in port (Rickman, 1980). If the cargo on incoming ships was below expectations then cities risked famine and potential violent unrest (Erdkamp, 2005). Therefore stable yields in exporting regions were particularly important to the Romans.
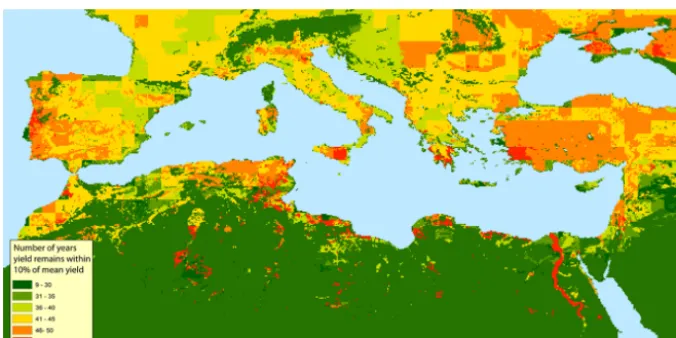
Examining the year-to-year variability in yield we can see that much of the eastern Empire likely had highly sta-ble yields, in particular Egypt. In the western Empire North Africa, Sicily and the Po Valley exhibited the most stable grain production (Fig. 7). The stability of yields in irrigated regions such as Egypt and the Po Valley was borne out of a year-round supply of surface water so that multi-cropping could take advantage of the seasons when temperatures for growth were optimal. Yields from rainfed agriculture were probably most stable in southwestern Turkey, the western Fertile Crescent, North Africa and Sicily. In these regions winter climate is relatively warm compared with Spain, Italy, France and the eastern Adriatic coast (Lionello, 2012). In ad-dition, winter climate in the eastern Mediterranean was quite stable owing to the reduced influence of Atlantic storm tracks compared with the northwestern Mediterranean (Lionello, 2012; Xoplaki et al., 2004). Although Spain and France could export large quantities of VW in many years, the reliability of yields were much less compared with the aforementioned regions, a disadvantage that was unacceptable in an era of inefficient information transfer (Kessler and Temin, 2007). The high productivity of Spain but low stability in yields is probably why its main exports during the Roman period were non-staple foods such as olive oil (Blázquez, 1992; Woolf, 1992).
Figure 7. The stability of yields over time. The map shows in how many years the total annual yield in each cell remains within 10 % of the
average yield for the same cell calculated over 52 years of climate forcing. In the Nile Valley, yields remain within 10 % of the average yield in all years, meaning that yields are exceptionally stable. Regions of northern Spain and northern France are relatively unstable with yields dropping below 10 % in at least 40 out of 52 years.
through trade that provided them with a stable food sup-ply despite the variable climate of the Mediterranean region. However, VW redistribution during the Roman period also facilitated populations in VW-poor regions, in particular ur-ban areas, to overshoot their ecohydrological carrying ca-pacities (Erdkamp, 2005; Garnsey, 1988; Rickman, 1980). The population growth and increased urbanization during the Late Republican and Early Imperial periods (Bowman and Wilson, 2011; Scheidel, 2001) likely pushed the Em-pire closer to the limits of available freshwater resources and reduced resilience to climatic variability (D’Odorico et al., 2010; Garnsey, 1988). In addition, our simulations using a cost–distance-based network show that increased demand arising from urbanization caused an increase in average im-port distance and an associated increase in imim-port costs. It is plausible that lower water resource redundancy and in-creased import costs may have been a contributing factor to the third century crisis which followed a period of popula-tion growth, urbanizapopula-tion and trade in the second century AD (Parker, 1992; Scheidel, 2010).
3.4 Present-day implications
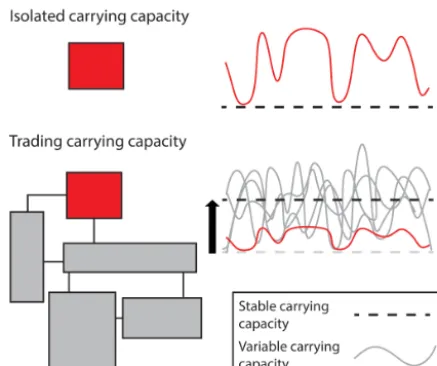
Our analysis uncovered a number of important features that have general implications for virtual water trade un-der spatially and temporally variable environmental condi-tions. For example, provided there are enough trading re-gions with temporally heterogeneous yields, virtual water trade increases carrying capacity without an increase in wa-ter resource use in any of the trading regions (Fig. 8). Vir-tual water trade is therefore a highly efficient method of providing resilience to interannual climate variability. How-ever, by increasing the carrying capacity of trading regions as well as allowing VW-poor regions to overshoot their
lo-cal ecohydrologilo-cal carrying capacities (Fig. 8) (Barnaby, 2009; D’Odorico et al., 2010), virtual water trade promotes population growth and urbanization (Hubacek et al., 2009). Therefore, the short-term resilience that VW trade provides is eroded in the long term as population growth and urbaniza-tion pushes trading societies towards a global carrying capac-ity. The present-day trend of urbanization (United Nations, 2012) means that the global society is becoming increas-ingly dependent on trade to ensure food supplies. As pop-ulation continues to grow there is less space to adapt to yield perturbations that may arise owing to anthropogenic climate change (D’Odorico et al., 2010). The globalized population is therefore in danger of becoming vulnerable to climate per-turbations in the same way that an isolated population is. However, unlike an isolated population, the globalized civ-ilization is also vulnerable to perturbations in the trade net-work itself (De Benedictis and Tajoli, 2011; Grubesic et al., 2008).
Figure 8. Conceptual figure illustrating the impact of trade on
carry-ing capacity in a variable environment. Carrycarry-ing capacities are vari-able over time owing to the impact of interannual climate variability on yields. In an isolated society populations must remain below the climate-forced carrying capacity to avoid famine. In societies with trade, the carrying capacity becomes the average carrying capacity of all trading regions. Thus, where there is a sufficient number of trading regions with heterogeneous environments, carrying capacity is increased without an increase in resource use in any of the trading societies. Trade even allows certain regions to attain carrying capac-ities well above their local ecohydrological constraints, thus facil-itating urbanization. However, under continued population growth, the resilience to climate variability provided by trade is eroded as populations approach a new global carrying capacity. In addition, urbanization means that regions become vulnerable to perturbations in the trade network as well as perturbations arising from crop fail-ure. Carrying capacities are smoothed to illustrate the dampening effect of food storage.
bulk goods have become increasingly distance sensitive in the latter part of the 20th and early 21st century with approx-imately half of world trade occurring between trade partners less than 3000 km apart (Berthelon and Freund, 2008). The reasons for a stronger relation between cost and distance in recent decades are not straightforward (Berthelon and Fre-und, 2008), but it is likely that future increases in fuel costs will strengthen the trend further (Curtis, 2009). Therefore, the “struggle against distance” (Braudel, 1995) which was a characteristic of preindustrial trade remains a central con-straint for present-day VW redistribution.
As population growth and urbanization (United Na-tions, 2012) continues to reduce water resource redundancy (D’Odorico et al., 2010), our analysis demonstrates that an associated increase in import distance will be unevenly dis-tributed throughout the global VW network, with hub nodes experiencing the greatest increases in import cost. How such costs will actually be distributed throughout the global trade network are complicated by socioeconomic factors such as protectionism (Carr et al., 2012b; Messerlin, 2011).
There-fore, research on VW trade should continue to explore the two-way feedbacks between society and their environment (Sivapalan et al., 2012) because socioeconomic forcings are perhaps the primary driving force of VW trade (Hoekstra and Chapagain, 2008). However, cost–distance-based networks provide an additional avenue for understanding the underly-ing physical and environmental constraints influencunderly-ing VW trade. In addition, the stability of cost–distance relations con-tributes to improving projections as well as identifying the most economical VW trade routes, not just in terms of sav-ing water but also in terms of fossil fuel use.
4 Conclusions
The question of what brought about the fall of the Roman Empire is one that has occupied Roman scholars for cen-turies (Gibbon, 1776). However, an equally relevant question is what enabled the Roman civilization to persist for so long in a region of highly variable climate (Lionello, 2012) and associated variability in agricultural yields upon which their economy and survival depended (Erdkamp, 2005; Garnsey, 1988; Rickman, 1980). Our findings show that the majority of the Mediterranean is temperature limited for the growth of grain. Given that the height of the Roman civilization co-incided with centuries of anomalously warm climate (Bond et al., 2001; Desprat et al., 2003; Ljungqvist, 2010), con-ditions for the growth of grain were likely optimal. How-ever, higher-frequency climate variability has been demon-strated to have catastrophic impacts for other past civiliza-tions where water resources were not spatially integrated to the extent of the Roman Empire (de Menocal, 2001; Weiss et al., 1993). The Roman’s ability to link heterogeneous en-vironments of the Mediterranean using VW trade meant that they could offset deficits in one region with surpluses in an-other (Kessler and Temin, 2007). In an era before the inven-tion of the combusinven-tion engine, the Mediterranean played a critical role because it enabled the spatial integration of the Empire through shipping (Braudel, 1995; Jones, 1986; Schei-del, 2013). The linked-heterogeneity of the Roman Empire undoubtedly increased their resilience to climate variability and contributed to the longevity of their civilization (Gibbon, 1776; Scheidel, 2013). The importance of VW redistribution in the Mediterranean as a buffer to climate variability is illus-trated in the writings of Pliny the Younger (AD 98–AD 117) in Erdkamp (2005): “Even the heavens can never prove so kind as to enrich and favour every land alike. But he [the em-peror] can so join east and west by convoys that those peo-ple who offer and those who need supplies . . . appreciate . . . having one master to serve.”
en-abled regions to overshoot their local ecohydrological carry-ing capacities (Barnaby, 2009; D’Odorico et al., 2010). The associated increase in water resource exploitation pushed the Empire closer to the boundary of its freshwater resources, thus eroding its long-term resilience to crop failures. In ad-dition, growing urban demand led to an increased reliance on VW trade, an increase in average import distances and an associated increase in import costs. The combination of re-duced resilience to crop failures and increased import costs may have contributed to the third century crisis following a peak in population and urbanization in the second century AD. Given that present-day trade costs in bulk, staple foods continue to co-vary with distance, the “struggle against dis-tance” that typified preindustrial trade will continue to be a constraint on future VW trade. Just as with the Roman Em-pire, present-day population growth continues to push civi-lization closer to the boundary of our global water resources and erode our resilience to crop failure (Bogardi et al., 2013). In addition, rapid urbanization means we are becoming in-creasingly reliant on VW trade, meaning that we are not just vulnerable to crop failures but perturbations in the VW trade network itself.
The Supplement related to this article is available online at doi:10.5194/hess-11-5025-2014-supplement.
Author contributions. B. J. Dermody, R. P. H. van Beek, E. Meeks,
K. K. Goldewijk, W. Scheidel, Y. van der Velde, M. F. P. Bierkens, M. J. Wassen, S. C. Dekker wrote the paper. B. J. Dermody, R. P. H. van Beek, E. Meeks, K. K. Goldewijk, Y. van der Velde, M. F. P. Bierkens, S. C. Dekker designed the experiments. W. Schei-del, E. Meeks and K. K. Goldewijk contributed data. B. J. Dermody and R. P. H. van Beek carried out the experiments. B. J. Dermody prepared the paper with contributions from all co-authors.
Acknowledgements. Thanks to David Bijl and Gurvan Cabon for
thought-provoking discussions. The authors would also like to thank the anonymous reviewers for their valuable comments and suggestions to improve the manuscript.
Edited by: J. Liu
References
Allan, J. A.: Virtual Water: A Strategic Resource Global So-lutions to Regional Deficits, Ground Water, 36, 545–546, doi:10.1111/j.1745-6584.1998.tb02825.x, 1998.
Allen, R. G., Pereira, L. S., Raes, D., and Smith, M.: Crop evapotranspiration-Guidelines for computing crop water requirements-FAO Irrigation and drainage paper 56, FAO Rome, 300, 6541, 1998.
Barker, G.: Farming the Desert: Synthesis, UNESCO Publishing Department of Antiquities, Paris, France, 1996.
Barnaby, W.: Do nations go to war over water?, Nature, 458, 282– 283, doi:10.1038/458282a, 2009.
van Beek, L. P. H. and Bierkens, M. F. P.: The Global Hydrologi-cal Model PCR-GLOBWB: Conceptualization, Parameterization and Verification, Utrecht University, 2009.
van Beek, L. P. H., Wada, Y., and Bierkens, M. F. P.: Global monthly water stress: 1. Water balance and water availability, Water Re-sour. Res., 47, W07517, doi:10.1029/2010WR009791, 2011. Beltrán Lloris, F.: An Irrigation Decree from Roman Spain:
The Lex Rivi Hiberiensis, J. Roman Stud., 96, 147–197, doi:10.3815/000000006784016242, 2006.
De Benedictis, L. and Tajoli, L.: The World Trade Network, The World Economy, 34, 1417–1454, doi:10.1111/j.1467-9701.2011.01360.x, 2011.
Berthelon, M. and Freund, C.: On the conservation of dis-tance in international trade, J. Int. Econ., 75, 310–320, doi:10.1016/j.jinteco.2007.12.005, 2008.
Blázquez, J. M.: The Latest Work on the Export of Baetican Olive Oil to Rome and the Army, Greece Rome Second Ser., 39, 173– 188, doi:10.1017/S0017383500024153, 1992.
Bogardi, J. J., Fekete, B. M., and Vörösmarty, C. J.: Planetary boundaries revisited: a view through the ‘water lens’, Curr. Opin. Environ. Sustain., 5, 581–589, doi:10.1016/j.cosust.2013.10.006, 2013.
Bond, G., Kromer, B., Beer, J., Muscheler, R., Evans, M. N., Showers, W., Hoffmann, S., Lotti-Bond, R., Hajdas, I., and Bonani, G.: Persistent Solar Influence on North At-lantic Climate During the Holocene, Science, 294, 2130–2136, doi:10.1126/science.1065680, 2001.
Bowman, A. and Wilson, A.: Settlement, Urbanization, and Popu-lation, Oxford University Press, Oxford, England, 2011. Bransbourg, G.: Rome and the Economic Integration of Empire,
In-stitute for the study of the ancient world, New York, USA, 2012. Braudel, F.: A History of Civilizations, Penguin Books, New York,
USA, 1995.
Büntgen, U., Tegel, W., Nicolussi, K., McCormick, M., Frank, D., Trouet, V., Kaplan, J. O., Herzig, F., Heussner, K.-U., Wanner, H., Luterbacher, J., and Esper, J.: 2500 Years of European Cli-mate Variability and Human Susceptibility, Science, 331, 578– 582, doi:10.1126/science.1197175, 2011.
Butzer, K. W., Mateu, J. F., Butzer, E. K., and Kraus, P.: Irrigation agrosystems in eastern Spain: Roman or Islamic origins?, Ann. Assoc. Am. Geogr., 75, 479–509, 1985.
Carr, J. A., D’Odorico, P., Laio, F., and Ridolfi, L.: On the temporal variability of the virtual water network, Geophys. Res. Lett., 39, L06404, doi:10.1029/2012GL051247, 2012a.
Carr, J., D’Odorico, P., Laio, F., Ridolfi, L., and Seekell, D.: In-equalities in the networks of virtual water flow, Eos Trans. AGU, 93, 309–310, doi:10.1029/2012EO320001, 2012b.
Chandler, T.: Four Thousand Years of Urban Growth: An Historical Census, Mellen House publishers, Wales, 1987.
Chen, J.: Rapid urbanization in China: A real challenge to soil protection and food security, CATENA, 69, 1–15, doi:10.1016/j.catena.2006.04.019, 2007.
eastern Mediterranean, Quaternary Sci. Rev., 30, 3880–3891, doi:10.1016/j.quascirev.2011.09.024, 2011.
Columella, L. J. M.: de Re Rustica and de Arboribus, avail-able at: http://penelope.uchicago.edu/Thayer/E/Roman/Texts/ Columella/home.html (last access: 20 October 2011), 70AD. Cornell, S., Costanza, R., Sörlin, S., and van der Leeuw,
S.: Developing a systematic ‘science of the past’ to cre-ate our future, Glob. Environ. Change, 20, 426–427, doi:10.1016/j.gloenvcha.2010.01.005, 2010.
Curtis, F.: Peak globalization: Climate change, oil de-pletion and global trade, Ecol. Econ., 69, 427–434, doi:10.1016/j.ecolecon.2009.08.020, 2009.
Dalin, C., Konar, M., Hanasaki, N., Rinaldo, A., and Rodriguez-Iturbe, I.: Evolution of the global virtual wa-ter trade network, Proc. Natl. Acad. Sci., 109, 5989–5994, doi:10.1073/pnas.1203176109, 2012a.
Dalin, C., Suweis, S., Konar, M., Hanasaki, N., and Rodriguez-Iturbe, I.: Modeling past and future structure of the global vir-tual water trade network, Geophys. Res. Lett., 39, L24402, doi:10.1029/2012GL053871, 2012b.
Davis, B. A. S., Brewer, S., Stevenson, A. C., and Guiot, J.: The temperature of Europe during the Holocene recon-structed from pollen data, Quaternary Sci. Rev., 22, 1701–1716, doi:10.1016/S0277-3791(03)00173-2, 2003.
de Menocal, P. B.: Cultural Responses to Climate Change During the Late Holocene, Science, 292, 667–673, doi:10.1126/science.1059827, 2001.
Dermody, B. J., de Boer, H. J., Bierkens, M. F. P., Weber, S. L., Wassen, M. J., and Dekker, S. C.: A seesaw in Mediterranean precipitation during the Roman Period linked to millennial-scale changes in the North Atlantic, Clim. Past, 8, 637–651, doi:10.5194/cp-8-637-2012, 2012.
Desprat, S., Sánchez Goñi, M. F., and Loutre, M.-F.: Revealing cli-matic variability of the last three millennia in northwestern Iberia using pollen influx data, Earth Planet. Sci. Lett., 213, 63–78, doi:10.1016/S0012-821X(03)00292-9, 2003.
D’Odorico, P., Laio, F., and Ridolfi, L.: Does globalization of water reduce societal resilience to drought?, Geophys. Res. Lett., 37, L13403, doi:10.1029/2010GL043167, 2010.
Doorenbos, J. and A.H. Kassam: Yield response to water, Food and Agriculture Organisation of the United Nations, Rome, 1979. Elshafei, Y., Sivapalan, M., Tonts, M., and Hipsey, M. R.: A
pro-totype framework for models of socio-hydrology: identifica-tion of key feedback loops and parameterisaidentifica-tion approach, Hy-drol. Earth Syst. Sci., 18, 2141–2166, doi:10.5194/hess-18-2141-2014, 2014.
van Emmerik, T. H. M., Li, Z., Sivapalan, M., Pande, S., Kan-dasamy, J., Savenije, H. H. G., Chanan, A., and Vigneswaran, S.: Socio-hydrologic modeling to understand and mediate the competition for water between agriculture development and en-vironmental health: Murrumbidgee River basin, Australia, Hy-drol. Earth Syst. Sci., 18, 4239–4259, doi:10.5194/hess-18-4239-2014, 2014.
Erdkamp, P.: The grain market in the Roman Empire: a social, po-litical and economic study, Cambridge University Press, Cam-bridge, England, 2005.
Fader, M., Rost, S., Müller, C., Bondeau, A., and Gerten, D.: Virtual water content of temperate cereals and maize:
Present and potential future patterns, J. Hydrol., 384, 218–231, doi:10.1016/j.jhydrol.2009.12.011, 2010.
Fox, H. S. A.: The Alleged Transformation from Two-field to Three-field Systems in Medieval England, Econ. Hist. Rev., 39, 526– 548, doi:10.1111/j.1468-0289.1986.tb01255.x, 1986.
de Fraiture, C., Cai, X., Amarasinghe, I., Rosegrant, M., and Molden, D.: Does international cereal trade save water?: the im-pact of virtual water trade on global water use, IWMI, Colombo, Sri Lanka, 2004.
Frier, B.: Roman Life Expectancy: Ulpian’s Evidence, Harv. Stud. Class. Philol., 86, 213–251, doi:10.2307/311195, 1982. Garnsey, P.: Famine and food supply in the Graeco-Roman world:
responses to risk and crisis., Cambridge University Press, Cam-bridge, England, 1988.
Gibbon, E.: The History of the Decline and Fall of the Roman Em-pire, edited by: Strahan, W. and Cadell, T., London, England, 1776.
Godfray, H. C. J., Beddington, J. R., Crute, I. R., Had-dad, L., Lawrence, D., Muir, J. F., Pretty, J., Robinson, S., Thomas, S. M., and Toulmin, C.: Food Security: The Chal-lenge of Feeding 9 Billion People, Science, 327, 812–818, doi:10.1126/science.1185383, 2010.
Goodchild, H.: Modelling Roman agricultural production in the Middle Tiber Valley, Central Italy, available at: http://etheses. bham.ac.uk/175/ (last access: 19 December 2011), 2007. Grubesic, T. H., Matisziw, T. C., Murray, A. T., and Snediker, D.:
Comparative Approaches for Assessing Network Vulnerability, Int. Reg. Sci. Rev., 31, 88–112, doi:10.1177/0160017607308679, 2008.
Hagemann, S., Botzet, M., Dümenil, L., and Machenhauer, B.: Derivation of Global GCM Boundary Conditions from 1 Km Land Use Satellite Data, Max-Planck-Institut für Meteorologie, 1999.
Hanasaki, N., Inuzuka, T., Kanae, S., and Oki, T.: An es-timation of global virtual water flow and sources of wa-ter withdrawal for major crops and livestock products us-ing a global hydrological model, J. Hydrol., 384, 232–244, doi:10.1016/j.jhydrol.2009.09.028, 2010.
Hoekstra, A. Y. and Chapagain, A. K.: Globalization of water: Shar-ing the planet’s freshwater resources, John Wiley & Sons, Hobo-ken, New Jersey, 2008.
Horden, P. and Purcell, N.: The corrupting sea: a study of Mediter-ranean history, Blackwell., Malden, Massachusetts, 2000. Houston, G.: Ports in Perspective: Some Comparative Materials on
Roman Merchant Ships and Ports, Am. J. Archaeol., 92, 553– 564, 1988.
Hubacek, K., Guan, D., Barrett, J., and Wiedmann, T.: Environmen-tal implications of urbanization and lifestyle change in China: Ecological and Water Footprints, J. Clean. Prod., 17, 1241–1248, doi:10.1016/j.jclepro.2009.03.011, 2009.
Hummels, D.: Transportation Costs and International Trade in the Second Era of Globalization, J. Econ. Perspect., 21, 131–154, doi:10.1257/jep.21.3.131, 2007.
van Ittersum, M. K., Howden, S. M., and Asseng, S.: Sensitivity of productivity and deep drainage of wheat cropping systems in a Mediterranean environment to changes in CO2,
Jones, A. H. M.: The later Roman Empire, 284-602: a social economic and administrative survey, Johns Hopkins University Press, Baltimore, Md., 1986.
Keating, B., Carberry, P., Hammer, G., Probert, M., Robertson, M., Holzworth, D., Huth, N., Hargreaves, J. N., Meinke, H., Hochman, Z., McLean, G., Verburg, K., Snow, V., Dimes, J. P., Silburn, M., Wang, E., Brown, S., Bristow, K. L., Asseng, S., Chapman, S., McCown, R. L., Freebairn, D. M., and Smith, C. J.: An overview of APSIM, a model designed for farming systems simulation, Eur. J. Agron., 18, 267–288, doi:10.1016/S1161-0301(02)00108-9, 2003.
Kessler, D. and Temin, P.: The organization of the grain trade in the early Roman Empire, Econ. Hist. Rev., 60, 313–332, doi:10.1111/j.1468-0289.2006.00360.x, 2007.
Klein Goldewijk, K. and Verburg, P. H.: Uncertainties in global-scale reconstructions of historical land use: an illustration using the HYDE data set, Landsc. Ecol., 28, 861–877, doi:10.1007/s10980-013-9877-x, 2013.
Klein Goldewijk, K., Beusen, A., van Drecht, G., and de Vos, M.: The HYDE 3.1 spatially explicit database of human-induced global land-use change over the past 12,000 years, Glob. Ecol. Biogeogr., 20, 73–86, doi:10.1111/j.1466-8238.2010.00587.x, 2011.
Konar, M., Dalin, C., Suweis, S., Hanasaki, N., Rinaldo, A., and Rodriguez-Iturbe, I.: Water for food: The global vir-tual water trade network, Water Resour. Res., 47, W05520, doi:10.1029/2010WR010307, 2011.
Konar, M., Hussein, Z., Hanasaki, N., Mauzerall, D. L., and Rodriguez-Iturbe, I.: Virtual water trade flows and savings un-der climate change, Hydrol. Earth Syst. Sci., 17, 3219–3234, doi:10.5194/hess-17-3219-2013, 2013.
Leemans, R.: Global data sets collected and compiled by the Bio-sphere Project, Austria, 1990.
Leemans, R.: Global Holdridge Life Zone Classifications., Digi-tal Raster Data on a 0.5-degree Cartesian Orthonormal Geode-tic (lat/long) 360×720 grid, NOAA National Geophysical Data Center, Boulder, CA, 1992.
van der Leeuw, S.: The Archaeomedes project: understanding the natural and anthropogenic causes of land degradation and de-sertification in the Mediterranean basin: research results, Office for Official Publications of the European Communities, Luxem-bourg, 1998.
van der Leeuw, S., Costanza, R., Aulenbach, S., Brewer, S., Burek, M., Cornell, S., Crumley, C., Dearing, J. A., Downy, C., Graum-lich, L. J., Heckbert, S., Hegmon, M., Hibbard, K., Jackson, S. T., Kubiszewski, I., Sinclair, P., Sörlin, S., and Steffen, W.: To-ward an Integrated History to Guide the Future, Ecol. Soc., 16, doi:10.5751/ES-04341-160402, 2011.
Lewis, T. G.: Network Science: Theory and Applications, John Wi-ley & Sons, Hoboken, New Jersey, 2011.
Limão, N. and Venables, A. J.: Infrastructure, Geographical Disad-vantage, Transport Costs, and Trade, World Bank Econ. Rev., 15, 451–479, doi:10.1093/wber/15.3.451, 2001.
Lionello, P.: The Climate of the Mediterranean Region, Elsevier, 2012.
Liu, J. and Savenije, H. H. G.: Food consumption patterns and their effect on water requirement in China, Hydrol. Earth Syst. Sci., 12, 887–898, doi:10.5194/hess-12-887-2008, 2008.
Liu, Y., Tian, F., Hu, H., and Sivapalan, M.: Socio-hydrologic perspectives of the co-evolution of humans and water in the Tarim River basin, Western China: the Taiji-Tire model, Hy-drol. Earth Syst. Sci., 18, 1289–1303, doi:10.5194/hess-18-1289-2014, 2014.
Ljungqvist, F. C.: A new reconstruction of temperature variabil-ity in the extra-tropical northern hemisphere during the last two millennia, Geogr. Ann. Ser. Phys. Geogr., 92, 339–351, doi:10.1111/j.1468-0459.2010.00399.x, 2010.
Ludwig, F. and Asseng, S.: Climate change impacts on wheat pro-duction in a Mediterranean environment in Western Australia, Agr. Syst., 90, 159–179, doi:10.1016/j.agsy.2005.12.002, 2006. Mazoyer, M. and Roudart, L.: A History of World Agriculture:
From the Neolithic Age to the Current Crisis, Earthscan, 2006. McDermott, F., Mattey, D. P., and Hawkesworth, C.:
Centennial-Scale Holocene Climate Variability Revealed by a High-Resolution Speleothemδ18O Record from SW Ireland, Science, 294, 1328–1331, doi:10.1126/science.1063678, 2001.
Meeks, E.: Modeling Transportation in the Roman World: Implications for World Systems, Leonardo, 46, 278–278, doi:10.1162/LEON_a_00574, 2013.
Messerlin, P.: Climate, Trade and Water: A ‘Grand Coali-tion’?, World Econ., 34, 1883–1910, doi:10.1111/j.1467-9701.2011.01419.x, 2011.
Ngo-Duc, T., Polcher, J., and Laval, K.: A 53-year forcing data set for land surface models, J. Geophys. Res.-Atmos., 110, D06116, doi:10.1029/2004JD005434, 2005.
Olson, J. S.: Global ecosystem framework-definitions, Internal Re-port, USGS EROS Data Center, Sioux Falls, SD, 1994a. Olson, J. S.: Global ecosystem framework-translation strategy,
In-ternal Report, USGS EROS Data Center, Sioux Falls, SD, 1994b. Parker, A. J.: Ancient shipwrecks of the Mediterranean and Roman
Provinces, Oxford: Tempus Reparatum, 1992.
Portmann, F. T.: Global estimation of monthly irrigated and rainfed crop areas on a 5 arc-minute grid, Johann Wolfgang Goethe-Univ., available at: http://publikationen.ub.uni-frankfurt. de/frontdoor/index/index/docId/23013 (last access: 7 January 2014), 2008.
Reale, O. and Dirmeyer, P.: Modeling the effects of vegetation on Mediterranean climate during the Roman Classical Period: Part I: Climate history and model sensitivity, Glob. Planet. Change, 25, 163–184, doi:10.1016/S0921-8181(00)00002-3, 2000. Reale, O. and Shukla, J.: Modeling the effects of vegetation
on Mediterranean climate during the Roman Classical Period: Part II. Model simulation, Glob. Planet. Change, 25, 185–214, doi:10.1016/S0921-8181(00)00003-5, 2000.
Rickman, G. E.: The Grain Trade under the Roman Empire, Mem. Am. Acad. Rome, 36, 261–275, doi:10.2307/4238709, 1980. Rockström, J., Steffen, W., Noone, K., Persson, Å., Chapin, F. S.,
Lambin, E. F., Lenton, T. M., Scheffer, M., Folke, C., Schellnhu-ber, H. J., Nykvist, B., de Wit, C.A., Hughes, T., van der Leeuw, S., Rodhe, H., Sörlin, S., Snyder, P. K., Costanza, R., Svedin, U., Falkenmark, M., Karlberg, L., Corell, R. W., Fabry, V. J., Hansen, J., Walker, B., Liverman, D., Richardson, K., Crutzen, P., and Foley, J. A.: A safe operating space for humanity, Nature, 461, 472–475, doi:10.1038/461472a, 2009.
Scheidel, W.: Approaching the Roman economy, Stanford Univer-sity, 2010.
Scheidel, W.: The Shape of the Roman World, SSRN Scholarly Pa-per, Social Science Research Network, Rochester, NY, 2013. Schmidhuber, J. and Tubiello, F. N.: Global food security
un-der climate change, Proc. Natl. Acad. Sci., 104, 19703–19708, doi:10.1073/pnas.0701976104, 2007.
Shi, J., Liu, J., and Pinter, L.: Recent evolution of China’s virtual water trade: analysis of selected crops and considerations for pol-icy, Hydrol. Earth Syst. Sci., 18, 1349–1357, doi:10.5194/hess-18-1349-2014, 2014.
Shiklomanov, I. A.: Appraisal and Assessment of World Water Resources, Water Int., 25, 11–32, doi:10.1080/02508060008686794, 2000.
Sivapalan, M., Savenije, H. H. G., and Blöschl, G.: Socio-hydrology: A new science of people and water, Hydrol. Process., 26, 1270–1276, doi:10.1002/hyp.8426, 2012.
Suweis, S., Konar, M., Dalin, C., Hanasaki, N., Rinaldo, A., and Rodriguez-Iturbe, I.: Structure and controls of the global vir-tual water trade network, Geophys. Res. Lett., 38, L10403, doi:10.1029/2011GL046837, 2011.
Suweis, S., Rinaldo, A., Maritan, A., and D’Odorico, P.: Water-controlled wealth of nations, Proc. Natl. Acad. Sci., 110, 4230– 4233, doi:10.1073/pnas.1222452110, 2013.
Temin, P.: The Roman Market Economy, Princeton University Press, 2012.
Torell, L. A., Libbin, J. D., and Miller, M. D.: The Market Value of Water in the Ogallala Aquifer, Land Econ., 66, 163–175, doi:10.2307/3146366, 1990.
United Nations: World Urbanization Prospects, United Nations, De-partment of Economic and Social Affairs, Population Division, New York, 2012.
Wada, Y., van Beek, L. P. H., Viviroli, D., Dürr, H. H., Weingartner, R., and Bierkens, M. F. P.: Global monthly water stress: 2. Water demand and severity of water stress, Water Resources Research, 47, W07518, doi:10.1029/2010WR009792, 2011.
Wang, T., Surge, D., and Mithen, S.: Seasonal temperature vari-ability of the Neoglacial (3300–2500 BP) and Roman Warm Period (2500–1600 BP) reconstructed from oxygen isotope ra-tios of limpet shells (Patella vulgata), Northwest Scotland, Palaeogeogr. Palaeoclimatol. Palaeoecol., 317–318, 104–113, doi:10.1016/j.palaeo.2011.12.016, 2012.
Weiss, H., Courty, M.-A., Wetterstrom, W., Guichard, F., Senior, L., Meadow, R., and Curnow, A.: The Genesis and Collapse of Third Millennium North Mesopotamian Civilization, Science, 261, 995–1004, doi:10.1126/science.261.5124.995, 1993. White, K. D.: Fallowing, Crop Rotation, and Crop Yields in Roman
Times, Agric. Hist., 44, 281–290, 1970.
Wilensky, U.: NetLogo, available at: http://ccl.northwestern.edu/ netlogo/, Center for Connected Learning and Computer-Based Modeling, Northwestern University, Evanston, IL, 1999. Wilson, A. I.: Water Management and Usage in Roman North
Africa: A Social and Technological Study, University of Oxford, 1997.
Woolf, G.: Imperialism, empire and the integration of the Roman economy, World Archaeol., 23, 283–293, doi:10.1080/00438243.1992.9980180, 1992.
Xoplaki, E., Gonzaleaz-Rouco, J. F., Luterbacher, J., and Wanner, H.: Wet season Mediterranean precipitation variability: influence of large-scale dynamics and trends, Clim. Dynam., 23, 63–78, doi:10.1007/s00382-004-0422-0, 2004.
Yang, H. and Zehnder, A.: China’s regional water scarcity and im-plications for grain supply and trade, Environ. Plan. A, 33, 79– 96, 2001.
Zhao, Q., Liu, J., Khabarov, N., Obersteiner, M., and Westphal, M.: Impacts of climate change on virtual water content of crops in China, Ecol. Info., 19, 26–34, doi:10.1016/j.ecoinf.2013.12.005, 2014.