Hydrol. Earth Syst. Sci., 11, 1361–1372, 2007 www.hydrol-earth-syst-sci.net/11/1361/2007/ © Author(s) 2007. This work is licensed under a Creative Commons License.
Hydrology and
Earth System
Sciences
Development of a window correlation matching method for
improved radar rainfall estimation
T. Piman, M. S. Babel, A. Das Gupta, and S. Weesakul
Water Engineering and Management, Asian Institute of Technology, Pathumthani, Thailand Received: 13 December 2006 – Published in Hydrol. Earth Syst. Sci. Discuss.: 1 March 2007 Revised: 14 May 2007 – Accepted: 23 May 2007 – Published: 7 June 2007
Abstract. The present study develops a method called window correlation matching method (WCMM) to reduce collocation and timing errors in matching pairs of radar measured reflectivity, Ze, and gauge measured rainfall
in-tensity, R, for improving the accuracy of the estima-tion of Ze−R relationships. This method was compared
with the traditional matching method (TMM), the proba-bility matching method (PMM) and the window probabil-ity matching method (WPMM). The calibrated relationship Ze=18.05R1.45obtained from 7×7 km of space window and
both present and 5 min previous time of radar observation for time window (S77T5) produces the best results for radar rain-fall estimates for orographic rain over the Mae Chaem Water-shed in the north of Thailand. The comparison shows that the Ze−Rrelationship obtained from WCMM provide more
ac-curacy in radar rainfall estimates as compared with the other three methods. The Ze−R relationships estimated using
TMM and PMM provide large overestimation and underesti-mation, respectively, of mean areal rainfall whereas WPMM slightly underestimated the mean areal rainfall. Based on the overall results, it can be concluded that WCMM can reduce collocation and timing errors inZe−R pairs matching and
improve the estimation ofZe−Rrelationships for radar
rain-fall. WCMM is therefore a promising method for improved radar-measured rainfall, which is an important input for hy-drological and environmental modeling and water resources management.
1 Introduction
Rainfall is measured based on three sensors- rain gauge, weather radar and satellite. Rain gauges are traditionally used for measuring rainfall at ground level. Gauge-measured Correspondence to: T. Piman
rainfall is often regarded as the true or reference rainfall. However, inaccurate rainfall estimates based on rain gauges are due to inadequate spatial coverage or configuration and inadequate gauge density especially in mountainous regions (Borga, 2002). Satellites are an attractive alternative to ob-serve rainfall at a global scale from space with large spa-tial and temporal resolution. However, it is difficult to apply satellite rainfall in small scale basins (less than 103km2)and in real time operation (Linsley et al., 1988; Collier, 1996). In addition, the accuracy of satellite rainfall estimation de-creases when the time scale is reduced (i.e., from monthly to daily to sub-daily). Weather radar overcomes some of the disadvantages associated with rain gauges and satellites as it provides a rain field with high spatial and temporal resolution and large areal coverage. Also, it measures rainfall closer to the ground level than the satellite. Application of radar mea-sured rainfall in hydrological and environmental modeling, including real-time hydrological forecasting, has become an active area of research by hydrologists (Collinge and Kirby, 1987; Bell and Moore, 1998; Sun et al., 2000; Vieux, 2003). In measuring rainfall by radar, Z−R relationships are widely used to convert radar measured reflectivity to rainfall intensity, hence the accuracy of the estimation ofZ−R rela-tionship is important (Rosenfeld et al., 1993; Collier, 1996; Atlas et al., 1997). The true radar reflectivity (Z), which can be measured by distrometer, is determined based on the drop size distribution (DSD) of rainfall and is related to rain-fall intensity (R)to estimate the trueZ−Rrelationship (At-las, 1964; Battan, 1973). However, non-availability of rain-drop size distribution information restricts the determination of the trueZ−Rrelationship based on DSD.
Calheiros and Zawadzki (1987) and Rosenfeld et al. (1990) applied a regression analysis technique to deter-mine the relationship of synchronous datasets between mea-sured rainfall intensity by rain gauge and meamea-sured or ef-fective reflectivity by weather surveillance radar (Ze)at the
pixel over the rain gauge (defined as the traditional matching
method, TMM, in this paper). However, in reality perfect synchronization betweenZe andR is unachievable, except
at the closest range and nearest to the ground. The non-synchronousZe−R pairs are due to: 1) the large
discrep-ancy between the sample volume of the rain gauge and the radar, 2) timing and geometric mismatches, and 3) the large variability of theZ−R relationships mainly due to differ-ences of rainfall characteristics, locations and times (Joss et al., 1970; Battan, 1973; Chumchean, 2004). These problems reduce the accuracy ofZe−R conversion for radar rainfall
estimates.
To overcome these problems in TMM, the probability matching method (PMM) was developed to match non-synchronous datasets ofZeandR using cumulative density
functions (CDF) (Calheiros and Zawadzki, 1987; Atlas et al., 1990; Rosenfeld et al., 1993). The PMM eliminates the sampling volume, collocation and timing errors by match-ingZe andR pairs of non-synchronousZe andR datasets
that have the same CDF. This method provides better results in estimatingZe−R relationships for non-synchronous Ze
andR datasets as compared to TMM (Atlas et al., 1997). However, Krajewski and Smith (1991) found that the TMM is still significantly superior, providing much higher rain estimation accuracy, as compared to PMM for estimating Ze−R relationships of synchronous Ze−R pairs.
Rosen-feld et al. (1994) developed the window probability match-ing method (WPMM) to surmount weaknesses of the PMM by matchingZeandRpairs within small space and time
win-dows to encompass the collocation and synchronization un-certainties. The WPMM provided significantly improved re-sults in estimating the rain intensity. The advantage of PMM and WPMM is that there is no requirement of concurrentZe
andR datasets while the disadvantages are that these tech-niques do not represent the real physical process of rain-fall and they do not use joint probability betweenZeandR
datasets.
The accuracy of radar rainfall estimates is particularly im-portant when these estimates must be computed as input to a hydrological model (Borga, 2002). TheZe−Rconversion
er-ror is an important issue which affects the accuracy of the es-timation ofZe−Rrelationship and radar-measured rainfall.
In order to minimize synchronization and collocation uncer-tainties inZe−R pairs matching and to address the
short-comings of PMM and WPMM, the present study aimed to develop a method to improve estimation of theZe−R
rela-tionships of non-synchronousZe−Rpairs by accounting for
collocation and timing errors. This new method is compared with three other methods, namely TMM, PMM and WPMM. The accuracy of radar rainfall estimates is evaluated using rain gauge-based estimates of point rainfall and mean areal rainfall. The study area is a mountainous watershed in the north of Thailand where rain gauge observations are avail-able from a dense rain gauge network and digital radar data is available from a weather radar installed in the vicinity.
2 Study area and data collection
2.1 Description of the study area
The study area, Mae Chaem Watershed is located in the north of Thailand with a geographical area of 3853 km2 (Fig. 1). The study watershed is contained within 18◦060– 19◦100N and 98◦040–98◦340E which comprises mountain-ous and forested terrain. The highest point in the Mae Chaem Watershed is the Doi Inthanon summit, 2565 m above the mean sea level, the highest altitude in Thailand. The low-est point in the watershed is 282 m above the mean sea level. The water flows through the Mae Chaem Watershed areas for 135 km before joining the Ping River, one of the tributaries of the Chao Phraya River, the main river of Thailand. Rainfall in this region is characterized by a large seasonal and inter-annual variation. The average inter-annual rainfall in the study area varies from 1000 to 1200 mm and more than 80% of it occurs during the southwest monsoon and tropical cyclones. Kuraji et al. (2004) and Dairaku et al. (2002) reported that the rainfall in the Mae Chaem Watershed is orographic. The av-erage annual runoff at the watershed outlet is 1075×106m3 and about 70% of it occurs during the rainy season from May to October.
2.2 Gauge and radar data
The GEWEX Asian Monsoon Experiment – Tropics (GAME-T) project from 1996–2001 established a rain gauge network in the Mae Chaem Watershed to observe rainfall in this mountainous area since 1997 (Kuraji et al., 1998). Auto-matic tipping bucket type rain gauges (20 cm orifice diame-ter and 0.5 mm per tip) with pulse-count time-recording data loggers (one second time resolution) were installed at 13 sites in the watershed. At the outlet of the watershed (Fig. 1), a river flow gauging station (P. 14) is also being operated by the Royal Irrigation Department (RID) of Thailand.
Radar data in this research was obtained from the meteo-rological radar installed in 1991 on top of a mountain at Om Koi (17◦47053 N, 98◦25057 E) in northern Thailand (Fig. 1). The Bureau of the Royal Rainmaking and Agricultural Avi-ation, Thailand, operates the Om Koi Radar station for rou-tine observations. The radar is an S-Band Doppler weather surveillance radar system (DWSR-88S model), with the following principal characteristics: frequency 2.7–2.9 GHz, wavelength 10.8 cm, peak power 500 kW, antenna diameter 6.1 m and beam width 1.2◦. The data was obtained at 5 min
T. Piman et al.: Development of a window correlation matching method 1363
5N 10N 15N 20N 25N
95E 100E 105E 110E
Mae Chaem Watershed
China
[image:3.595.131.470.65.315.2]Figure 1.
Fig. 1. Mae Chaem Watershed and locations of radar and gauge stations.
The continuous gauge record of rainfall during 15–18 September 1999 at each of the 13 rain gauges was used to calculated rain intensity values of 5 min duration and they are paired with the corresponding 5 min reflectivity values mea-sured by radar for determining theZe−Rrelationship. All the
rainfall events within the 86 h of 13 individual rainfall mea-suring sites were used to develop the representativeZe−R
relationship for the entire study watershed of 3853 km2. The calibrated relationship was then verified using the rainfall event observed during 11–14 September 2000. Table 1 presents the characteristics of rainfall observed at the 13 rain gauge stations in the study watershed for the two rainfall events used for the calibration and verification.
3 Ze–R matching techniques
3.1 Traditional matching method (TMM)
The approach of TMM consists of matching the value ofZe
over a rain gauge station withR at the corresponding time of measurement (Fig. 2). This method assumes that the rain-drops fall absolutely vertical from the atmosphere to the rain gauges and that the radar rain intensity at the measured alti-tude is the same as at the surface (Calheiros and Zawadzki, 1987).
3.2 Probability matching method (PMM)
The probability matching method was proposed by Calheiros and Zawadzki (1987) to bypass sampling volume, timing and
Ze at time t
R at time t
Figure 2.
Fig. 2. The traditionalZe−Rmatching method (TMM).
collocation problems in radar-gauge point comparison. In PMM, it is assumed that the radar observed reflectivity has the same probability of occurrence as the gauge-measured rain intensity (Atlas et al., 1990; Rosenfeld et al., 1993). The setting of Ze−R pairs using this method is therefore
based on matching the CDFs of gauge rainfall intensities and radar measured reflectivity values as described in Eq. (1) and shown in Fig. 3.
∞ Z
Ri
P (R)dR= ∞ Z
Zei
P (Ze)dZe, (1)
where P (R) is the probability density function of gauge-measured rainfall intensities and P (Ze) is the probability
density function of measured reflectivity values by radar. To
Table 1. Characteristics of rainfall observed at 13 rain gauges in the study watershed.
Description Calibration Verification
Period 15–18 September 1999 11–14 September 2000
Rain type Orographic Orographic
Duration (h) 86 75
Maximum gauge-measured rain intensity 90.0 84 of 5 min duration (mm/h)
Maximum gauge-measured rain intensity 38.5 37.5 of 1 h duration (mm/h)
Accumulated gauge mean areal rainfall 72.9 89.8 by Thiessen polygons (mm)
100%
0
CDF
100%
0
CDF
R (mm/h) Ze (dBz)
R1 R2 Z1 Z2
[image:4.595.312.543.228.441.2]Figure 3.
Fig. 3. The probability matching method (PMM).
construct CDF ofZeand R, the datasets ofZeandRare
de-termined as explained earlier in TMM.RiandZi having the
same CDF values are matched as pairs and then these pairs are used to determine theZe−R relationship. This method
eliminates timing errors because PMM does not make use of the actual time at which each pair ofRandZe occurred
and the geometric errors are eliminated as long as raindrops at the radar pixel over the rain gauge fall absolutely verti-cal. However, the disadvantage of PMM is that this method does not consider the joint distribution or inter-association betweenZeandR.
3.3 Window probability matching method (WPMM) The window probability matching method was developed by Rosenfeld et al. (1994) to reduce geometrical mismatch and synchronization error inZe andR pair matching whereZe
is obtained from the space windows, centered over the co-ordinates of the rain gauges, andR is taken from the gauge time windows, centered at timet of the radar scan as illus-trated in Fig. 4. The values ofZeandRfrom the space and
time windows are then contributed to theP (Ze)andP (R)to
matchZeandRat the same percentile. In this way the
clos-est possible synchronization between the radar and gauge ob-servations may be obtained and one may be assured that the radar observations aloft correspond to the rain measurements at the surface in spite of possible navigation errors and dis-placement of the rain from the center of the radar window
t
t-5 min t+5 min 15 min
Gauge time window Rain gauge location
1 km 1 km
Radar reflectivity space window 7 km
7k
m
Figure 4.
Fig. 4. The window probability matching method (WPMM).
by the wind. This also increases the number ofZe−Rpairs
and thus the accuracy of the estimated Ze−R relationship.
In this study, forty-nine reflectivity values within 7×7 km of radar space window and three gauge rain intensity values of 5-min gauge time window (Fig. 4) were used in the WPMM procedure.
3.4 Window correlation matching method (WCMM) WCMM was developed to matchZe−Rpairs when
colloca-tion and timing errors are present (non-synchronousZe−R
datasets). These errors are caused by wind and the height of radar measurement, respectively. This method attempts to account for the physical process of rainfall as the raindrops rarely fall absolutely vertically due to wind effects, and also radar measurements are taken at a higher altitude from the ground, so that it is necessary to consider the travel time of raindrops. Moreover, the WCMM uses concurrentZeandR
[image:4.595.53.284.245.342.2]T. Piman et al.: Development of a window correlation matching method 1365
Table 2. WCMM scenariosanalyzed and the number ofZevalues.
Space window
Time window (min)
(km) 0 0,−5 0,−5,−10
3×3 S33T0 (9) S33T5 (18) S33T10 (27) 5×5 S55T0 (25) S55T5 (50) S55T10 (75) 7×7 S77T0 (49) S77T5 (98) S77T10 (147) 9×9 S99T0 (81) S99T5 (162) S99T10 (243)
Note: The figure in parentheses is the number ofZevalues consid-ered in the analysis.
of possible matching areas ofZefrom the traditional
match-ing method for searchmatch-ing and findmatch-ing the optimal Ze that
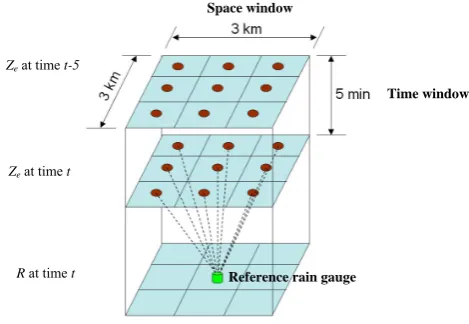
gives the best correspondence withR. The possible matching areas in this method consist of the space and time windows as shown in Fig. 5. The purpose of the space window is to re-duce the geometric mismatch that is affected by wind, while the time window is to account for a timing error which is mainly affected by the height of radar measurement.
The process of WCMM consists of matchingZe values
within the space and time windows to reference gauge rain-fall intensity and searching for the value ofZe of the radar
pixel that gives the maximum correlation coefficient (r)as expressed in Eqs. (2) and (3). ThisZevalue is then assigned
to match the reference gauge rainfall intensity. ThisZe−R
pair is called “the optimalZe−Rpair”.
r=covZeR SZeSR
, (2)
covZeR = n P i=1
((Zi−Ze)x(Ri−R))
(n−1) , (3)
whereZiisZevalue of non-zeroZe−Rpairi,Zis the mean
value ofZedata,Ri isRvalue of non-zeroZe−Rpairi,R
is the mean value ofRdata,SZe is the standard deviation of
Ze data,SR is the standard deviation ofRdata andnis the
number of non-zeroZe−Rpairs over the 86 h of the 13 rain
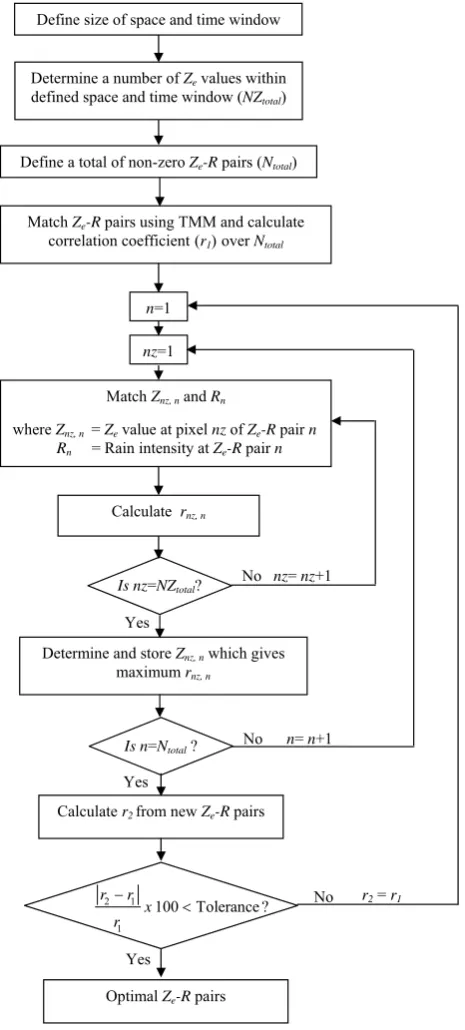
gauge sites. The WCMM process is illustrated in Fig. 6. The size of the space and time windows must be large enough to account for collocation and timing errors.
For the value ofr=1, theZe−R pairs are perfectly
syn-chronized, while a value ofr=0, means that theZe−Rpairs
do not have a relationship at all. The WCMM allows match-ing the values ofZe of the radar pixels surrounding the
ref-erence rain gauge or measured in the previous time intervals withR.
Space window
Time window
R at time t Ze at time t
Ze at time t-5
Reference rain gauge
[image:5.595.49.287.88.175.2]Figure 5.
Fig. 5. The concept of the window correlation matching method (WCMM).
4 Evaluation ofZe−Rrelationships
4.1 Comparison of various WCMM scenarios
Twelve WCMM scenarios were investigated in this study for matchingZe−Rpairs and identifying the optimalZe−R
pairs. The sizes of the space windows used were 3×3, 5×5 7×7 and 9×9 radar grid pixels which cover an area of 9, 25, 49 and 81 km2, respectively, above the rain gauges. The time windows of radar measurements were set to three sizes which consist of present time that is at the same time as rain gauges measurement (0 min), a combination of present time and 5 min previous time (0 and−5 min) and a combination of present time, 5 and 10 min previous times (0, −5 and −10 min). These scenarios are defined in Table 2. The num-ber ofZe values for finding optimalZe that gives the best
correspondence withR with respect to the given space and time windows are presented in parenthesis in Table 2.
Fifteen rain intensity values of 5 min duration which vary from 0.5 to 7.5 mm/5 min (6 to 90 mm/h) with the increment of 0.5 mm/5 min (6 mm/h) were considered over the 86 h pe-riod with the 13 rain gauges stations. This gave a total of 627 non-zeroZe−Rpairs. The scatter plots of theseZe−Rpairs
for the twelve WCMM scenarios are depicted in Fig. 7. It is found that when the space and time window size is increased, the degree of scatter ofZe−Rpairs reduces. However, it can
be seen that the scatter plot of the 9×9 km of the space win-dow (S99) has no significant improvement as compared to the 7×7 km of the space window (S77). Similarly, the in-crease in time window from 5 to 10 min previous time also has not reduced the degree of scatter ofZe−R pairs. The
degree of fit of the relationship ofZe−Rpairs based on
var-ious WCMM scenarios was measured in terms of correlation coefficient (Eqs. 2 and 3) and the results are presented in Ta-ble 3.
Define size of space and time window
Determine a number of Ze values within
defined space and time window (NZtotal)
Define a total of non-zero Ze-R pairs (Ntotal)
Match Ze-R pairs using TMM and calculate
correlation coefficient(r1)over Ntotal
n=1
nz=1
Match Znz, n and Rn
where Znz, n= Ze value at pixel nz of Ze-R pair n
Rn = Rain intensity at Ze-R pair n
Calculate rnz, n
Is nz=NZtotal?
Determine and store Znz, n which gives
maximum rnz, n
Is n=Ntotal?
Calculate r2from new Ze-R pairs
2 1
1
100 Tolerance ?
r r x r
−
<
Optimal Ze-R pairs
No nz= nz+1
No n= n+1
No
Yes Yes Yes
r2 = r1
[image:6.595.53.286.64.580.2]Figure 6.
Fig. 6. The WCMM process.
Thervalues increase significantly when the space window in WCMM is expanded from 3×3 to 5×5 km for the differ-ent time windows considered. The percdiffer-entage increase varies from 10.68–28.88%. However, thervalues have slightly in-creased when the space window is enlarged to 7×7 km. The change is about 2% as compared to 5×5 km of the space window. Further increase in the space window to 9×9 km
Table 3. Correlation coefficient of Ze−R pairs for different
WCMM scenarios.
Space window
Time window (min)
(km) 0 0,−5 0,−5,−10 3×3 0.644 0.765 0.769 5×5 0.830 0.848 0.850 7×7 0.845 0.868 0.870 9×9 0.846 0.869 0.870
has very small increase in ther values. On the other hand, when the time widow is extended from present time to previ-ous 5 min of radar measurement, thervalues have increased slightly except in the S33T5 scenario (Table 2) where an in-crease of 18.79% as compared with S33T0 is observed. The increases inrvalues for the other scenarios are about 2–3%. The results indicate a small increase inrvalues when previ-ous 10 min of radar observation is added in the time window of WCMM. The increase in ther values is less than 0.5%. The use of 9×9 km of the space window and previous 10 min of radar observations in the time window has no significant improvement in the relationship ofZe−R pairs. Based on
the results, it can be concluded that when the space and time window size of WCMM are increased, the relationship be-tweenZeandRis improved. Moreover, the S77T5 scenario
(using a 7×7 km of the space window and a combination of present time and previous 5 min radar scan in time window) is sufficient to correct collocation and timing errors inZe−R
pairs.
4.2 Estimation of a and b parameters in Ze-R relationship
The relationship between Ze−R is usually represented in
term of empirical power law equation (Marshall and Palmer, 1948; Joss et al., 1970; Collier, 1996; Rosenfeld et al., 1993) as below,
Ze=aRb, (4)
whereZeis measured radar reflectivity in mm6/m3,Ris
rain-fall intensity in mm/h, anda andbare parameters. The pa-rametersa andbin the power law equation were estimated for different WCMM scenarios and the results are presented in Table 4.
[image:6.595.338.518.97.183.2]T. Piman et al.: Development of a window correlation matching method 1367
[image:7.595.49.550.64.608.2]Figure 7.
Fig. 7. Scatter plots ofZe−Rpairs for different WCMM scenarios during 15–18 September 1999.
previous 10 min of radar observation in the time window in WCMM has no significant change in the values of parameters aandbinZe−Rrelationship considered in the study. These
results also suggest that 7×7 km of the space window and a combination of present time and previous 5 min radar scan
in time window in WCMM can account for collocation and timing errors that occurred due to wind effects and the differ-ence in height of measurements by radar and rain gauges.
Table 4. ParametersaandbinZe−Rrelationship (Eq. 4) for different WCMM scenarios.
Space window
Time window (min)
(km) 0 0,−5 0,−5,−10
a b a b a b
3×3 42.44 1.157 30.59 1.298 30.48 1.302 5×5 26.35 1.305 19.04 1.422 19.00 1.424 7×7 18.60 1.423 18.05 1.450 18.02 1.451 9×9 18.58 1.425 18.04 1.450 18.02 1.451
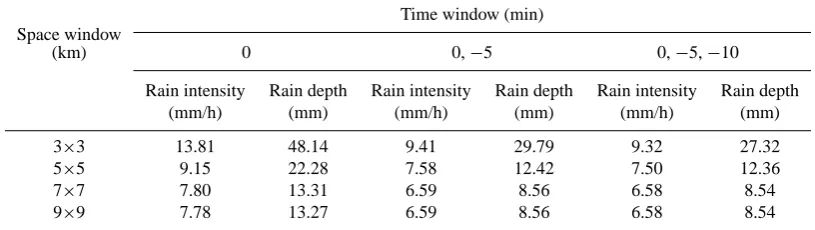
Table 5. Mean absolute error (MAE) in rainfall intensity and rainfall depth for different WCMM scenarios.
Space window
Time window (min)
(km) 0 0,−5 0,−5,−10
Rain intensity Rain depth Rain intensity Rain depth Rain intensity Rain depth
(mm/h) (mm) (mm/h) (mm) (mm/h) (mm)
3×3 13.81 48.14 9.41 29.79 9.32 27.32
5×5 9.15 22.28 7.58 12.42 7.50 12.36
7×7 7.80 13.31 6.59 8.56 6.58 8.54
9×9 7.78 13.27 6.59 8.56 6.58 8.54
4.3 Comparison of radar- and gauge-measured rainfall In order to find out which space and time window sizes in WCMM give the best results for radar rainfall estimates as compared with the gauge rainfall, the performances of esti-matedZe−R relationships from different WCMM
scenar-ios are also evaluated in this study with two approaches de-scribed in the following sections.
4.3.1 Point rainfall estimates
The estimations of radar rainfall intensities of 5 min duration over 13 rain gauges in the Mae Chaem Watershed using the estimatedZe−R relationships for different WCMM
scenar-ios were compared with the observed gauge rainfall inten-sities as point rainfall measurements. The performance of different estimatedZe−Rrelationships was evaluated using
the mean absolute error (MAE) as expressed below, MAE= 1
n
n X i=1
|Ri−Gi|, (5)
whereRiis radar rainfall intensity in mm/h or total depth of
radar rainfall in mm,Gi is gauge rainfall intensity in mm/h
or total depth of gauge rainfall in mm andnis the number of data pairs of 13 rain gauges. The results of MAE are pre-sented in Table 5. It is seen that the increase in the space window in WCMM from 3×3 to 5×5 and 7×7 km decreases
MAE of radar-measured rainfall. However, further increase to 9×9 km has no improvement in MAE for all the time dow scenarios analyzed. Furthermore, when the time win-dow in WCMM is extended from present time to previous 5 min, MAE also reduces. However, relatively much less re-duction in MAE is observed when previous 10 min of radar observation in the time widow is considered compared to the present time and previous 5 min of radar scan in the time widow in WCMM.
In addition, the total depths of rainfall of 13 rain gauges over 86 h are compared with radar rainfall estimates using the MAE statistic (Eq. 5) as also presented in Table 5. The re-sults are similar to the comparison of radar and gauge rainfall intensity. The enlargement of space and time windows from 3×3 to 7×7 km and present time to previous 5 min improves the estimation ofZe−R relationship and radar rainfall.
Us-ing 9×9 km of space window and previous 10 min of radar scanning in time window also has no significant reduction in MAE. Therefore, in this study, it can be concluded that the Ze−R relationship estimated based on S77T5 provides the
[image:8.595.92.500.247.362.2]T. Piman et al.: Development of a window correlation matching method 1369
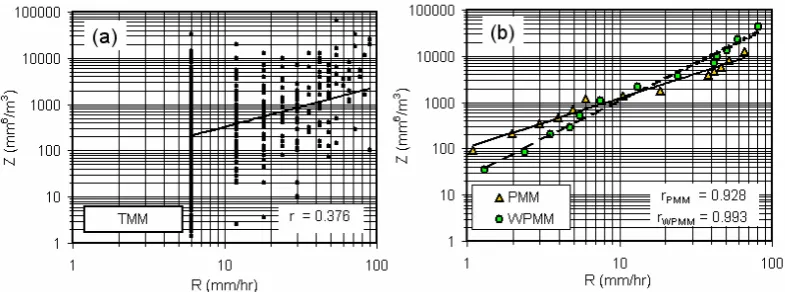
[image:9.595.101.494.63.209.2]Figure 8.
Fig. 8. Scatter plot ofZe−Rpairs based on TMM (a), PMM and WPMM (b) during 15–18 September 1999.
Table 6. Cumulative mean areal rainfall (CMAR) and PDCMARfor different WCMM scenarios.
Radar
Rain gauge (mm) Space window
Time window (min)
(km) 0 0,−5 0,−5,−10
CMAR (mm) PDCMAR(%) CMAR (mm) PDCMAR(%) CMAR (mm) PDCMAR(%)
3×3 83.8 15.0 78.6 7.8 78.3 7.4
72.9
5×5 80.5 10.4 75.4 3.4 75.2 3.2
7×7 76.9 5.5 70.7 −3.0 70.7 −3.0
9×9 76.8 5.3 70.7 −3.0 70.7 −3.0
Note: PDCMARis the percentage difference of cumulative mean areal rainfall between the radar and the rain gauge data.
4.3.2 Mean areal rainfall estimates
A comparison of cumulative mean areal rainfall (CMAR) estimates over the whole area of the Mae Chaem Water-shed during 15–18 September 1999 (86 h) obtained using the Thiessen polygon technique with 13 rain gauges data (dense rain gauge network) and from the radar data using the differentZe−Rrelationships that are estimated based on
several WCMM scenarios (Table 4) is presented in Table 6. The percentage difference of cumulative mean areal rainfall (PDCMAR)between the radar and the rain gauge data is
deter-mined using Eq. (6) and the results are also given in Table 6. PDCMAR(%)=
CMARradar−CMARgauge
CMARgauge
×100, (6)
In Eq. (6), CMARradar and CMARgauge are the cumulative
mean areal radar and guage rainfall, respectively, in mm. The positive and negative values of PDCMAR mean that
cu-mulative mean areal radar rainfall is overestimated and un-derestimated, respectively, compared to the estimates based on the Thiessen polygon technique using the 13 rain gauges data. Among the WCMM scenarios, the results from S77T5, S77T10, S99T5 and S99T10 are closest to the estimates based on rain gauge data with a difference of only−3% over
a period of 86 h. Again, from these results, it is concluded that increasing in the space window from 7×7 to 9×9 km and extending the previous 10 min of radar measurement in the time window in WCMM causes no significant improve-ment in the mean areal radar rainfall estimates. From these results, it is also confirmed that the S77T5 scenario provides the best results of radar measured rainfall in the present study. 4.4 Comparison of Ze-R pair matching techniques
TheZe−R relationship estimated from S77T5 is compared
with those estimated from the other three techniques, namely TMM and PMM and WPMM. TheZe−R pairs scatter plot
of TMM is shown in Fig. 8a. It can be seen thatZeis poorly
related toRwithrof 0.376. TheZeandRdatasets of TMM
were used in PMM to determine the CDF of gauge rainfall in-tensities and measured radar reflectivity data. TheZe andR
datasets for WPMM were obtained from 7×7 grid points of radar reflectivity space window and three 5-min rainfall in-tensities of gauge time window, respectively. TheZeandR
in PMM and WPMM that have the same CDF values (10, 20, 30, 40, 50, 60, 70, 80, 90, 92, 94, 96, and 98%) were matched as pairs as shown in Fig. 8b. Regression analysis was used to estimate the parametersaandbof the empirical formula of
Table 7. Performance ofZe−Rrelationships by differentZe−Rpair matching techniques.
Ze−Rmatching method Parameter MAE CMAR PDCMAR
a b (mm/h) (mm) (mm) (%)
TMM 45.85 0.861 63.10 108.94 216.0 196.3
PMM 95.52 1.134 11.30 34.28 44.0 −39.6
WPMM 25.46 1.630 8.45 12.14 65.1 −10.7
S77T5-WCMM 18.05 1.450 6.59 8.56 70.7 −3.0
Note: MAE is mean absolute error, CMAR is cumulative mean areal rainfall and PDCMARis the percentage difference of cumulative mean areal rainfall between the radar and the rain gauge data.
0 20 40 60 80 100 120 140 160 180 200 220 240 15-Sep-99 06:00 16-Sep-99 06:00 17-Sep-99 06:00 18-Sep-99 06:00 19-Sep-99 06:00 20-Sep-99 06:00 C um ul at iv e m ean a real r ai nf al l ( m m ) 5
S77T5-WCMM (70.7 mm) TMM (216.0 mm)
Thiessen (72.9 mm)
PMM (44.0 mm) WPMM (65.1 mm)
Figure 9.
Fig. 9. Cumulative mean areal rainfall estimates based on different Ze−Rpair matching techniques.
Ze−Rrelationship for TMM, PMM and WPMM and the
re-sults are presented in Table 7. The performance of theZe−R
relationships derived from the four matching techniques was evaluated in terms of point rainfall and mean areal rainfall estimates by comparing them with the rain gauge data (see Sect. 4.3). The analysis results are also given in Table 7.
The estimatedZe−R relationship from TMM gives the
largest MAE of 63.10 mm/h and 108.94 mm in point radar rainfall estimates, as compared to the estimates based on the other three methods, due to unsynchronizedZe−Rpairs used
in TMM (Fig. 8a). TheZe−R relationship by PMM
pro-vides improved estimates of point rainfall compared to those based on TMM. Further improvement in rainfall estimates is observed with WPMM in which the MAE is reduced to 8.45 mm/h and 12.14 mm. However, theZe−R relationship
determined based on S77T5 gives the best results of point rainfall estimates with MAE of 6.59 mm/h and 8.56 mm in the rain intensity and amount, respectively.
0 10 20 30 40 50 60 70 80 90 100 11-Sep-00 00:00 11-Sep-00 18:00 12-Sep-00 12:00 13-Sep-00 06:00 14-Sep-00 00:00 14-Sep-00 18:00 C umu la tiv e me an a re al r ain fa ll ( mm)
Gauge (89.8 mm) Radar (92.3 mm)
[image:10.595.51.285.214.448.2]Figure 10.
Fig. 10. Cumulative mean areal rainfall estimates based on 13 rain gauges and radar data during 11–14 September 2000 for verifica-tion.
The cumulative mean areal rainfall estimates based on dif-ferentZe−Rpair matching techniques and rain gauges data
are compared in Fig. 9. The cumulative mean areal rainfall based on the radar data using Ze−R relationship obtained
from TMM is much overestimated, a value of 216.0 mm compared to 72.9 mm with the Thiessen polygon method using 13 rain gauges data. The cumulative mean areal rainfall based on PMM is underestimated with the differ-ence of−39.6% when compared with the Thiessen polygon method. The WPMM provided better estimates of cumula-tive mean areal rainfall as compared to TMM and PMM (Ta-ble 7 and Fig. 9). Further improved results were obtained with WCMM. TheZe−Rrelationship determined based on
[image:10.595.313.537.215.449.2]T. Piman et al.: Development of a window correlation matching method 1371 4.5 Verification of Ze-R relationship
The calibratedZe−Rrelationship (Ze=18.05R1.45)obtained
from S77T5-WCMM is verified using the rainfall event oc-curred during 11–14 September 2000. Table 1 presents the rainfall characteristics of this event. The accumulated mean areal rainfall of 89.8 mm over a period of 75 h is calculated using the Thiessen polygon method with 13 rain gauges. The verification results of radar rainfall estimates are com-pared with the mean rainfall observed with the rain gauges in Fig. 10. The mean areal radar rainfall matches well that ob-tained from the rain gauges with a difference of about 3% in the two measurements. This clearly indicates that theZe−R
relationship developed in the present study can be used with confidence in converting radar reflectivity measurements into the rain intensities in the study area.
5 Conclusions
In this study, a method called the window correlation match-ing method (WCMM) was developed to correct collocation and timing errors inZe−R pair matching to reduceZe−R
conversion errors in radar-measured rainfall. This method was compared with other three methods, namely the tra-ditional matching method (TMM), the probability match-ing method (PMM) and the window probability matchmatch-ing method (WPMM). The Ze−R relationship was developed
based on 5 min rain gauge and radar data of orographic rain occurring during 15–18 September 1999 over the Mae Chaem watershed in the north of Thailand and the model re-sults were verified using the rainfall event observed during 11–14 September 2000.
In order to find out which space and time windows in WCMM give the best results for radar rainfall estimates, the size of the space and time windows was varied. The compar-ison among various WCMM scenarios shows that when the space and time window sizes are increased, the relationship betweenZe andR improves. Using 7×7 km of space
win-dow and a combination of present and 5 min previous time of radar observation in the time window (S77T5) provides the best correlation in the matching of Ze−R pairs. The
variation of the space and time widow sizes also affects the accuracy of the estimation ofZe−R relationship. The
rela-tionshipZe=18.05R1.45obtained from S77T5 gives the best
results of point rainfall estimates with MAE of 6.59 mm/h for rainfall intensity and 8.56 mm for the total depth of rainfall. Also, this Ze−R relationship provides the best estimation
of mean areal radar rainfall with a difference in the cumula-tive mean areal rainfall of−3% as compared with the gauge rainfall. These results confirm that S77T5 is large enough to account for collocation and timing errors inZe−R pair
matching that occur due to wind effects and the difference in height of measurement of rainfall by radar and rain gauges.
The Ze−R relationship obtained from TMM provides
poor estimation of radar rainfall because of geometrical mis-match and timing errors. The PMM improved the radar rain-fall estimates compared to TMM as PMM is based on proba-bility density functions of radar reflectivity values and gauge-measured rainfall intensities which are derived from the ob-servations. The accuracy of point and mean areal rainfall estimates is considerably improved when WPMM is used to matchZe−R pairs compared to those based on TMM and
PMM. However, PMM and WPMM do not consider the joint probability betweenZeandR. From the comparison among
the fourZe−Rpair matching techniques, it can be concluded
that theZe−Rrelationship obtained from WCMM provides
better estimates of point rainfall and mean areal rainfall than TMM, PMM and WPMM.
Further, the development of WCMM attempts to represent the real physical process of rainfall as the raindrops rarely fall absolutely vertically due to wind effects and also radar mea-surements are taken at a height much higher than the ground so raindrops take time to reach to the ground. However, this matching technique does not take into account the error of variation of measured reflectivity in vertical profile which is a further area of research. WCMM is therefore a promising method for improved real time radar-measured rainfall input for hydrological and environmental modeling in watersheds, especially those lacking rain gauge data or completely un-gauged.
Acknowledgements. This article is a part of doctoral research
con-ducted by the first author at Water Engineering and Management, Asian Institute of Technology, Pathumthani, Thailand. The finan-cial support by the Royal Thai Government for doctoral study is gratefully acknowledged. The authors would like to express sincere gratitude to the staff of 7th Watershed Management Center of the Royal Forestry Department, the Bureau of the Royal Rainmaking and Agricultural Aviation and the Royal Irrigation Department of the Royal Thai Government who assisted and provided rainfall, radar and runoff data for the study area respectively. Thanks are also extended to the staff of the Thai Metrological Department for useful suggestions during the work.
Edited by: J. D. Kalma
References
Atlas, D.: Advances in radar meteorology, in: Advances in Geo-physics, edited by: Atlas, D., Academic press, New York, USA, 318–478, 1964.
Atlas, D., Rosenfeld, D., and Jameson, M. R.: Evolution of radar rainfall measurements: steps and mis-steps, Weather Radar Tech-nology for Water Resources Management, IRTCUD/University of Sao Paulo, Brazil and IHP-UNESCO, 1997.
Atlas, D., Rosenfeld, D., and Wolff, D. B.: Climatologically tuned reflectivity-rain rate relations and links to area-time integrals, J. Appl. Meteorol., 29, 1120–1135, 1990.
Battan, L. J.: Radar observation of the atmosphere, University of Chicago press, Chicago & London, England, 1973.
Bell, V. A. and Moore, R. J.: A grid-based distributed flood forecast-ing model for use with weather radar data: Part 2. Case studies, Hydrol. Earth Syst. Sci., 2, 283–298, 1998,
http://www.hydrol-earth-syst-sci.net/2/283/1998/.
Borga, M.: Accuracy of radar rainfall estimates for streamflow sim-ulation, J. Hydrol., 267, 26–39, 2002.
Calheiros, R. V. and Zawadzki, I.: Reflectivity rain-rate relation-ships for radar hydrology in Brazil, J. Clim. Appl. Meteorol., 26, 118–132, 1987.
Chumchean, S.: Improved estimation of radar rainfall for use in hydrological modeling, Doctoral Dissertation, University of New South Wales, Sydney, Australia, 2004.
Collier, C. G.: Applications of weather radar systems: A guide to uses of radar data in meteorology and hydrology, John Wiley & Sons, New York, USA, 1996.
Collinge, V. K. and Kirby, C.: Weather radar and flood forecasting, John Wiley & Sons, Great Britain, England, 1987.
Dairaku, K., Emori, S., Oki, T., and Musiak, K.: Orographic rain-fall in tropical mountainous region, the Mae Chaem Watershed, Proc., 2002 workshop on GAME-Topics and hydrometeorologi-cal studies in Thailand and Southeast Asia, Chiang Rai, Thailand, 2002.
Joss, J., Schran, K., Thoms, J. C., and Waldvogel, A.: On the quanti-tative determination of precipitation by radar, Wissenschaftliche Mitteilung No.63, Eidgenossischen Kommission Zum Studium der Hagelgilbung und der Hergelsher, 1970.
Krajewski, W. F. and Smith, J. A.: On the estimation of climatolog-ical Z-R relationships, J. Appl. Meteorol, 30, 1436–1445, 1991.
Kuraji, K., Punyatrong, K., and Sirisiyard, I.: Six years intensive rainfall observation in Mae Chaem Watershed, Northern Thai-land, The 6th international study conference on GEWEX in Asia and GAME, Kyoto, Japan, 2004.
Kuraji, K., Suzuki, M., Tangtham, N., Jirasuktaveekul, W., and Pun-yatrong, K.: Observation of rainfall distribution in Mae Chaem Watershed, Proc., the ’98 Workshop on GAME-Tropics in Thai-land, GAME Publication 7, 24, 1998.
Linsley, R. K., Kohler M. A., and Paulhus, J. L. H.: Hydrology for engineers, McGraw-Hill, London, UK, 1988.
Marshall, J. S. and Palmer, W. Mc.: The distribution of raindrops with size, J. Meteorol. 5, 165–166, 1948.
Rosenfeld, D., Atlas, D., and Short, D.: The estimation of convec-tive rainfall by area integrals, 2: The height area rainfall thresh-old (HART) method, J. Geophys Res. 35, 2161–2176, 1990. Rosenfeld, D., Wolff, D. B., and Amitai, E.: The window
proba-bility matching method for rainfall measurements with radar, J. Appl. Meteorol., 33, 682–693, 1994.
Rosenfeld, D., Wolff, D. B., and Atlas, D.: General probability-matched relations between radar reflectivity and rain rate, J. Appl. Meteorol., 32, 50–72, 1993.
Sun, X., Mein, R. G., Keenan, T. D., and Elliott, J. F.: Flood es-timation using radar and raingauge Rata, J. Hydrol., 239, 4–18, 2000.