EFFECT OF THERMAL CYCLES ON THE FATIGUE LIFE OF AISI 321
STAINLESS STEEL
Lubomir Junek1), Jaroslav Bystriansky2), Libor Vlcek1) and Bohumir Strnadel3)
1) Institute of Applied Mechanics Brno, Ltd., Brno, CZ 2) Institute of Chemical Technology Prague, Praha, CZ 3) Technical University of Ostrava, Ostrava, CZ
ABSTRACT
An experimental-numerical study was focused on the effect of the temperature difference of cycling on the life of austenitic stainless steel under high-temperature thermal fatigue conditions. AISI 321 steel was chosen as an experimental material. Particularly initiation stage of thermal fatigue cracks in AISI 321 steel subjected to repeated thermal shocks was investigated. Non-standard experimental set-up was developed in order to rapid crack initiation of tested specimen. The effect of the temperature difference of cycling was studied by varying ∆T from 150°C to 340°C while holding the lower temperature constant at 100°C. The initiation stage is interpreted as specifying the number of cycles required for the formation of an engineering crack 0.5 mm long. The most of standard lifetime curves for fatigue crack initiation, which are measured on strain-controlled mechanical tests of round polished bars with various diameters in isothermal conditions, are based on the phenomenological Manson-Coffin model and fatigue parameter is represented by amplitude of plastic deformation. It could be noted that original Manson-Coffin equation was derived for uniaxial loading conditions. The main aim of our investigation was to established relation between lifetime curve for prediction of crack initiation in materials under high-temperature thermal fatigue conditions and standard one. As a result of our investigation of thermal fatigue of AISI 321 steel we put forward an additional parameter into the Manson-Coffin fatigue law, which is suitable for describing of cyclic damage due to temperature changes together with plastic amplitude. Finally, very good agreement between fatigue life under thermal loading and fatigue life under isothermal uniaxial testing condition was observed.
INTRODUCTION
Thermal fatigue term is assigned to fatigue damage of material caused by repeated changes of stress due to rise/fall of thermal gradients in the volume of metal and by mutual constraint of thermal expansion of neighboring material elements. The term "thermal fatigue" has been used for a long time but in the past it was connected just with the material damage caused by loading at higher temperatures. Thermal power plants are classical example of such facilities. Attention to material damage at lower temperatures has been paid just a couple years ago [e.g. 1, 2, 3]. With regard to higher operating temperatures the problem of thermal fatigue can be divided into two areas. The damage in the area of higher temperatures is initiated by combined effects of fatigue and creep. The significance of creep damage increases with increasing temperature and time of thermal exploitation. At lower temperatures, deformations can be considered time independent. Material damage is activated by thermal stresses resulting from restriction of material thermal expansion or contraction.From the point of view of above mentioned classification this article deals with the results of thermal fatigue research concentrated on monitoring of influence of thermal cycle changes on service life of steels used in the chemical and nuclear industries. Maximum upper temperature of the cycle was 440 0C.
It has been proved that present methods of thermal fatigue assessment based on contemporary approach may not be sufficiently accurate. Existing methods of structure design generally do not include specific tools that would consider influence of thermal fatigue on their safety during the operation. That is why concentrated effort was devoted to ensure more accurate description of thermal fatigue. UAM (Institute of Applied Mechanics) started, with the support of the Ministry of Industry and Trade of the Czech Republic, a three years project dealing with the research of thermal fatigue. The main objective of the research was to show the differences between repeated mechanical and thermal loading but particularly to quantify these differences. We outlined two main questions right at the beginning and we wanted to find replies to them:
1) Are present approaches of thermal fatigue assessment sufficiently conservative? 2) Are presently used fatigue curves for thermal fatigue predictive?
ANALYSIS OF PRESENT STATE
In spite of the peculiarity of thermal fatigue it has been so far supposed that progress of damaging by the thermal fatigue corresponds to classical fatigue mechanism. In the area of low cycle fatigue Manson-Coffin approach has been widely adopted in the case of crack initiation and Solomon’s relation is used for crack growth description. Growth of crack in the area of high cycle fatigue is described by Basquin and Parris-Erdogan equation. Malm and Noström
transformed above mentioned descriptions of fatigue (mechanical) damage process to the conditions of thermal fatigue and formulated relations for definition of areas of low cycle and high cycle thermal fatigue in dependence on low and high cycle temperature [4].
Present assessment of fatigue service life of structural units and their part are based on the knowledge of fatigue curves, derived experimentally. In most cases these curves were obtained as the material response to deformation loading under conditions of uniaxial state of stress under constant temperature. This is certain simplification compared with the reality. In the case of loading by temperature multiaxial state of stress is invoked directly at the beginning of loading whereas surface loading is uniform in all directions and thermal deformations have biaxial character. Long-term application of thermal loading results in thermal gradient across the wall thickness whereas initial biaxial character of the state of stress changes to spatial.
Most frequent possibility in the field of components design is using of approaches outgoing from phenomenological models. As an example of this model we can present famous Manson-Coffin curves for low cycle fatigue. Phenomenological models do not basically consider micromechanical aspects resulting in fatigue damage, nevertheless they are generally used for prediction of fatigue service life of parts. Within an approach of local deformations it is started from the knowledge of amplitude of total deformation that is determined as a sum of elastic and plastic components:
ap a ap ae at
E
ε
σ
ε
ε
ε
= + = + (1)where εat is amplitude of total deformation, εae is amplitude of elastic deformation, εap is amplitude of plastic
deformation, σa is stress amplitude and E is modulus of elasticity in tension (Young's modulus). Knowledge of the
relation between the amplitude of total deformation and number of cycles to failure of smooth test specimen is basic element in the approach of local deformations. Experimental results are most frequently represented in the form of exponential dependencies indicating relation between stress amplitude and amplitude of plastic deformation on the number of cycles to failure:
b f f
a (2N )
,
σ
σ
= (2)c f f
ap
(
2
N
)
,
ε
ε
=
(3)By insertion of Eq. (2) and Eq. (3) into Eq. (1) we receive required equation indicating relation between amplitude of total deformation and number of cycles to failure of smooth test specimen:
c f f b f f
at
N
E
N
)
2
(
)
2
(
,,
ε
σ
ε
=
+
(4)From engineering point of view the Eq. (4) is at present one of the basic relations used for assessment of part service life in the sense of prediction of defect initiation with contractual size of 0.5 to 1 mm. Presently general procedures of assessment of defect initiation are based on linear analysis of state of stress in reviewed component. The assessment uses fatigue curves according to Manson-Coffin or of Langer type. For creation of fatigue curves of Langer type minimum guaranteed mechanical material properties at design temperature are used and they correspond to assumed operating conditions [5]. Based on the knowledge of distribution of thermal fields, the states corresponding to maximum or minimum temperature enclosing individual thermal cycles are selected. Thermal fields of such selected states represent inputs for successive stress analysis. Distribution of stresses in assessed component is determined on condition of linear-elastic behavior of material in complete range of loading. Subsequently, one loading cycle - heating-up to maximum cycle temperature is calculated with successive cooling to minimum cycle temperature. Obtained results of linear stress analysis are used as a basis for final assessment of defect initiation phase using generally standardized procedures based on the knowledge of fatigue curve most frequently in the form of suitable modification of Eq. (4). Total needed elasto-plastic deformation is determined by recalculation from elastic stresses e.g. using Neuber concept. The output of these fatigue analyses are values of damage cumulation D and number of cycles needed to defect initiation of contractual size 0.5 to 1 mm.
EXPERIMENTAL ACTIVITIES DURING THERMAL FATIGUE RESEARCH
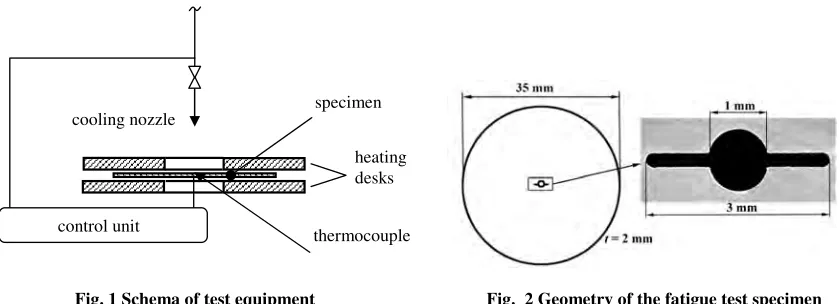
The special testing device was used for the fatigue tests (Fig. 1). Thermal fatigue test specimens were cut from bars of diameter 35 mm into discs of 2 mm thickness; longitudinal axis of the bar was perpendicular to the surface of the tested disc. The specimens were notched by electro-spark machine (Fig. 2). The specimen’s maximum and minimum temperatures Tmax and Tmin have been predefined in the temperature regulator. The fatigue tests were carried out with
temperature Tmin= 100 °C and with the six different values of temperature Tmax = 250, 300, 350, 380, 410, and 440 °C
(i.e., with six different values ∆T = Tmax – Tmin). Research of thermal fatigue was performed for stainless steels used in
the nuclear and chemical industry. Chemical composition of tested steels is shown in Table 1.
Fig. 1 Schema of test equipment Fig. 2 Geometry of the fatigue test specimen
The main goal of fatigue tests was to find out the number of cycles necessary for initiation of a fatigue cracks. Therefore, the specimens were exposed gradually to 1 000, 3 000, and 6 000 thermal cycles and the both specimen’s sides were microscopically checked after each stage of cycling. The specimens were depleted of the oxide layer by the electrochemical reduction of Li(s), by subsequent decontamination in a mixture of HNO3 + HF (20+2 wt%) and
following cleansing in an ultrasonic cleaner. Scanning electron microscope JSM 840A was used for study of surface micromor-phology. The areas near the bottom of notches were observed and documented with set of micrographs in the range of magnification (15 ÷ 3 000) x. The crack length measurement was carried out from the micrographs. Comparison of the micrographs corresponding to the different number of loading cycles offered information about time development of fatigue damage in each investigated specimen. The special methodology was elaborated that enables opening of the thermal fatigue cracks without damaging their faces [5]. The micrographs of specimen surface after 6 000 thermal loading cycles were used for specification of the position and length of cuts that would weaken the remaining carrier intersection of the object so that it would be possible to open the fatigue cracks of size about 100µm. Micromorphology of the open fatigue cracks were observed by scanning electron microscope according to fractographic methods in the range of magnification (15 ÷ 30 000) x, see[5], [6].
Table 1 Chemical composition of studied stainless steel (% by weight)
Material Grade designation C Cr Ni Mo Ti
1 304 1.4301 0.05 17.40 8.90 0.32 0.00
2 321 1.4541 0.03 16.91 9.40 0.10 0.22
3 316L 1.4404 0.02 15.89 11.00 1.89 0.00
4 318 1.4462 0.02 22.78 6.00 2,.70 0.00
Table 2 Speeds of crack growth and number of cycles to initiation of fatigue crack 0.5 mm long
Crack length Speed of growth Number of cycles Load
Surface Fracture area Surface Fracture area Surface Fracture area ∆
∆ ∆ ∆T [°C]
a1 [µm]
a2 [µm]
v1 [µm/cycle]
v2 [µm/cycle]
N0_a1 [cycles]
N0_a2 [cycles]
150 75 75 0.0125 0.0125 38461 38461
200 390 233 0.065 0.38333 7692 12875
250 450 290 0.075 0.04833 6666 10345
280 1090 434 0.18166 0.07233 2747 6912
310 1460 740 0.24333 0.12333 2057 4540
340 3200 1355 0.53333 0.22583 938 2214
The fractographic features on fracture surface were identified and mechanisms of fatigue crack initiation and propagation were described. The boundary between fatigue and final fracture (i.e., crack front after the 6 000 cycles) was determined. The area of fatigue fracture F was measured and the average length of fatigue crack at the end of fatigue test
a2 was determined as the ratio F/t, (t = specimen thickness). The growth of microcracks was substantially faster on the
front (cooled) side than on the back side of specimen. Consequently, the maximum length of fatigue crack a1 (distance
from the bottom of the initiation notch) were measured on cooled side of specimens. The results of crack length cooling nozzle
heating desks
control unit
thermocouple specimen
measurements, corresponding crack growth rates and number of cycles to initiation of fatigue crack length 0.5 mm are summarised in Table 2.
Fig. 3 Appearance of fracture area for loading by ∆∆∆T = 280°C and 340°C (cooling side is on the right side) ∆
NUMERICAL SIMULATION OF THERMAL FATIGUE EXPERIMENT
Numerical simulation includes both thermal and mechanical analysis to determine deformation and stress field distribution in the test specimen, having the shape of thin rotary disk, during controlled thermal loading. The SYSTUS program was used for computation of temperature and stress-strain field by finite element method (FEM). Due to two symmetry planes only one quarter of disk test specimen was
modeled (Fig. 4). Boundary conditions setting were considered to be most important for thermal analysis. Heating was realized by entry of time temperature dependence in the points of heating of test specimen, corresponding to experimentally determined speeds of heating. Specimen cooling was performed by heat transfer coefficient entry in points of specimen cooling i.e. upper surface at radius of 10 mm and inside surface of opening with notch. The analysis of thermal fields was performed for all six different peak-to-peak amplitudes of thermal loading. Results of thermal analyses were compared to experimentally determined temperature distribution in locations of thermocouples for verification of thermal loading. As a result we discovered nearly identical distribution of temperature - time diagram obtained by the analysis and measurement.
For the stress analysis both linear and non-linear elasto-plastic model of material was used. Stress-deformation diagram of tested materials was determined experimentally whereas static and cyclic deformation curve was experimentally determined. Subsequently fatigue appreciation of test specimen model was performed according to standardized approach in locations of maximum stresses. For fatigue appreciation both experimentally determined Manson-Coffin life curve and Langer type curve were used, as the Czech standard admits [7]. The objective of selected procedure was to compare results of experiments (number of cycles to failure of contractual size initiation) with results of numerical analyses. These comparisons of analyzed and experimentally determined numbers of cycles are presented in
Table 3. For experimental results numbers of cycles related to cooled surface are presented. The results presented in Table 3 show evidence that if number of cycles to initiation determined from crack growth speed from cooled surface is used for comparison, then predicted numbers of cycles are significantly less conservative. When elasto-plastic behavior of material is used the results are closer to experimental results though even they are less conservative in some cases too.
0 50 100 150 200 250 300 350
0 20 40 60 80 100 120 140 160 180
tim e [s]
te
m
p
e
ra
tu
re
[
°C
]
Fig. 4 Temperature distribution in measurement area
Table 3 Comparison of experimental and numerical results
COMPILATION OF FATIGUE CURVE
The results of experiments and analyses were used for service life curve compilation for prediction of initiation of crack in conditions of thermal fatigue. The service life curve was compiled on the basis of results of elasto-plastic numerical analysis (total deformations ahead of notch of flat disc specimen) and numbers of cycles to initiation of failure of contractual size were taken from non-standard experiment. Due to mutual comparison of both versions of fractographical assessment (cooled surface versus complete surface of fatigue fracture) one graph of determined numbers of cycles together with the service life curve determined experimentally on smooth cylindrical bodies was plotted (Fig. 6) as it is generally used. Very good match of service life curve of Manson-Coffin type for 3250C, determined on smooth bodies and service life curve, considering number of cycles determined from the speed of crack growth from complete area of fatigue fracture of test specimen is evident from this comparison. When we consider number of cycles determined from the speed of crack growth for the area of cooled surface we can observe certain deviation in direction to lower amplitudes values of total deformation in relation to the curve determined in conditions of prevailing uniaxial state of stress at constant increased ambient temperature. This deflection increases with increasing amplitude of total deformation that reflects increasing peak-to-peak amplitude of thermal loading. From the standpoint of practical application and understanding of discovered phenomenon quantification of service life curve deflection is necessary.
Influence of Notch as Stress Concentrator
Presence of a notch on a part exposed to cyclic loading results in lower fatigue life. This phase of research arose a question if influence of thermal fatigue or influence of notch on test specimen loaded by temperature fluctuation was determined. We made additional experimental works on standard cylindrical bodies equipped with a notch of the same radius as in case of initiation notches on rotary disk bodies to appreciate degree of fatigue service life decrease due to occurrence of notches with very small radius. Based on the knowledge of distribution of peak-to-peak amplitudes of total deformation of a smooth and notched rod on cycle numbers to failure, determination of effective concentration factor αef
was possible. Experimentally determined concentration factor was in the interval 1.96 to 2.15 according to the level of total deformation (Fig. 5). Average determined value of effective concentration factor was αef = 2.05. The value was
determined for five various levels of service life (from 25000 to 2000 cycles).
The results from additional experimental works for determination of notch influence were presented in the same graph. Fig. 6 shows very well match of service life curve for notched cylindrical rods with the curve compiled as a combination of numerical simulation and experimentally determined number of cycles, which are related to the whole area of fatigue fracture. With respect to additional experiments we can deduce that the stress concentration in the notch has only little contribution to the change of service life curve and thus is not sought dominant quantifier of curve deflection.
Fig. 5 Experimental determination of ααααef Predicted number of cycles to crack initiation
Linear FEM analysis Non-linear FEM analysis ∆T
[°C]
Man.-Cof. Langer Man.-Cof. Langer
Measured (N0_a1)
340 5888 2156 2705 1022 938
310 10010 3690 4583 1709 2057
280 30669 12513 7819 2943 2747
250 51702 24047 8602 3378 6666
200 124597 76049 11298 5017 7692
150 10000000 10000000 35263 22144 38461
0 0,001 0,002 0,003 0,004 0,005 0,006 0,007 0,008 0,009 0,01
0,E+00 1,E+04 2,E+04 3,E+04 N [cycles]
εεεε
a
t
[-]
smooth bar 325°C notched bar 325°C
Fig. 6 Comparison of fatigue curves for individual test specimens
Influence of Stress Multiaxiality on Thermal Fatigue
In case of loading by temperature the multiaxial stress of state is invoked already at the beginning of loading whereas surface loading is uniform in all directions and thermal deformations have biaxial character. Characteristic feature of thermal stresses is that maximum stress is on the surface of the part and decreases proportionally with the distance from thermally influenced surface. Due to biaxial character of deformation on the surface, crack initiation and growth is uniform in all directions. So far the multiaxial stress of state for fatigue assessment is transformed to equivalent uniaxial stress according to sufficient strength theory. For the fatigue of metal materials Tresca theory of maximum shear stresses or theory of stress intensity HMH is most frequently used. We discovered from performed analyses of rotary disk bodies, loaded by temperature fluctuation, that the results obtained by using classical strength theories based on the definition of equivalent uniaxial stress were not in expected match with experimentally determined values of cycle numbers (Table 3). Further we started from the fact that all discovered defects on test specimens always initiated from cooled surface. We have never found crack initiation points below cooled surface. This was the reason of our effort to find such parameter along the cross section of test rotary specimen that would be able, for fatigue assessment, to reflect above mentioned characteristic of stress distribution on the surface in case of thermal loading. We verified a couple of various parameters from which the parameter of stress triaxiality TR described best the influence of multiaxial stress of
state. It is defined as:
e e
s R T
σ
σ
σ
σ
σ
σ
3
3 2
1+ +
=
= (5)
In Eq. 5 σ1, σ2, σ3 are principal stresses and σe is equivalent stress. Values presented in Table 4 represent
maximum values of stress triaxiality factor achieved during the thermal cycle. As it is evident from Fig. 7, maximum values of triaxiality were achieved in the area of cooled surface (t = 0 mm) whereas these values decrease very quickly in direction from the surface of test specimen.
Table 4 Values of stress triaxiality factor
Load: Tmax/Tmin [°C] 250/100 300/100 350/100 380/100 410/100 440/100
TR [-] 0.6 0.7 1.01 1.54 1.57 1.66
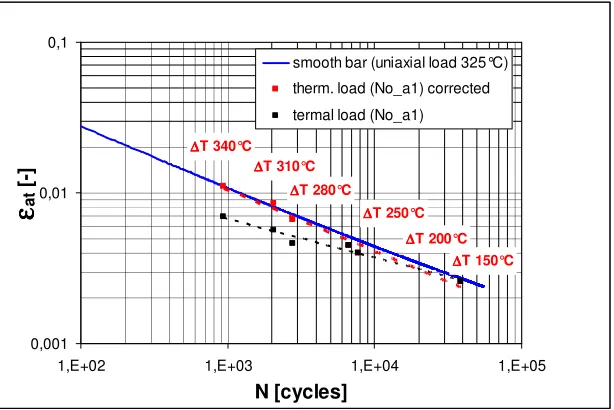
Let us return to comparison of individual service life curves and possibility of description of their mutual deflection. Correction factor φT, considering the influence of triaxial state of stress was determined on the basis of
comparison of service life curve for thermal fatigue, using estimate of cycle number to crack initiation from cooled surface, with conventional service life curve of Manson-Coffin type, determined under conditions of uniaxial state of stress for higher constant temperature. Service life curves are in very good mutual concordance (Fig. 8) if, for description of service life, a curve for thermal fatigue modifications of the original relation based on Eq. (4) is used. Resultant
∆ ∆∆ ∆T 340°C
∆ ∆∆ ∆T 310°C
∆ ∆ ∆
∆T 280°C ∆∆∆∆T 250°C
∆ ∆ ∆ ∆T 200°C
∆ ∆ ∆ ∆T 150°C
0,001 0,01
1,E+02 1,E+03 1,E+04 1,E+05
N [cycles]
εεεε
at[-]
smooth bar (uniaxial load 325°C)
notched bar (uniaxial load 325°C)
thermal load (No_a2)
thermal load (No_a1)
modified amplitude of total deformation is expressed by the following equation, whereas the value of plastic deformation amplitude is multiplied by the correction factor φT:
ae T ap
at
ε
φ
ε
ε
=
+
1
=
=
T R
T
T
φ
φ
1 1
≤ >
R R
T T
(6)
0 0,2 0,4 0,6 0,8 1 1,2 1,4 1,6 1,8
0 0,5 1 1,5 2
Specimen thickness [mm]
S
tr
e
s
s
t
ri
a
x
ia
li
ty
[
-]
250/100°C 300/100°C 350/100°C 380/100°C 410/100°C 440/100°C
Fig. 7 Distribution of stress triaxiality factor along the specimen thickness
∆ ∆ ∆
∆T 340°C
∆ ∆ ∆
∆T 310°C
∆ ∆ ∆
∆T 280°C
∆ ∆ ∆
∆T 200°C
∆ ∆ ∆
∆T 250°C
∆ ∆ ∆
∆T 150°C
0,001 0,01 0,1
1,E+02 1,E+03 1,E+04 1,E+05
N [cycles]
εεεε
a
t
[-]
smooth bar (uniaxial load 325°C)
therm. load (No_a1) corrected
termal load (No_a1)
Fig. 8 Comparison of fatigue curve of Manson-Coffin type for uniaxial state of stress and curves for thermal fatigue with correction according to Eq. (6)
In engineering practice we rather solve an inverse task, i.e. we know a fatigue curve obtained under constant temperatures and uniaxial state of stress and we determine number of cycles to crack initiation of contractual size from it. Within the research of thermal fatigue it was proved that multiaxial state of stress turned to be very important factor for fatigue appreciation of influence of loading by temperature change. On the basis of this fact we suggested modification of present mathematical model used for prediction of fatigue service life. Proposed modification consists in correction of plastic deformation component in dependence on the peak-to-peak amplitude of thermal load or on the amount of stress triaxiality factor. Resulting proposal of modification of relations for mathematical description of crack initiation with
consideration of thermal fatigue of austenitic steels introduces the correction factor φT. Its definition is the same as in Eq.
(6), whereas as allowable value of N0 a smaller value, calculated from the following two equations, is taken:
(
)
(
)
bm f c T
p f
w at
N
E
n
N
n
− −−
+
−
=
0 ,
0 max , ,
2
2
35
,
0
σ σ
σ
σ
φ
ε
ε
ϕ
ε
(7)
(
)
(
)
bN m f
c N T
p f
w at
N
n
E
N
n
− −−
+
−
=
0 ,
0 max , ,
2
2
35
,
0
σ
σ
φ
ε
ε
ϕ
ε
(8)
where εatis amplitude of total deformation, ε’f and σ’f are coefficients of cyclic ductility and strength, b and c
are exponents of cyclic ductility and strength, ϕw is a coefficient of fatigue strength decrease owing to the weld, nσ and nN
are safety coefficients against the amount of stress and number of cycles. εp,max represents maximum value of reversible
plastic deformation and σm is mean stress of the cycle.
CONCLUSION
The results of performed experiments and numerical simulation for cyclic loading by temperature change show that multiaxial state of stress in the body gains fundamental importance. For more accurate description of thermal fatigue we proposed modification of present mathematical model used for prediction of fatigue service life [7]. Proposed modification consists in correction of plastic deformation component in dependence on the value of correction factor φT
whose amount depends on the level of multiaxial stress. For the description of stress multiaxiality the factor of stress triaxiality was used which is generally defined as share of mean and effective stress. Comparison of fatigue curve for conditions of thermal fatigue corrected according to Eq. 6 with the curve obtained in the mode of deformation loading under conditions of multiaxial state of stress. This comparison definitely shows very good match of corrected curve determined under conditions of multiaxial state of stress (loading by cyclic change of temperature in the range of performed experiments) with the service life curve determined under ambient constant increased temperature (325 0C) under conditions of deformation uniaxial state of stress.
At the end we would like to emphasize that proposed modification (Eq. 7 and 8) for prediction of fatigue service life is based only on the results obtained on austenitic steels and on one type of test specimen. It would be advisable for the future to verify proposed modification on different types of test specimens and/or using different concentrator of stress or deformation. It has already been proposed changed geometry and modification of test equipment for tests of thermal fatigue so that it would be possible to apply additional tension load with already mentioned thermal cycles. New shape of fatigue test specimen will enable to determine service life curves in the representation of amplitude of total deformation depending on the number of cycles directly as a response on mechanical or just fatigue cyclic loading of modified notched specimen.
Acknowledgement
This research was supported by the Czech Ministry of Industry and Trade under grant number FT-TA/011. Fractographic analysis was realized in the frame of research project MSM 6840770021.
REFERENCES
[1] Shi, H. J., Wang, Z. G., Su, H. H., “Thermo mechanical fatigue of a 316L austenitic steel at two different temperature intervals,” Sripta Materialia, Vol. 35, No. 9, 1996, pp. 1107-1113.
[2] Hayashi, M., “Thermal fatigue behavior of thin walled cylindrical carbon steel specimens in simulated BWR environment,” Nuclear Eng, and Design, Vol. 184, 1998, pp.123-133.
[3] Fissolo, A., Marini, B., Nais, G., Wident, P., “Thermal fatigue behaviour for a 316L type steel,” Journal of Nuclear Materials, Vol. 233, 1996, pp. 156-161.
[4] Malm, S., Noström, L. A, “Material - related model for thermal fatigue applied to tool steels in hot - work apploications,“ Metal Science, 1979, pp. 544-550.
[5] Siegl, J., Fractographical Description of Thermal Fatigue Damage Processes [Report No. E-KMAT-555/03.] Prague, CVUT-FJFI-KMAT 2003 (in Czech).
[6] Siegl, J., Bystriansky, J., Hausild, P., Study of Thermal Fatigue Processes, In: New Methods of Damage and Failure Analysis of Structural Parts, Eds. Buzek, Z., Strnadel, B., Technical University of Ostrava, 2006, ISBN 80-248-1126-0.
[7] A.M.E. Standard Technical Documentation, Rest Life Assessment of Equipment and Piping of Nuclear Power Plants of VVER Type, Section IV, issued in Prague and Brno, 2004.