A systematic procedure for
developing the 3D model to
evaluate the construction
project progress
Zubair Ahmed Memon, Muhd Zaimi Abd.Majid and
Mushairry Mustaffar
Faculty of Civil Engineering, Construction Technology and Management Center,
University Technology Malaysia, Skudai, Malaysia
Abstract
Purpose– This main purpose of this study is to summarize the experience at the Construction Technology and Management Center (CTMC) to develop a Digitalizing Construction Monitoring (DCM) system by integrating 3DAutoCAD drawings and digital images. The objective of this paper is to propose a framework model for the DCM system and discuss in detail the steps involved for developing and calculating the 3D coordinate values from 2D digital images.
Design/methodology/approach– As digital images are one of the major sources of information from site, the process of measuring the project progress from images is quite challenging. This study used Photogrammetry techniques to extract the information from digital images, which can be concisely defined as the science of calculating 3D object coordinates from images, with PhotoModeler pro-version software. Issues pertaining to the quality of the 3D model derived from 2D digital images are also discussed.
Findings– A framework model for DCM was proposed and different phases were discussed. A pilot case study on Larkin Mosque Car Parking Project was conducted to check the validity of using Photogrammetry techniques to extract 3D coordinate values by using PhotoModeler Software. Preliminary results show that significant control has been achieved to extract 3D coordinate values from 2D digital images, which and can be integrated into the digitalized system to automate the construction project monitoring process.
Originality/value– The techniques discussed in this paper are used for monitoring the project progress systematically. The results of this study will be incorporated to develop a fully automated project progress monitoring system, which can be updated automatically as the project progresses automatically.
KeywordsConstruction equipment, Construction operations, Image processing equipment, Cameras, Construction industry, Malaysia
Paper typeResearch paper
Introduction
Project progress monitoring and controlling is one of the most important tasks and it ties all the construction project management techniques. Abeid and Arditi (2002)
The current issue and full text archive of this journal is available at www.emeraldinsight.com/1471-4175.htm
The authors acknowledge the contributions and support for this study by the Ministry of Science, Technology and Innovation (MOSTI), Malaysia, for the grant, under the research grant number (Vote No. 74107) and Johor Bahru City council for its cooperation. They are thankful to MMT (Civil and Structure) Construction Organization for allowing them to visit the construction site and capturing the digital images and especially thankful to Ir Dr Mahmood Tahir for assistance in obtaining required data and Mrs Masroor Ahmed for proof reading of the paper.
Developing the
3D model
187
Construction Innovation Vol. 7 No. 2, 2007 pp. 187-199
mentioned that monitoring and controlling project progress is as important as planning in the project management process. Harris and McCaffer (2001) described monitoring as the act of checking actual progress against planned schedule, where as the act of taking decisions to alter the likely future outcome and bringing the project back on the planed schedule is described as control. Hinze (1998) described monitoring as recording the actual start and finish dates for activities while the project is underway, and control relates to the analysis of the impacts of any schedule deviations and evaluation of what remedial actions should be taken. During the execution of a project, procedure for project monitoring and control and record keeping become a vital tool for mangers and other participants in the construction process. Monitoring project progress involves making measurements as the project proceeds and comparing those measurements with the desired or expected values.
Conlin and Retik (1997) mentioned that there are traditional systems that are used in construction to monitor and report the progress of the work. In these systems the updating process usually takes the form of a periodically printed progress report issued in most of the cases on monthly basis. These reports discuss the current versus planned status for the schedule, the budget, constructibility problems, quality issues including test results, contract changes including modification in design and increase/decrease in quantities, pending issues from progress meetings, as well as some pictures showing the current construction activities. The method used for developing these reports depends on daily site records, engineers’ diaries, variation order copies and other documents. Therefore, it requires a considerable effort to develop the actual project progress schedule.
Monitoring and controlling project progress is gaining an increasing interest. Manual monitoring and control have not yielded the expected results. Additionally, because manual monitoring is labor-intensive, project manager has to choose between monitoring based on rough estimates, or spending a lot of time collecting and processing data (Navon and Shpatnitsky, 2005). The latter choice distracts them from many other important duties.
Traditionally, digital images are used as a basic source of information to highlight the project progress. This study used the photogrammetry techniques to extract the information from digital images. Photogrammetry is loosely defined as a technique for
obtaining reliable measurements from photographs. Mikhail et al. (2001) described
photogrammetry as the process of deriving (usually) metric information about an object through measurements made on photographs of the object.
The basic task of many photogrammetric systems is to derive object space co-ordinates from 2D images. Analog, semi analytical and analytical techniques have been employed for a long period of time in photogrammetry to extract ground co-ordinates of objects from hardcopy images. In recent years, digital techniques are implemented in photogrammetric applications. The advantages of using digital techniques include the ease and speed of data acquisition, the inherent online and real-time capabilities, and the high degree of automation. Acquiring digital images is done either by scanning hardcopy images or by capturing the photographs directly in digital format using digital sensors. Gomes et al.(1999) presented the results of an architectural photogrammetric project using the PhotoModeler software and concluded that in comparison with the conventional photogrammetric procedure, PhotoModeler allows even greater reduction of time and cost for the production of models. This software does not require positioning and measuring of targets and stereoscopy
CI
7,2
to produce suitable photographic documents. For this study, research team decided to use the PhotoModeler Pro-version to extract 3D data from digital images, as this software has been used in different disciplines successfully, such as architecture, archaeology, forensics, building construction and renovation.
To develop the 3D model and to calculate 3D co-ordinate values from digital images, an accurate analytical method is required, which will be used for simulating and calculating the progress of the work. The objective of this paper is to propose the framework model for Digitalizing Construction Monitoring (DCM) and discuss in detail the steps involved for developing and calculating the 3D co-ordinate values from 2D digital images.
Framework model of digitalizing construction monitoring system
The intensive literature review carried out for this paper indicates that various researchers have proposed the integrated models and ideas for developing automated real-time monitoring systems for solving specific problems such as PHOTO-NET II by
Abeidet al. (2003), project performance monitoring system (PPMS) by Cheunget al.
(2004), 4D CAD system by Kanget al.(2004), 4D visualization of construction scheduling and site utilization by Chauet al.(2004) and interactive multimedia approach by Saad (1999). However, these researchers lack the scope of developing the actual physical project progress reports by simulating the digital images with 3DAutoCAD drawings.
Boochs et al. (2000) used 3D drafting and designing tools, such as AutoCAD,
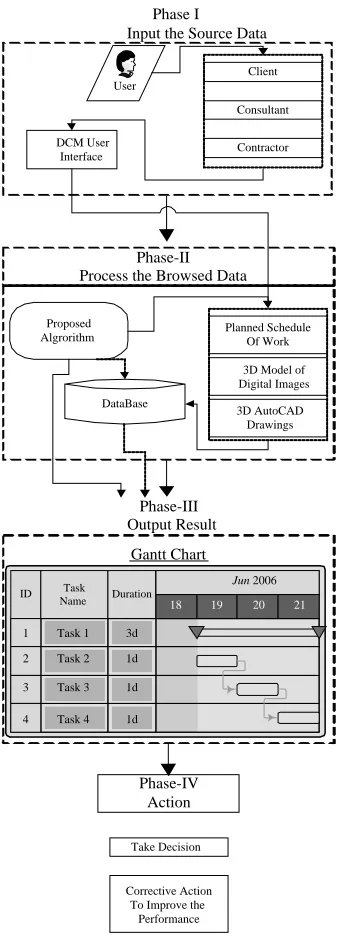
presented stereo system which utilized CAD package like AutoCAD with an object-oriented programming technique to measure the 3D co-ordinates values. To describe 3D co-ordinate measurement accessible within AutoCAD, the full functionality of the proposed system must be integrated into the AutoCAD application. A framework model for DCM was proposed and shown in Figure 1. An event-oriented computer programming was chosen to develop the user interface
for DCM. For that purpose, Visual Basicewas selected as the computer programming
language to input the information by user and integrate the information during the process phase of framework model and to show the comparison between planned and actual project progress as output source. The framework model includes four phases:
Phase-I
In the phase-I, as shown in Figure 1, user who may be client or consultant or contractor needs to browse:
. the planned schedule of work in Microsoft project;
. {*.txt} file which is developed from 3D model of digital images captured from
construction site by using photogrammetry with PhotoModeler; and
. 3DAutoCAD drawings of the project as an information input for the model.
The uploaded information is processed in the phase II of the proposed framework.
Phase-II
In this phase the database is developed from 3D CAD drawings and digital images showing 3D co-ordinates values. An algorithm is developed for detecting 3D co-ordinate information automatically from 3D CAD drawings and an another algorithm for capturing the information from planned schedule of work activities such
Developing the
3D model
Figure 1.
DCM framework model
Task Name Duration
Jun 2006
1 3d
Task 1 1
2 1d
Task 2 2
3 1d
Task 3 3
4 1d
Task 4 4
Gantt Chart Phase I
Input the Source Data
DCM User Interface
User
Consultant Client
Contractor
Phase-II Process the Browsed Data
DataBase
3D Model of Digital Images Planned Schedule
Of Work
3D AutoCAD Drawings Proposed
Algrorithm
Phase-III Output Result
Phase-IV Action
Take Decision
Corrective Action To Improve the
Performance
ID
18 19 20 21
CI
7,2
as planned start and finish date and duration of activities. The Relational Database Management System (RDBMS) is developed which contains the 3D co-ordinate values from 3D CAD drawings of all the structural members, in our case beams and columns only. The 3D co-ordinate values from the 3D Model of digital images captured from construction site are calculated. The information from the 3D Model of digital images is uploaded in the database as construction work progresses, weekly or fortnightly or considering the nature of construction work. The database developed from CAD drawings is called primary database and the one developed from digital images secondary database. Once the database is uploaded, the simulation process starts which calculates the actual progress of work by simulating the 3D co-ordinate values and calculates the progress of work in percentage. The result of simulation process is viewed in the Microsoft project as an output of the process.
Phase-III
During the phase III, the output result of simulation process is viewed. Microsoft project shows the comparison of planned schedule and actual progress of work.
Phase-IV
Based on the information gathered at previous phase, phase-IV suggests the action or any remedial measure to overcome the problems related to progress of construction. The scope of this research is limited up to phase III and suggests an appropriate action, which is to be carried out in further studies.
The close-range photogrammetry
As it is known, photogrammetry is a technique for obtaining information about the position, size and shape of an object by measuring images of it instead of measuring it directly. The term “close-range photogrammetry” is used to describe the technique when the extent of the object to be measured is less than about 100 meters and cameras are positioned close to it (Atkinson, 1996). The result of close-range photogrammetry must generally be made available very quickly after acquisition of the images so that they can be used for further processing related to the measured object and its function. Derived co-ordinates might be used for comparing the measured object with its designed size and shape in a test of conformance and some times, to produce a 3DCAD model of the object and in a few cases, drawn and dimensional plans, elevations or section may be required. The primary application of close-range photogrammetry is in industrial manufacturing and facilities management; it therefore supports the import and export of data in standard Computer Aided Design (CAD) formats, so that the photogrammetrically produced measurements and models can be easily used for design or analysis. An example of such a system is PhotoModeler, a product of EOS system (Mikhailet al., 2001). PhotoModeler accepts images from both un-calibrated and calibrated cameras. The system defines object in the scene by combinations of geometric primitives, such as cylinders or planes, and operator specifies points or edges to be used in the solution. The models produced can be exported in standard CAD or graphics formats. Different researchers utilized the PhotoModeler software
for developing the 3DModel, including Lynnerup et al. (2003) who presented the
results of a preliminary study on the PhotoModeler for facial image identification purpose, Pappaet al.(2002) who tested the software on ultra-lightweight and inflatable
Developing the
3D model
space structures at NASA Langley Research Center and Setanet al.(2005) compared the results of industrial application of PhotoModeler 5.0 with different systems and found it to be suitable for photogrammetric applications.
The following sub-section explains the steps involved in extracting the information from 2D digital images by using photogrammetry with PhotoModeler pro-version. This information can be integrated into the database of DCM system to calculate the project progress automatically. A pilot study was conducted to check the feasibility of the procedure for extracting the 3D co-ordinate values from 2D digital images captured from construction site.
Methodology to extract 3D co-ordinate values from digital images
As discussed earlier, this study implements the photogrammetry techniques to convert 2D digital images into 3D Modeler. The software used for extracting the information from digital images is PhotoModeler pro-version. PhotoModeler recommends capturing minimum of three images of an object to generate its 3D model. The images may be generated by using digital cameras or traditional 35 millimeter film prints and images should cover all the important aspects of the object, and that the covered areas of the images should overlap each other. In this study, the proposed framework model was limited to integrate the information from rectangular and square sections of construction site, especially beams and columns. After capturing the images, the different points are correlated and referenced from one image with corresponding points on the other image. Close-ups and wide shots can be combined in a project, and new details can be added at any time. The steps involved in developing the 3D Model from digital images is described below.
Step1: selecting and calibrating the camera
Modern close-range photogrammetry uses digital cameras almost exclusively rather than traditional film or analog (for video) equipment because of several advantages, some of which given below:
. The images are immediately available for computer analysis (using removable
storage media or cable connection).
. The photogrammetrist can take many extra pictures at the test site at no
additional cost using different camera and lighting settings and select the best images later on for the analysis.
. The measurement accuracy can be higher than standard 35-mm film, which can
shift according to the camera lens. Also, image transmissions (for video) are of higher quality using digital data lines.
There are also some disadvantages of digital cameras compared to film or analog (for video) equipment, which include:
. higher prices (at least three times higher than comparable film cameras), but
these are fully recovered by eliminating film and developing cost;
. maximum image resolution capability is still achieved by medium- or large-format
film cameras designed and calibrated for photogrammetry; and
. cable-length limitations of digital video systems, which is typically less than
10 m without increased noise.
CI
7,2
There are many models of scientific and professional digital cameras for consumers in the market, many with similar specifications. The camera used for this project is from Nikon Corporation’s Digital Compact Cameras Cool Pix Series. Accurate photogrammetry requires precise knowledge of the optical characteristics of camera. The physical properties of a camera, such as the focal length and lens distortion are known as the “camera parameters”. The process of measuring these properties is called camera calibration (Fryer, 2001).
The minimum information is required for each camera: sensor format (pixel size and number of pixels), principal point (intersection of optical axis with the imaging sensor), photogrammetric principal distance (distance from projection center of the lens to the principal point), and lens distortion characteristics such as K1, K2, P1, and P2 (radial and decentering).
PhotoModeler Pro-version software contains a simple procedure for computing internal camera parameters by analyzing the photographs of a grid of targets’ pattern. To obtain the data needed to calibrate a camera, six or more photographs taken from different angles of a dense point grid are needed; PhotoModeler Pro 5 (2004) user manual suggests using the eight photographs of a paper grid placed on the floor. It is a rectangular mosaic of black and white triangles with a coded dot pattern in each corner. PhotoModeler Pro-version user’s manual explains the simple procedure for camera calibration and describes the procedure for capturing the photographs from site. There is no need to measure the locations and orientations of the camera when taking these photographs because this information is automatically calculated by the software. Camera settings such as the manual focus distance and the zoom setting affect camera parameters. It is, therefore, necessary to ensure that the camera settings remain the same each time photographs are taken. The camera settings used to make measurements must also be the same as the settings used to make the camera calibration photographs. The accuracy of the camera parameters is critical for obtaining accurate photogrammetry measurements.
Step 2: Designing the photogrammetric geometry and taking the photographs
Designing the photogrammetric geometry involves selecting an adequate number and distribution of camera positions. A general guideline is to place cameras at convergent viewing angles, in both the horizontal and vertical directions if possible, at about 70-908angular separation,^308. A key feature of close-range photogrammetry with
bundle adjustment is that the camera locations and orientations do not have to be measured, but are calculated by the software along with the desired target co-ordinates. The bundle adjustment is the data reduction procedure preferred by the photogrammetric community and uses an iterative nonlinear least squares solution. A brief discussion on this is provided in step 6.
Each point of interest on the object must appear in at least two photographs for 3D determination, although four or more photographs are preferred for improved least-square accuracy and reliability. With knowledge of at least one other constraint, such as knowing that all object points lie on a plane, photogrammetry can also use a single camera location. This capability is particularly useful for real-time measurements to reduce computational requirements.
Photogrammetry requires targets with good contrast that are in reasonable focus. Generally, the best way to take the photographs is using a small aperture setting
Developing the
3D model
(f/8 or higher) to obtain good depth of field (i.e. the depth in the object that is simultaneously in focus) while minimizing, or even eliminating, focusing requirements. By using a small aperture and focusing the camera to optimize depth of field, it is possible to simultaneously focus all objects in the picture from a short distance in front of the camera out to the horizon. However, using a small aperture requires a slower shutter speed or brighter illumination to obtain adequate image exposure. Tripods
should be used with exposure times longer than about 30mseconds to avoid camera
movement. Most consumer digital cameras have zoom lenses, and it is important to be sure that they are set properly. Normally, minimum or maximum zoom setting (focal length) and infinity focus are used to simplify the process and improve repeatability. Any changes in the zoom or focus setting require new camera calibration.
Step 3: Selecting data analysis software and importing the digital images
Close-range photogrammetry has traditionally been a specialized technology with relatively few software developers. Most photogrammetry softwares consists of one of the following three types:
(1) part of a turnkey system and interface with one particular camera only; (2) developed and used by an individual or consulting firm and not available for
sale; or
(3) research code written at universities and used primarily by its developers and students.
However, with rapidly increasing capabilities of digital cameras and personal computers in recent years, some general-purpose photogrammetry softwares have appeared in the market. These products can analyze images from any source. PhotoModeler Pro, one of the consumer software products has been used successfully throughout this research. The remainder of the paper describes the photogrammetric analysis the images of Larkin Mosque Car Pak Johor Bahru Malaysia, with PhotoModeler Pro-version.
First, the images are transferred from the cameras to the computer by using USB flash drive. Before pictures can be transferred (copied) to computer, the supplied software must be installed. The PhotoModeler software is then started, and the images are selected and imported into the program for analysis. Next, the user should associates each image with its specific, previously calibrated camera. This allows the proper internal camera parameters, obtained from calibration, to be used with each image.
Step 4: Marking the target locations in the each image
Data analysis begins by marking the locations of the targets in the images. In other words, thex-yco-ordinates of the centroid of each elliptical target, projected with dots in this case, must be marked as accurately as possible in each image. An important aspect of precision photogrammetry is the availability of sub-pixel interpolation algorithms that locate the center of solid-colored ellipses to an accuracy of one-tenth of a pixel or less (West and Clarke, 1990). The 3D spatial measurement precision obtained with photogrammetry is directly related to this sub-pixel interpolation factor.
PhotoModeler contains a robust sub-pixel marking tool for circulate targets. Individual targets are marked by clicking them with the mouse, or all targets in a rectangular region of the image can be selected and marked collectively. The latter approach is called automatic marking or auto-marking and although it is not entirely
CI
7,2
automatic, it greatly simplifies sub-pixel target marking in projects with large numbers of points, such as in dot-projection tests.
Step 5: Identifying points in the images referring to the same physical point
The second step of the data analysis is to match the marked points in one image with their corresponding points in the other images. This process is called referencing the points. When a point is initially marked on an image, it is assigned a unique identification number. Then, when a marked point on one image is referenced to a marked point on another image, the software reassigns the same identification number to both points indicating they are the same physical location on the structure. In the beginning of the data analysis, the user must perform this referencing operation manually until a certain minimum number of points (at least six) are referenced on all photos, at which time the user processes the data. Processing the data runs a photogrammetric bundle adjustment algorithm, described in step 6.
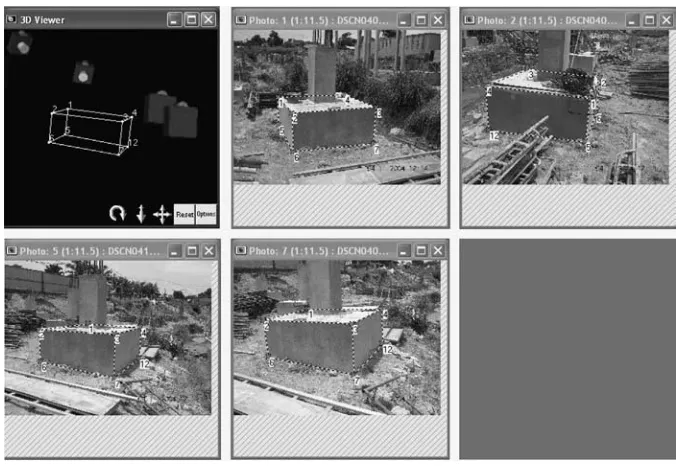
When these calculations are finished the user returns to the referencing phase. At this point, automatic helper tools are available to speed up the process. These tools appear as a result of the initial processing of the data, which yields the spatial location and orientation angles of the cameras. Now the images are said to be oriented. In a typical PhotoModeler project without control points especially points with known co-ordinates, the camera locations and orientations calculated above are relative quantities with respect to camera. At this point it is good idea to verify that the software positioned the cameras properly, which can be checked easily in the graphical 3D viewer available in PhotoModeler. The viewer shows small camera icons at their locations and orientations relative to targets with calculated 3D co-ordinates, displayed as small dots. Controls are available to rotate or resize the 3D graphic for better viewing as shown in Figure 2.
Figure 2.
Sample screen of marking on reference points and 3D viewer with camera icon of the construction of pile cap
Developing the
3D model
Step 6: Processing scale, rotating the data and exporting for additional analysis
The third and final step of the data analysis is to “process” the data using the bundle-adjustment algorithm. In the technical literature, several variations of the bundle adjustment method appear, with different user options and levels of sophistication (Granshaw, 1980). As discussed in the preceding section, the data are processed initially after referencing at least six points in each image. This orients the images. Then the user returns to referencing (and marking, if necessary) additional points. It is often better not to reference all remaining points at this time, but stop after adding some additional points and reprocess the data.
The bundle adjustment algorithm aids in doing two things simultaneously computing the:
(1) spatial locations and orientation angles of each camera; and
(2) 3D co-ordinates of all referenced points and estimating their measurements precision.
Bundle adjustment is always an iterative solution (since the underlying math is nonlinear), and hence the calculations continue until a specified consistency or maximum number of iterations occurs. If the object points are distributed on the structure and the photographs are at suitable angles, the bundle adjustment will usually run successfully. In many cases, camera self-calibration or field-calibration are added to the bundle adjustment equations during the data processing to improve the internal consistency of the solution and the accuracy of the point co-ordinates.
Testing on a pilot case study
The methodology for developing the 3D model from digital images is implemented on Car Parking Project for Larkin Mosque, Larkin Johor Malaysia according to the steps described above. Initial results shows that the co-ordinates of all targets were successfully determined using successive bundle adjustment calculations. The result in Figure 2 shows the 3D static shape of the pile cap. Following each bundle adjustment, the camera locations and orientations were displayed in the PhotoModeler 3D viewer and tables in PhotoModeler show the information about the:
(1) photo table; (2) point table; (3) edge table; (4) curve table; (5) surface table; and (6) cylinder table.
The cameras always appeared to be in their proper positions and orientations, adding confidence that the software was working properly. Recall that the software computes the camera positions and orientations from the images. The 3D model created by using PhotoModeler, controls all options for exporting all the 3D model data for use in external CAD, graphics, animation and rendering packages. Tables were created similar to spread sheets with rows and columns of data and export the contents of the currently visible table data were exported to an ASCII text file. For this research,
CI
7,2
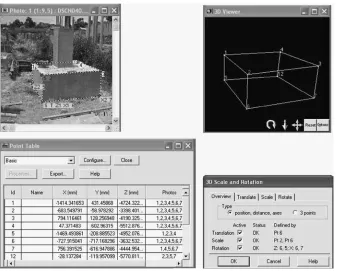
the point table was integrated into the database and compared with database developed by AutoCAD drawings and percentage of the progress was calculated and the actual physical progress bar chart was developed. The discussion on this is out of scope of this paper. The Figure 3 shows the point table and mentions the co-ordinate values of different points for the structure and an overview of the described points for translating, scaling and rotation.
Discussion
The DCM model streamlines the job of construction monitoring and progress reporting. From the management point of view, this system assists the contracting parties (Client, Consultant, and Contractor) to easily produce the project’s physical progress reports. The smooth functioning of DCM relies heavily on the digital photographs and the database system developed from photographs and AutoCAD drawings. As such, DCM user needs to be equipped with PhotoModeler software, AutoCAD 2000 and Microsoft project to develop the reliable database and output result. The methodology for developing the 3D Model and computing the 3D co-ordinate values from digital images were successfully achieved. These co-ordinate values are stored into the database as shown in Figure 1. By successfully implementing the PhotoModeler on pilot case study, the result of 3D co-ordinate values’ table can be used as a framework model to integrate the process of project progress monitoring.
Figure 3.
Sample screen of showing the co-ordinate values, orientation and camera parameters
Developing the
3D model
Conclusions
This paper concludes by proposing the framework system to digitalize the construction monitoring process and the process of extracting the information from 2D digital images has been explained by using photogrammetry techniques with PhotoModeler software. By implementing this technique on selected pilot case study of Larkin Mosque Car Parking Project at Larkin, Johor, Malaysia, the 3D co-ordinate values were extracted from digital images. The achieved 3D co-ordinate values are advised to be uploaded into DCM user interface for integration purpose and to calculate the project progress in percentage by comparing the values from digital images and AutoCAD drawings. Initial results indicate that the use of the off-the-shelf digital camera and software technologies are able to provide accuracy and help in developing the as-built schedule. The initial results from this project will be incorporated with the current research which is to develop the CMP system that can emulate the human brain and update the project progress reports automatically. It is authors’ belief that by implementing the proposed prototype system in the construction industry, the accuracy of developing the reports will be improved, productivity will be counterchecked with ease and within a short duration of time and it will also help to improve the decision-making process.
References
Abeid, J.N. and Arditi, D. (2002), “Linking time-lapse digital photography to project management”,Journal of Computing in Civil Engineering, ASCE, Vol. 16 No. 4, pp. 269-79. Abeid, J.N., Allouche, E., Arditi, D. and Hayman, M. (2003), “PHOTO-NET-II: a computer-based
monitoring system applied to a project management”, Journal of Automation in
Construction, Vol. 12, pp. 603-16.
Atkinson, K.B. (1996),Close Range Photogrammetry and Machine Vision, Whittles Publishing Company, Caithness.
Boochs, F., Gehrhoff, A. and Neifer, M. (2000), An Object-oriented Stereo System for
3D-Measurement, Vol. XXXIII, IAPRS, Amsterdam.
Chau, K.W., Anson, M. and Zhang, J.P. (2004), “Four dimensional visualization of construction scheduling and site utilization”, Journal of Construction Engineering and Management, Vol. 130 No. 4, pp. 598-606.
Cheung, S.O., Suen, H.C.H. and Cheung, K.K.W. (2004), “PPMS: a web based construction project
performance monitoring system”, Journal of Automation in Construction, Vol. 13,
pp. 361-76.
Conlin, J. and Retik, A. (1997), “The applicability of project management software and advanced IT techniques in construction delays mitigation”, International Journal of Project Management, Vol. 15 No. 2, pp. 107-20.
Fryer, J.G. (2001), “Camera calibration, close-range photogrammetry and machine vision”, in Atkinson, K.B. (Ed.),Camera Calibration, Whittles Publishing, Caithness, pp. 156-79. Gomes, J.M.G., Prado, W., da, S., Erwes, H. and Koatz, G.D. (1999), “A photogrammetric project in
Brazil: the use of the PhotoModeler software”, available at: http://cipa.icomos.org/ fileadmin/papers/onlinda/99C3B.pdf (accessed June 2004).
Granshaw, S.I. (1980), “Bundle adjustment methods in engineering photogrammetry”,
Photogrammetric Record, Vol. 10 No. 56, pp. 181-207.
Harris, F. and McCaffer, R. (2001),Modern Construction Management, 5th ed., Black well Science Ltd, Malden, MA.
CI
7,2
Hinze, J.W. (1998),Construction Planning and Scheduling, Prentice-Hall, Upper Saddle River, NJ. Kang, L.S., Jee, S.B., Kim, C.H. and Lee, Y.S. (2004), “Simplified information management methodology to link 2D/3D objects in 4D systems for civil engineering projects”,
Proceedings of Construction Applications of Virtual Reality (CONVR) at ADETTI/ISCTE, Lisbon, pp. 151-4.
Lynnerup, N., Andersen, M. and Lauritsen, H.P. (2003), “Facial image identification using PhotoModeler”,Journal of Legal Medicine, Vol. 5, pp. 156-60.
Mikhail, E.M., Bethel, J.S. and McGlone, J.C. (2001),Introduction to Modern Photogrammetry, Wiley, New York, NY.
Navon, R. and Shpatnitsky, R. (2005), “A model for automated monitoring of road construction”,
Journal of Construction Management and Economics, Vol. 23, pp. 941-51.
Pappa, R.S., Jones, T.W., Black, J.T., Walford, A., Robson, S. and Shortis, M.R. (2002), “Photogrammetry methodology development for goassamer spacecraft structures”, National Aeronautics and Space Administration NASA/TM-2002-211739.
PhotoModeler (2004), User Manual for PhotoModelerw Pro Version 5, Eos System Inc.,
Vancouver, BC.
Saad, I.M.H. (1999), “The project reporter: multimedia progress reporting for construction projects”, Vol. 10, pp. 181-207, Construction Information Digital Library, available at: http://itc.scix.net/paper W78-1999-2358.content
Setan, H., Ibrahim, M.S. and Majid, Z. (2005), “Precise measurement and 3D modeling for medical and industrial applications”, FIG working Week and GSDI-8, Cairo, 16-21 April. West, G.A.W. and Clarke, T.A. (1990), “A survey and examination of sub pixel measurement
techniques”,SPIE Proceedings No. 1395, pp. 456-63.
Corresponding author
Zubair Ahmed Memon can be contacted at: [email protected]
Developing the
3D model
199
To purchase reprints of this article please e-mail:[email protected]