University of Windsor University of Windsor
Scholarship at UWindsor
Scholarship at UWindsor
Electronic Theses and Dissertations Theses, Dissertations, and Major Papers
2010
Evidence Fusion using D-S Theory: utilizing a progressively
Evidence Fusion using D-S Theory: utilizing a progressively
evolving reliability factor in wireless networks
evolving reliability factor in wireless networks
Aqila Dissanayake University of Windsor
Follow this and additional works at: https://scholar.uwindsor.ca/etd
Recommended Citation Recommended Citation
Dissanayake, Aqila, "Evidence Fusion using D-S Theory: utilizing a progressively evolving reliability factor in wireless networks" (2010). Electronic Theses and Dissertations. 320.
https://scholar.uwindsor.ca/etd/320
EVIDENCE FUSION USING D-S THEORY: UTILIZING A PROGRESSIVELY EVOLVING RELIABILITY FACTOR IN WIRELESS NETWORKS
By
Aqila Dissanayake
A Thesis
Submitted to the Faculty of Graduate Studies Through the School of Computer Science In Partial Fulfillment of the Requirements for
The Degree of Master of Science at the University of Windsor
Windsor, Ontario, Canada
2009
EVIDENCE FUSION USING D-S THEORY: UTILIZING A PROGRESSIVELY EVOLVING RELIABILITY FACTOR IN WIRELESS NETWORKS
By
Aqila Dissanayake
APPROVED BY:
______________________________________________ Dr. D. Kao
Odette School of Business
______________________________________________ Dr. R. Kent
School of Computer Science
______________________________________________ Dr. Akshai Aggarwal, Advisor
School of Computer Science
______________________________________________ Dr. Luis Rueda, Chair of Defense
School of Computer Science
AUTHOR’S DECLARATION OF ORIGINALITY
I hereby certify that I am the sole author of this thesis and that no part of this thesis has been published or submitted for publication.
I certify that, to the best of my knowledge, my thesis does not infringe upon anyone’s copyright nor violate any proprietary rights and that any ideas, techniques, quotations, or any other material from the work of other people included in my thesis, published or otherwise, are fully acknowledged in accordance with the standard referencing practices. Furthermore, to the extent that I have included copyrighted material that surpasses the bounds of fair dealing within the meaning of the Canada Copyright Act, I certify that I have obtained a written permission from the copyright owner(s) to include such material(s) in my thesis and have included copies of such copyright clearances to my appendix.
ABSTRACT
The Dempster-Shafer (D-S) theory provides a method to combine evidence from multiple nodes to estimate the likelihood of an intrusion. The theory’s rule of combination gives a numerical method to fuse multiple pieces of information to derive a conclusion. But, D-S theory has its shortcomings when used in situations where evidence has significant conflict. Though the observers may have different values of uncertainty in the observed data, D-S theory considers the observers to be equally trustworthy. This thesis introduces a new method of combination based on D-S theory and Consensus method, that takes into consideration the reliability of evidence used in data fusion. The new method’s results have been compared against three other methods of evidence fusion to objectively analyze how they perform under Denial of Service attacks and Xmas tree scan attacks.
DEDICATION
ACKNOWLEDGEMENTS
I would like to express my sincere gratitude to my supervisor, Dr. Akshai Aggarwal, for guiding me throughout the three years I’ve been a student at the University of Windsor. Without his help and direction I would not have been able to complete my thesis.
I would like to thank my committee members, Dr. Robert Kent and Dr. Diana Kao, for their valuable comments and suggestions towards my thesis. I would also like to thank Dr. Luis Rueda for being the chair in the examination committee.
TABLE OF CONTENTS
AUTHOR’S DECLARATION OF ORIGINALITY ... III ABSTRACT ... IV DEDICATION ... V ACKNOWLEDGEMENTS ... VI LIST OF FIGURES ... X LIST OF TABLES ... XII
1 INTRODUCTION ... 1
2 DEFINITIONS AND RELATED CONCEPTS ... 2
2.1 Dempster Shafer Theory ... 2
2.1.1 The Frame of Discernment (Θ) ... 3
2.1.2 BPA (Basic Probability Assignment) ... 3
2.1.3 Belief (Bel)... 3
2.1.4 Plausibility Function (Pl) ... 3
2.1.5 Belief Range... 4
2.1.6 Dempster’s Combination Rule ... 4
2.2 CONSENSUS OF OPINIONS AND RELATED DEFINITIONS ... 5
2.2.1 Disbelief Function ... 5
2.2.2 Uncertainty Function ... 5
2.2.3 Relative Atomicity ... 5
2.2.4 Opinion ... 6
2.2.5 Consensus ... 6
2.3 Denial of Service (DoS) Attack ... 7
2.4 Transmission Control Protocol (TCP)... 7
2.5.1 Xmas Tree Scan ... 9
2.5.2 Packet Design for the Xmas Tree Scan... 10
3 EQUIPMENT AND SOFTWARE USED IN THE EXPERIMENTS... 11
3.1 Aruba AP-70 Sensors ... 11
3.2 CommView ... 12
3.3 Nmap/Zenmap ... 12
3.4 Snort ... 13
3.5 RF Protect ... 14
3.6 Wireshark ... 15
3.7 Loadcontrol ... 16
4 SURVEY OF DEMPSTER-SHAFER THEORY IN DATA FUSION ... 19
4.1 Theory of Evidence and Dempster-Shafer Theory in Data Fusion ... 19
4.2 Data Used in Experiments ... 20
4.3 Frame of Discernment ... 20
4.4 Application of D-S in Anomaly Detection ... 21
4.4.1 Experiments of Yu and Frincke ... 21
4.4.2 Experiments of Chen and Aickelin ... 23
4.4.3 Experiments of Chatzigiannakis et al ... 24
4.5 Application of D-S to Detect DoS and DDoS Attacks... 27
4.5.1 Experiments of Siaterlis et al. of the NTUA ... 27
4.5.2 Experiments of Hu et al. ... 33
4.6 Advantages of Using D-S Theory ... 35
4.7 Disadvantages of Using D-S Theory ... 36
5 WEAKNESSES OF THE EXISTING METHODS ... 36
5.2 Reliability of Evidence in Fusion ... 36
5.3 Why Do We Need to Consider Reliability of Evidence? ... 39
5.4 Weakness’ of the Method Used by Yu and Frincke ... 39
6 OUR RESEARCH AND PROPOSED IMPROVEMENTS ... 42
6.1 Intrusion Detection in Wireless Networks ... 42
6.2 Increased Number of Sensors ... 42
6.3 Sensor Diversity Increased ... 43
6.4 Progressively Evolving Reliability Factor (PERF) ... 43
6.5 New Method of Basic Probability Assignment (Mass Calculation) ... 44
6.6 New Rule of Combination... 46
7 PERF D-S CALCULATION ... 49
7.1 Evidence Gathering ... 49
7.2 Belief Mass Calculation and Combination ... 51
8 EXPERIMENTS AND ANALYSIS ... 57
8.1 Reliability of Sensors and CPU Utilization in DoS Experiments ... 58
8.2 Reliability of Sensors and CPU Utilization in Xmas Tree Experiments... 64
8.3 DoS Attack Experiments and Analysis ... 68
8.4 Xmas Tree Scan Experiments and Analysis ... 79
9 CONCLUSION ... 90
BIBLIOGRAPHY ... 92
APPENDIX A ... 96
A.1. E-mail Communication with Aruba Networks about Configuring AP-70 Sensors ... 96
LIST OF FIGURES
Figure 5-1. Relationship between Plausibility and Belief ... 4
Figure 5-2. TCP Header ... 8
Figure 5-3. Closed Port in a Xmas Scan ... 9
Figure 5-4. Open or Filtered port in a Xmas Scan ... 10
Figure 5-5. Xmas Tree Packet with FIN PSH URG Flags Set ... 11
Figure 6-1. Aruba AP-70 Sensor ... 11
Figure 6-2. CommView Hex Editor... 12
Figure 6-3. Snort IDS used in Intrusion Detection ... 14
Figure 6-4. RF Protect Console ... 15
Figure 6-5. Wireshark at work ... 16
Figure 6-6. Setting Processor Affinity 1 ... 17
Figure 6-7. Setting Processor Affinity 2 ... 17
Figure 6-8. Setting Processor Priority to Realtime ... 18
Figure 6-9. Load Control Software at Work ... 18
Figure 9-1. M(Xmas) is an increasing Function of R ... 45
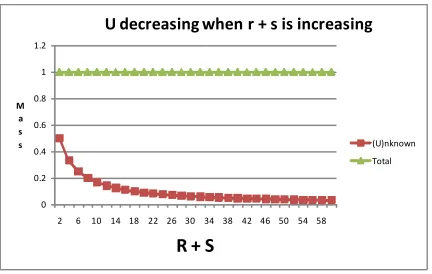
Figure 9-2. M (¬Xmas) is an increasing Function of S ... 46
Figure 9-3. U is a decreasing Function of (R + S) ... 46
Figure 11-1. Setup of the test-bed (Sensors, Computers and Router) ... 58
Figure 11-2. Average Percentage of packets captured at various CPU Utilizations ... 61
Figure 11-3. Average Relative Reliability of Sensors with increasing CPU Utilizations ... 63
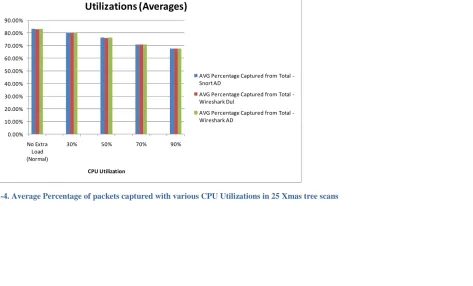
Figure 11-4. Average Percentage of packets captured with various CPU Utilizations in 25 Xmas tree scans ... 66
Figure 11-5. Average Relative Reliability of Sensors with Various CPU Utilizations in 25 Xmas Tree Scans ... 68
Figure 11-7. CommView Software Configured to Flood Packets at 5000 Packets per Second ... 70
Figure 11-8. DoS Attack Probability After Combination for 30 DoS Attacks ... 72
Figure 11-9. DoS Attack Probability After Combination Excluding Yu and Frincke’s method for 30 DoS Attacks ... 73
Figure 11-10. Average Probability of 30 DoS attacks at various CPU Utilizations ... 75
Figure 11-11. . Combined Uncertainty in 30 DoS Attacks ... 77
Figure 11-12. Average Combined Uncertainty with CPU Utilization for 30 DoS Attacks ... 78
Figure 11-13. Average Combined Uncertainty with CPU Utilization for 30 DoS Attacks ... 79
Figure 11-14. Comparative Results of the 4 Combination Methods in 30 Xmas Tree Scans ... 82
Figure 11-15. Comparative Results of the Combination Methods in 30 Xmas Tree Scans excluding Yu and Frincke’s method ... 83
Figure 11-16. - Combined Uncertainty in 30 Xmas Tree Scans ... 86
Figure 11-17. Average Combined Uncertainty with CPU Utilization for 30 Xmas Tree Scans .. 87
Figure 11-18. Average Probability of 30 Xmas Attacks at Various CPU Utilizations Excluding Yu and Frincke ... 88
LIST OF TABLES
Table 6-1 - Zenmap doing an Xmas Tree Scan ... 13
Table 10-1. Point Assignment for RF Protect Evidence in a DoS attack ... 50
Table 10-2. Point Assignment for Snort in a DoS attack ... 50
Table 10-3. Point Assignment for Wireshark in a DoS attack ... 50
Table 10-4. Point Assignment for RF Protect Evidence in a Xmas attack ... 50
Table 10-5. Point Assignment for Snort in a Xmas attack ... 51
Table 10-6. Point Assignment for Wireshark in a Xmas attack ... 51
Table 10-7. Evidence from AP-70 Sensors... 52
Table 10-8. Evidence from Snort Sensor ... 52
Table 10-9. Evidence from Wireshark Sensor (1) ... 52
Table 10-10. Evidence from Wireshark Sensor (2) ... 52
Table 10-11. Example: PERF D-S Combination for a Xmas Tree Scan with Sensors, assumed to be Totally Reliable ... 53
Table 10-12. Example PERF D-S Combination for a Xmas tree scan with 3 sensors having reduced reliability ... 55
Table 11-1. Computers, Router and Sensors used in the Experiment ... 57
Table 11-2 Reliability Values (Averages) from 30 experiments ... 60
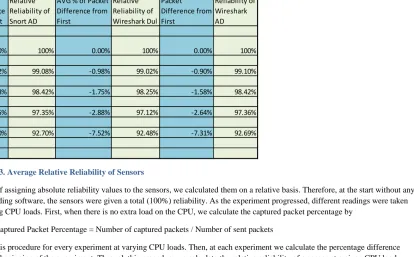
Table 11-3. Average Relative Reliability of Sensors... 62
Table 11-4. Average packets captured at various CPU Utilizations in Xmas tree scans ... 65
Table 11-5. Relative reliabilities with varying CPU Utilizations in Xmas tree scans ... 67
Table 11-6. Comparative Results of the 4 Combination Methods in 30 DoS Attacks ... 71
Table 11-7. Average Results from the Combination of Evidence from the 30 DoS attacks ... 75
Table 11-8. Comparative Results for m12(Uncertainty) During 30 DoS Attacks ... 76
Table 11-9. Averages of Combined Uncertainties in 30 DoS Attacks ... 78
1 INTRODUCTION
The rapid growth of the Internet and its related network infrastructure is changing computing as we know it. Especially in the last decade we have seen the greatest leap in wireless technology which has given new meaning to networking. Unlike old days where one needed a physical connection to connect to the Internet, these days one can connect to the Internet using a wireless network connection through a computer or even one’s mobile phone device. Unfortunately, along with the facility of wireless connectivity have come risks of malicious intrusions. Though intrusion detection in wired networks is a well explored subject, intrusion detection in wireless networks is yet to be studied to the same extent. Timely detection of intrusions in wireless networks and appropriate responses remain extremely important areas of research. A security breach can cause mission critical systems to be unavailable to end-users causing millions of dollars worth of damage. If the next generation of Internet and network technology is to operate successfully, it will require a set of tools to analyze wireless networks and detect and prevent intrusions. A large distributed network, particularly with facilities of wireless connectivity, would need multiple sensors to be able to catch intrusions of all types. Alerts may be generated by the sensors or the associated Intrusion Detection Systems. These alerts provide evidence, which has to be used for generating reliable information about intrusions, even though it is known that none of the sensors or intrusion detection systems are fully reliable.
According to the Wikipedia, intrusion detection is the act of detecting actions that attempt to compromise the confidentiality, integrity or availability of a resource. Intrusion detection is a difficult process that requires security practitioners to have a deep understanding of networks and their functionality. Finding an accurate attack signature is extremely challenging even if we know the network is under attack. This is because the signature needs to be narrow enough to differentiate between normal legitimate traffic and attack traffic. Good intrusion detection is completely dependent on this property. If the attack signature is not accurate it will cause “False Positives” and “False Negatives”. If the intrusion detection system gives too many false positives, that would mean that the security practitioner who is responsible for checking the alerts and tracing them would waste a lot of time on false positives. On the other hand, if the intrusion detection system does not give an alert when there is an actual attack that would be bad as this means that the security practitioner is unaware that his system is under attack. Though, some intrusion detection systems automate some aspects of the process, the intervention of the security practitioner is very much required to complete the process of good intrusion detection. Ideally, the goal of a good intrusion detection system is to lower the false positive rate and the false negative rate.
measures to track down the attackers and discourage future attacks. There are many intrusion detection systems (IDS) and intrusion prevention systems (IPS) in the market today which facilitate in identifying intrusions and taking necessary preventative measures. New techniques are developed every year to make these IDS/IPS systems work more accurately and efficiently. One of these new techniques is to combine evidence gathered through multiple systems or access points to arrive at a more accurate result. The theory associated with this new technique is known as the Dempster-Shafer Theory of Evidence. The Dempster-Shafer theory is also known as D-S theory of evidence.
Research on intrusion detection has been going on for more than two decades. However research on intrusion detection using the D-S theory of evidence only started after the year 2000. Since then researchers have published around twenty papers that try to improve the idea of data fusion in intrusion detection using the Dempster-Shafer theory.
The National Technical University of Athens (NTUA) has been one of the main universities that has been conducting research on intrusion detection using the D-S theory. Three of the leading researchers in this field are also from NTUA. Vasilis Maglaris and Basil Maglaris of the NTUA have both published two papers on multi sensor data fusion for Denial of Service (DoS) detection using the D-S theory of evidence. Christos Siaterlis of the NTUA is the only researcher so far to publish three papers on intrusion detection using the D-S theory. Researchers from the Florida International University (FIU) have also been involved in research related to D-S theory and intrusion detection. Two of their researchers, Te-D-Shun Chou and Kang K. Yen have also published two papers each in the area. No other researcher in this field has published more than one paper.
2 DEFINITIONS AND RELATED CONCEPTS
2.1 Dempster Shafer Theory
The Theory of Evidence is a branch of mathematics that is concerned with using evidence to calculate the probability of an event. The Dempster-Shafer theory (D-S theory) is a theory of evidence used to combine separate pieces of evidence to calculate the probability of an event. The Dempster-Shafer theory was introduced in the 1960’s by Arthur Dempster [1968] and developed in the 1970’s by Glenn Shafer [1976]. According to Glen Shafer the D-S theory is a generalization of the Bayesian theory of subjective probability.
the final state of the network. The most important part of this theory is Dempster’s rule of combination which combines evidence from two or more sources to form inferences.
In the Following sub-section we shall describe some of the important definitions that are needed to understand this thesis.
2.1.1 The Frame of Discernment (Θ)
A complete (exhaustive) set describing all of the sets in the hypothesis space. Generally, the frame is denoted as Θ. The elements in the frame must be mutually exclusive. If the number of the elements in the set is n, then the power set (set of all subsets of (Θ) will have 2n elements.
2.1.2 BPA (Basic Probability Assignment)
The theory of evidence assigns a belief mass to each subset of the power set. It is a positive number between 0 and 1. It exists in the form of a probability value.
If Θ is the frame of discernment, then a function, m: 2Θ [0, 1] is called a BPA, whenever m (∅) = 0, and
m (A) ≥ 0, ∀A ⊆Θ Σ m (A) = 1 and A ⊆Θ
2.1.3 Belief (Bel)
Given a frame of discernment Θ and a body of empirical evidence {m (B1), m (B2), m (B3)….}, the belief committed to A εΘ is
Bel (A) = Σ m (Bi) B ⊆ A
Also, Bel (Θ) = 1
The plausibility (Pl) is the sum of all the masses of the sets B that intersect the set of interest A:
Pl (A) = Σ m (Bi) , B | B ⋂ A ≠∅
2.1.5 Belief Range
The interval [Bel (A), Pl (A)] is called the belief range. Plausibility (Pl) and Belief (Bel) are related as follows
Pl (A) = 1 – Bel (Ᾱ)
Figure 2-1. Relationship between Plausibility and Belief
2.1.6 Dempster’s Combination Rule
The combination called the joint mass (m12) is calculated from the two sets of masses m1 and m2.
B ⋂ C = A, Σ m1(B) m2(C)
m12 (A) = --- m12 (A) ≠ ∅
1 - [B ⋂ C = ∅, Σ m1(B) m2(C)] m12 (A) = Combined belief of the hypothesis A
m1 (B) = Belief committed to B as seen by the first observer
m2 (C) = Belief committed to C as seen by the second observer
K represents basic probability mass associated with conflict. K is calculated by summing the products of the BPA’s of all sets where the intersection is null.
2.2 CONSENSUS OF OPINIONS AND RELATED DEFINITIONS
The definitions in this sub section are derived from the paper “A logic for uncertain probabilities” by Dr. Audun Jøsang [Jøsang, 2000] and “The Consensus Operator for Combining Beliefs” [Jøsang, 2002].
2.2.1 Disbelief Function
Let Θ be a frame of discernment, and let mΘ be a Belief Mass Assignment (BMA) (same as BPA or Basic Probability Assignment) on Θ. Then the disbelief function corresponding with mΘ is the function d: 2Θ [0, 1] defined by:
d(x) = Σ mΘ(y), x,y ε 2Θ
y ⋂ x = ∅
2.2.2 Uncertainty Function
Let Θ be a frame of discernment, and let mΘ be a Belief Mass Assignment (BMA) on Θ. Then the uncertainty function corresponding with mΘ is the function u: 2Θ [0, 1] defined by:
u(x) = Σ mΘ(y), x,y ε 2Θ
y ⋂ x ≠ ∅
Total uncertainty can be expressed by assigning all the belief mass to Θ. The belief function corresponding to this situation is called the vacuous belief function. A BMA with zero belief mass assigned to Θ is called a dogmatic BMA.
2.2.3 Relative Atomicity
Let Θ be a frame of discernment, and let x,y ε 2Θ. Then for y ≠∅ the relative atomicity of x to y is the function a : 2Θ [0, 1] defined by:
It can be observed that x ⋂ y = ∅ a(x/y) = 0 and that y ⊆ x a(x/y) = 1. In all other cases the relative atomicity will be a value between 0 and 1.
The relative atomicity of an atomic state to its frame of discernment, denoted by a(x/ Θ), can simply be written as a(x). If nothing else is specified, the relative atomicity of a state then refers to the frame of discernment.
2.2.4 Opinion
Let Θ be a binary frame of discernment with 2 atomic states x and ¬ x, and let mΘ be a BMA on Θ where b(x), d(x), u(x), and a(x) represent the belief, disbelief, uncertainty, and relative atomicity functions on x in 2Θ respectively. Then the opinion about x, denoted by wx, is the tuple defined by:
wx ≡ (b(x), d(x), u(x), a(x)) 2.2.5 Consensus
The consensus opinion of two opinions is an opinion that reflects both opinions in a fair and equal way.
Let WxA = (bxA, dxA, uxA, axA) and WxB= (bxB, dxB, uxB, axB) be opinions respectively held by agents A and B about the same proposition x. Let WxA,B = (bxA,B, dxA,B, uxA,B, axA,B) be the opinion such that, K = uxA + uxB - uxA uxB. When uxA, uxB 0, the relative dogmatism between WxA and WxB is defined by γ so that γ = uxB/ uxA. Then WxA,B is called the consensus between WxA and WxB , representing an imaginary agent [A, B]’s opinion about x, as if she represented both A and B.
For K ≠ 0
(1) bxA,B = (bxA uxB + bxB uxA) / K (2) dxA,B= (dxA uxB + dxB uxA) / K (3) uxA,B = (uxA uxB)/K
(4) axA,B = axB uxA + axA uxB – (axA + axB) uxA uxB/ uxA + uxB - 2uxA uxB
axA,B = (axA + axB)/2 when uxA, uxB = 1
bxA = rA/rA+sA+2
dxA = sA/rA+sA+2 where u ≠ 0
The parameters r represents the amount of evidence supporting the actual event and the parameters s represents the amount of evidence supporting its negation.
For K = 0
(1) bxA,B = γ bxA + bxB / γ + 1 (2) dxA,B= γ dxA + dxB / γ + 1 (3) uxA,B = 0
(4) axA,B = γ axA + axB / γ + 1
2.3 Denial of Service (DoS) Attack
According to the Wikipedia, “a service attack (DoS attack) or distributed denial-of-service attack (DDoS attack) is an attempt to make a computer resource unavailable to its intended users.” One of the common methods of attack involves saturating the target (victim) machine with communication requests that it cannot process legitimate requests or it responds so slowly as to render itself unavailable [Denial of Service Attack, Wikipedia]. In wireless networks, to perform a Denial of Service Attack, one requires a high-powered network interface card (NIC) [Denial of Service Attack, Wikipedia]. In our research we utilized a laptop computer equipped with a Wireless N, NIC to perform all DoS attacks.
According to [Denial of Service Attack, Wikipedia], the United States Computer Emergency Response Team defines symptoms of denial-of-service attacks to include:
1. Unusually slow network performance 2. Unavailability of a particular web site 3. Inability to access any web site
4. Dramatic increase in the number of spam emails received
In our research we extensively use packet flooding DoS attacks that saturate the victim with packets. This reduces the available bandwidth in the network to do legitimate work there by restricting a computer resource or making it unavailable for legitimate tasks.
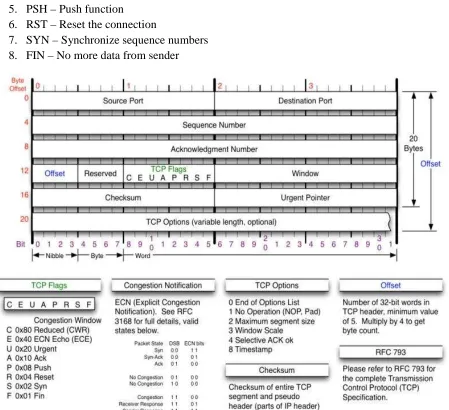
2.4 Transmission Control Protocol (TCP)
1. CWR – Congestion Window Reduced (CWR) flag is set by the sending host to indicate that it received a TCP segment with the ECE flag set
2. ECE (ECN-Echo) – indicate that the TCP peer is ECN capable during 3-way handshake 3. URG – indicates that the URGent pointer field is significant
4. ACK – indicates that the ACKnowledgment field is significant 5. PSH – Push function
6. RST – Reset the connection
7. SYN – Synchronize sequence numbers 8. FIN – No more data from sender
Figure 2-2. TCP Header
Adapted from http://nmap.org/book/images/hdr/MJB-TCP-Header-800x564.png 2.5 Port Scanning
to attack that machine on that specific port or not. “For example, if the intruder finds that port 143 (the IMAP port) is open; she may proceed to find out what version of IMAP is running on the target machine. If the version is vulnerable, she may be able to gain super user access to the machine using an exploit” [TEO, 2000].
Port scanning can be conducted in many ways. The most well known port scanning techniques are listed below [Port Scanning Techniques, Insecure.org]
1. TCP connect scan 2. TCP SYN scan 3. TCP FIN scan 4. TCP null scan 5. TCP window scan 6. TCP ACK scan 7. TCP Maimon scan 8. Xmas tree scan 9. UDP scan 10.IP protocol scan 11.FTP bounce scan 12.Idle scan
2.5.1 Xmas Tree Scan
The Xmas tree scan exploits a subtle loophole in the TCP RFC to differentiate between open and closed ports [Port scanning techniques, Insecure.org]. According to Insecure.org “If the [destination] port state is CLOSED, an incoming segment not containing a RST causes a RST to be sent in response”. According to Nmap.org, when scanning systems compliant with the TCP RFC text, any packet not containing SYN, RST, or ACK bits will result in a returned RST if the port is closed and no response at all if the port is open. According to Nmap.org as long as none of those bits are included, any combination of the other three (FIN, PSH, and URG) are ok. Nmap exploits this with the Xmas tree scan.
In a Xmas tree scan, if a RST packet is received, the port is considered closed. This is illustrated by the diagram below.
Adapted from http://www.networkuptime.com/nmap/page3-5.shtml
A no response means it is open or filtered. The port is marked filtered if an ICMP unreachable error (type 3, code 1, 2, 3, 9, 10, or 13) is received. This scenario of not receiving a response is displayed below.
Figure 2-4. Open or Filtered port in a Xmas Scan
Adapted from http://www.networkuptime.com/nmap/page3-5.shtml
According to the Wikipedia a key advantage of these scan types is that they can sneak through certain stateless firewalls. That makes the Xmas tree scan stealthier than a regular SYN scan. Xmas tree packets are not commonly present in networks and indicate a high probability of network reconnaissance activities [Christmas tree packet, Wikipedia]. Luckily though, intrusion detection products and advanced firewalls can be configured to detect these types of reconnaissance scans. Snort intrusion detection system will alert on a Xmas tree scan which was tested in our research work.
Since there are systems that do not follow RFC 793, some systems send RST responses to the probes regardless of whether the port is open or not [Port scanning techniques, Insecure.org]. This will result in all ports being labeled as closed. This behavior is shown by Microsoft Windows and many Cisco devices [Port scanning techniques, Insecure.org]. However, this scan will work against most UNIX based system [Port scanning techniques, Insecure.org]. Also, these scans can't distinguish open ports from certain filtered ones, leaving one with the response open or filtered [Port scanning techniques, Insecure.org].
2.5.2 Packet Design for the Xmas Tree Scan
value 00101001 which corresponds to 29 in hexa-decimal. The flag structure will be displayed in the following way in CommView.
Figure 2-5. Xmas Tree Packet with FIN PSH URG Flags Set
3 EQUIPMENT AND SOFTWARE USED IN THE EXPERIMENTS
3.1 Aruba AP-70 Sensors
According to Aruba Networks AP-70 datasheet, the “Aruba AP-70 is a dual-radio indoor wireless access point capable of supporting functions including WLAN access, air monitoring/wireless intrusion detection and prevention, and secure enterprise mesh across the 2.4-2.5 GHz and 5 GHz RF spectrums.” In our research two Aruba AP-70 sensors were used to do intrusion detection through the RF protect intrusion detection system.
3.2 CommView
According to the CommView website, CommView is a network monitor and analyzer that provides a picture of the traffic flowing through a PC or LAN segment. In our research we will be using CommView to construct TCP, UDP and ICMP packets for various attacks and create Denial of Service (DoS) attacks using its built in packet flooder. For creating TCP packets, CommView provides a hex editor that provides the facility of setting each flag of a TCP packet to the desired value. Further, CommView provides an interface to flood packets to a network at a maximum rate of 5000 packets per second. Given below is a screen shot of CommView’s hex editor. It also shows its packet flooding interface with parameters such as “packets per second, packet size”.
Figure 3-2. CommView Hex Editor
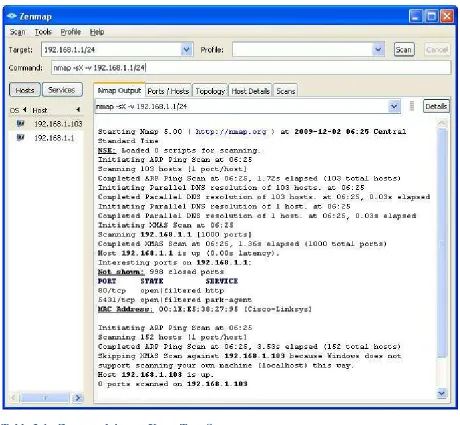
3.3 Nmap/Zenmap
offering, what operating systems (and OS versions) they are running, what type of packet filters/firewalls are in use, and other characteristics” [Nmap]. It was designed to scan large networks, but can work to scan single hosts also.” Recently Nmap added an advanced GUI interface, called Zenmap. We have used Zenmap in our experiments to conduct Xmas tree attacks.
Table 3-1 - Zenmap doing an Xmas Tree Scan
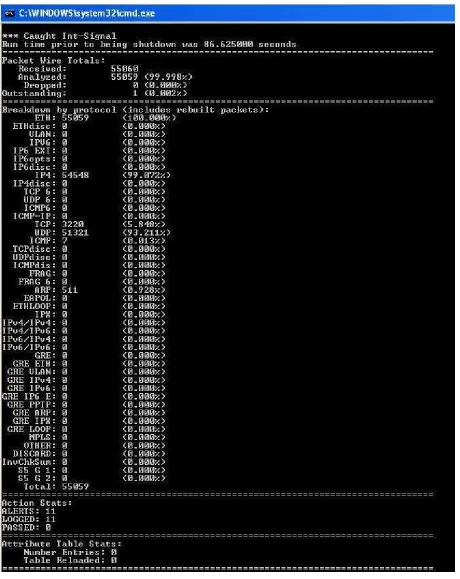
3.4 Snort
Figure 3-3. Snort IDS used in Intrusion Detection
RF protect is a proprietary wireless intrusion detection and prevention (WIDP) system developed by Aruba Networks. In our research we use RF protect to conduct intrusion detection and collect alert data related to attacks. The AP-70 sensors send their alerts to RF Protect’s central database where it analyzes the data.
Figure 3-4. RF Protect Console
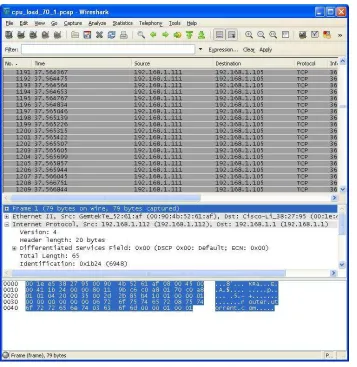
3.6 Wireshark
Wireshark is a network protocol analyzer. According to the Wireshark website [Wireshark], it has the following useful features
1. Live capture and offline analysis
3. “Decryption support for many protocols, including IPSec, ISAKMP, Kerberos, SNMPv3, SSL/TLS, WEP, and WPA/WPA2 “
4. “Coloring rules can be applied to the packet list for quick, intuitive analysis “
We used two Wireshark sensors to gather evidence on wireless networks in our experiments.
Figure 3-5. Wireshark at work
3.7 Loadcontrol
According to http://www.codeproject.com/KB/cpp/CPU_Load_Control.aspx?msg=1915014 this is a program that demonstrates how to retrieve the current CPU load percentage and set it using a high priority thread control loop.
one instance should be run on the first core and the second instance on the second core of the system. Then both threads should be given real time priority. A normal process on windows would have priority set to normal by default. The screen shots below will make the process clearer.
Figure 3-6. Setting Processor Affinity 1
First thread should be run on the core CPU 0
Figure 3-7. Setting Processor Affinity 2
Figure 3-8. Setting Processor Priority to Realtime
Both LoadControl processes should be given Realtime priority through the task manager.
Figure 3-9. Load Control Software at Work
4 SURVEY OF DEMPSTER-SHAFER THEORY IN DATA FUSION
4.1 Theory of Evidence and Dempster-Shafer Theory in Data Fusion
According to Siaterlis and Maglaris [2004] “data fusion is a process performed on multisource data towards detection, association, correlation, estimation and combination of several data streams into one with a higher level of abstraction and greater meaningfulness.” According to the authors, the process of collecting information from multiple and possibly heterogeneous sources and combining them leads to more descriptive, intuitive and meaningful results. According to Bass [2000], multi sensor data fusion is a relatively new discipline that is used to combine data from multiple and diverse sensors and sources in order to make inferences about events, activities and situations. Bass [2000] states that this process can be compared to the human cognitive process where the brain fuses sensory information from various sensory organs to evaluate situations, make decisions and to direct specific actions. Bass [2000] and Siaterlis and Maglaris [2004 and 2005] give several examples of systems that use data fusion in the real world. Bass [2000] claims data fusion is widely used in military applications such as battlefield surveillance and tactical situation assessment and in commercial applications such as robotics, manufacturing, remote sensing, and medical diagnosis. Siaterlis and Maglaris [2004 and 2005] provide military systems for threat assessment and weather forecast systems as examples of such systems currently in use today.
The Theory of Evidence is a branch of mathematics that is concerned with using evidence to calculate the probability of an event. The Dempster-Shafer theory (D-S theory) is a theory of evidence used to combine separate pieces of evidence to calculate the probability of an event. According to Chen and Aickelin [2006], the Dempster-Shafer theory was introduced in the 1960’s by Arthur Dempster and developed in the 1970’s by Glenn Shafer. They view the theory as a mechanism for reasoning under epistemic uncertainty. According to Sentz [2002], epistemic uncertainty is “the type of uncertainty which results from the lack of knowledge about a system and is a property of the analysts performing the analysis.” Sentz [2002] also states that epistemic uncertainty is also known as, Subjective uncertainty, Type B uncertainty, Reducible uncertainty, State of Knowledge uncertainty, and Ignorance. Chen and Aickelin [2006] also stated that the part of the D-S theory which is of direct relevance to anomaly detection is the Dempster’s rule of combination. According to Siaterlis et al. [2003] D-S theory can be considered as an extension of Bayesian inference. According to Shafer [2002] “the Dempster-Shafer theory is based on two ideas: the idea of obtaining degrees of belief for one question from subjective probabilities for a related question, and Dempster's rule for combining such degrees of belief when they are based on independent items of evidence.”
occurring in the system as a whole. According to Chen and Venkataramanan [2005], in previous approaches data has been combined using simplistic combination techniques such as averaging or voting. They further stated that a distributed intrusion detection system combines data from multiple nodes to estimate the likelihood of an attack, yet fails to take into consideration that the observing nodes might be compromised. Dempster-Shafer theory takes this uncertainty into account when making the calculations.
4.2 Data Used in Experiments
One of the important parts of an experiment is to determine what kind of data should be used in the experiment. Should the data be generated to create an original dataset or should the research make use of the already generated data? When it came to Dempster-Shafer data fusion, the same questions arose. In the research conducted so far, most researchers decided to use an existing dataset while some preferred to generate their own data.
The Defense Advanced Research Projects Agency (DARPA) DDoS intrusion detection evaluation datasets are a popular choice among many intrusion detection system (IDS) testers. It is no different when it came to testing the Dempster-Shafer IDS models. Yu and Frincke [2005] used the DARPA 2000 DDoS intrusion detection evaluation dataset to test their model. Chou et al. [2007 and 2008] used the DARPA KDD99 intrusion detection evaluation dataset. The KDD99 dataset can be found at http://kdd.ics.uci.edu/databases/kddcup99/kddcup99.html. The 1998 DARPA intrusion detection evaluation data set was used by Katar [2006] for his experiments.
According to Chou et al. [2007], the DARPA KDD99 data set is made up of a large number of network traffic connections and each connection is represented with 41 features. Further, each connection had a label of either normal or the attack type. They stated that the data set contained 39 attack types which fall into four main categories. They are, Denial of Service (DoS), Probe, User to Root (U2R), and Remote to Local (R2L). The authors have reduced the size of the original data set by removing duplicated connections. They further modified the data set by replacing features represented by symbolic values and class labels by numeric values. Also, they normalized values of each feature to between 0 and 1 in order to offer equal importance among features.
Chen and Aickelin [2006] used the Wisconsin Breast cancer dataset and the Iris data set [Asuncion and Newman 2007] of the University of California, Irvine (UCI) machine learning repository for their research. Some authors chose to generate their own data for the attacks and background traffic. For example, Siaterlis et al. [2003] used background traffic generated from more than 4000 computers in the National Technical University of Athens (NTUA) for their experiment.
When using Dempster-Shafer’s theory of evidence, defining the frame of discernment is of great importance. Most of the authors referred in this survey did not explicitly mention their frame of discernment. Some of them did not mention a frame of discernment at all. It can be argued that this is a major weakness of those particular papers.
Wang et al. [2004] defined their frame of discernment to be Stealthy Probe [Paulauskas and Garsva 2006], DDoS [Rogers 2004], Worm [http://en.wikipedia.org/wiki/Computer_worm], LUR (Local to User, User to Root) [Paulauskas and Garsva 2006], and Unknown. According to the authors, ‘Unknown’ is defined into the frame of discernment because abrupt increases of network traffic could be a result of a DDoS or a worm spreading or LUR or a Probe attack. The authors argue that in this situation, the host agent information will help to make the final decision as to what attack it was. Siaterlis et al. [2003] and Siaterlis and Maglaris [2004 and 2005] defined their frame of discernment to be
1. Normal
2. SYN-flood [http://en.wikipedia.org/wiki/SYN_flood]
3. UDP-flood [http://en.wikipedia.org/wiki/UDP_flood_attack] 4. ICMP-flood [http://en.wikipedia.org/wiki/Ping_flood]
According to the authors, these states are based on a flooding attack categorization of the DDoS tools [Mirkovic et al. 2001] that were in use at the time they wrote their paper. Hu et al. [2006] defined their frame of discernment to be normal, TCP, UDP, and ICMP. Hu et al. [2006] were concerned with flooding attacks in their research. Chatzigiannakis et al. [2007] defined four states for the network. They are Normal, SYN-attack, ICMP-flood, and UDP-flood. These states are quite similar to what Siaterlis and Maglaris [2004 and 2005] defined for their frame of discernment. Siaterlis and Maglaris [2004] and Chatzigiannakis et al. [2007] conducted their research at the National Technical University of Athens (NTUA).
4.4 Application of D-S in Anomaly Detection
Anomaly detection systems work by trying to identify anomalies in an environment. In other words an anomaly detection system looks for what is not normal in order to detect whether an attack has occurred. According to Chen and Aickelin [2006] the problem with this approach is that user behavior changes over time and previously unseen behavior occurs for legitimate reasons which leads to generation of false positives in the system. The authors say that this can lead to a sufficiently large number of false positives forcing the administrator to ignore the alerts or disable the system.
According to Katar [2006], a majority of intrusion detection systems, based on detection of anomalies, adopt a single algorithm either for modeling normal behavior patterns and/or attack signatures which ensures a lower detection rate and increases false negative rate.
Yu and Frincke [2005] state that modern intrusion detection systems often use alerts from different sources to determine how to respond to an attack. According to the authors, alerts from different sources should not be treated equally. They argue that information provided by remote sensors and analyzers should be considered less trustworthy than that provided by local sensors and analyzers. They also state that identical sensors and analyzers installed at different locations may have different detection capabilities because the raw events captured by these sensors are different. Further, different kinds of sensors and analyzers which detect the same type of attack may do so with a different level of accuracy.
In their research the authors addressed the fact that all observers cannot be trusted equally and a given observer may have different effectiveness in identifying individual misuse types by extending the D-S theory to incorporate a weighted view of evidence. In other words, the authors proposed to improve and assess alert accuracy by incorporating a weight component to each observer to reflect how much trust they place on each observer. For this purpose they proposed a modified D-S combination rule. The new D-S combination rule has exponents as weights for each observer. This new theory is called the Extended Dempster-Shafer Theory. The new combination rule is given below.
B ⋂ C = A, Σ [m1(B)]w1[m2(C)]w2
m12 (A) = ---
1 - [B ⋂ C = ∅, Σ [m1(B)] w1[m2(C)] w2]
m12 (A) = Combined belief of the hypothesis A
m1 (B) = Belief committed to B as seen by the first observer
m2 (C) = Belief committed to C as seen by the second observer
Where wi is the weight for the ith observer. When w1 = w2 = 1, is reduced to the basic D-S combining rule.
According to the authors, in their system they estimated the weights based on the Maximum Entropy principle [Berger et al. 1996; Rosenfeld 1996) and the Minimum Mean Square Error (MMSE) criteria.
The authors stated that the extended D-S further increases the detection rate while keeping false positive rate low. They also pointed out that when using the basic D-S combination algorithm, the detection rate decreases relatively to the extended D-S. According to them, the extended D-S algorithm provides 30% more accuracy. Also, they have compared their method with Hidden Colored Petri Net (HCPN) based alert analysis component. They stated “Our initial evaluations on the DARPA IDS evaluation data set show that our alert fusion algorithm can improve alert quality over those from Hidden Colored Petri-Net (HCPN) based alert correlation components installed at the demilitarized zone (DMZ) and inside network sites. Due to alert confidence fusion in our example, the detection rate rises from75% to 93.8%, without adversely affecting the false positive rate” Yu and Frincke [2005].
The authors claim that their “alert confidence fusion model can potentially resolve contradictory information reported by different analyzers, and further improve the detection rate and reduce the false positive rate.” They state that their approach has the ability to quantify relative confidence in different alerts.
4.4.2 Experiments of Chen and Aickelin
Chen and Aickelin [2006] have constructed a Dempster-Shafer based anomaly detection system using the Java 2 platform. First they use the Wisconsin Breast Cancer Dataset (WBCD) to perform their experiment. According to the authors, the WBCD is used for two reasons. One reason is that they can compare the performance of other algorithms to their approach. The other is to “investigate if it is possible to achieve good results by combining multiple features using D-S, without excessive manual intervention or domain knowledge based parameter tuning.” Secondly, Chen and Aickelin [2006] have used the Iris plant dataset [Asuncion and Newman 2007] for their experiments. According to the authors the Iris dataset was chosen because it contains fewer features and more classes than the WBCD. By using this they can confirm whether D-S can work on problems with fewer features and more classes. Thirdly, they conducted an experiment using an mail dataset which was created using a week’s worth of e-mails (90 e-e-mails) from a user’s sent box with outgoing e-e-mails (42 e-e-mails) sent by a computer infected with the netsky-d worm. The aim of the experiment was to detect the 42 infected e-mails. They used D-S to combine features of the e-mails to detect the worm infected e-e-mails.
The authors claimed that their experimental results show that they were able to successfully classify a standard dataset by combining multiple features for WBCD using the D-S method. According to them, the experimental results with the Iris dataset [Asuncion and Newman 2007] show that D-S can be used for problems with more than two classes, with fewer features. They also claimed experiments with the e-mail dataset show that D-S method works successfully for anomaly detection by combining beliefs from multiple sources.
The authors claimed that combining features using D-S improves accuracy. Also, they claimed that a few badly chosen features do not negatively influence the results, as long as most chosen features are suitable. Therefore they stated that D-S is ideal for solving real-world intrusion detection problems. Also, they claimed that the results of the Iris dataset prove that D-S can be used for problems with more than two classes, with fewer features. By successfully detecting e-mail worms through experiments, they claimed that the D-S method works successfully for anomaly detection by combining multiple sources.
The authors concluded that based on their results, D-S can be a good method for network security problems with multiple features (various data sources) and two or more classes. They also stated that the initial feature selection influences overall performance as with any other classification algorithm. Further, D-S approach works in cases where some feature values are missing which they say is very likely to happen in real world network security scenarios. Chen and Aickelin stated “our continuing aim is to find out how D-S based algorithms can be used more effectively for the purpose of anomaly detection within the domain of network security.” 4.4.3 Experiments of Chatzigiannakis et al
Chatzigiannakis et al [2007] conducted their experiments at the National Technical University of Athens (NTUA). They addressed the problem of discovering anomalies in a large-scale network based on the data fusion of heterogeneous monitors. The authors built their work partially on the data fusion algorithms presented by Hall [1992].
They monitored the link between National Technical University of Athens (NTUA) and the Greek Research and Technology Network (GRNET) which connects the university with the Internet. The authors claim that this link has an average traffic of 700-800 Mbits/sec and that it contains a rich network traffic mix that consists of standard web traffic, mail, FTP and p2p traffic.
The D-S algorithm correctly detected an ICMP flood when attack packets correspond to 5% of the background traffic. For a SYN attack, when attack packets correspond to 2% of background traffic, the D-S algorithm erroneously concluded that the network is normal. However, their research showed that when attack packets correspond to 20% of background traffic, the D-S algorithms correctly detects the SYN attack state. When attack packets correspond to 20% of total traffic in an ICMP flood attack, the M3L algorithm fails to detect the attack. According to the authors M3L fails to detect the attack because the selection of metrics is inappropriate (metrics utilized are uncorrelated) so the algorithm fails to create a precise model of the network. For a SYN attack which consists of packets corresponding to 2% of background traffic, the M3L algorithm correctly detects the attack.
According to the authors, the differences in the performance of the algorithms lie in the correlation of the metrics used. They stated that the D-S theory of evidence performs well on the detection of attacks that can be sensed by uncorrelated metrics. The explanation they give for this is that it is because the D-S theory requires the evidence originating from different sensors to be independent. According to the authors, M3L requires the metrics fed into the fusion algorithm present some degree of correlation. “The method models traffic patterns and interrelations by extracting the eigenvectors from the correlation matrix of a sample data set. If there is no correlation among the utilized metrics then the model is not efficient.” The authors stated that “Metrics such as TCP SYN packets, TCP FIN packets, TCP in flows and TCP out flows are highly correlated and should be utilized in M3L, whereas the combination of UDP in/out packets, ICMP in/out packets, TCP in/out packets are uncorrelated and should be used in D-S.” According to the authors, “attacks that involve alteration in the percentage of UDP packets in traffic composition such as UDP flooding are better detected by the D-S method.” Further, “attacks such as SYN attacks, worms spreading, port scanning which affect the proportion of correlated metrics such as TCP in/out, SYN/FIN packets and TCP in/out flows are better detected with M3L.” Also, the authors derive an important result from their study and numerical results. That is, the conditions under which the two algorithms operate efficiently are complementary, and therefore could be used effectively in an integrated way to detect a wide range of possible attacks.
commerce infrastructures. They further claimed without well designed tools for the management of future networks, it will be hard to dynamically and reliably identify network anomalies.
The major contributions of the papers discussed in this section are summarized below.
Year Paper Major Contribution
2005 Alert confidence fusion in intrusion detection systems with extended Dempster-Shafer theory.
[Yu and Frincke]
Extended the D-S theory to incorporate weights to different observers to reflect that every observer cannot be trusted equally. By doing so they gave birth to the Extended D-S theory.
Showed how to improve and assess alert accuracy by incorporating an algorithm based on the exponentially weighted Dempster-Shafer theory of Evidence. This was the first time the extended D-S was used in intrusion detection.
Showed through experiments that extended D-S is 30% more accurate when it comes to detection accuracy than the basic D-S.
2006 Dempster-Shafer for Anomaly Detection. [Chen and Aickelin]
Showed by experiments that one is able to successfully classify a standard dataset by combining multiple features for the WBCD (Wisconsin Breast Cancer Dataset) using the D-S method.
Showed through experiments with the Iris dataset that D-S can be used for problems with more than two classes, with fewer features.
Showed through experiments with the e-mail dataset that D-S method works successfully for anomaly detection by combining beliefs from multiple sources.
2007 Data fusion algorithms for network anomaly detection: classification and evaluation.
[Chatzigiannakis et al]
Compared two anomaly detection techniques, Dempster-Shafer and Multi-Metric-Link (M3L) under various attack scenarios.
create a precise model of the network.
Showed that D-S theory of evidence performs well on the detection of attacks that can be sensed by uncorrelated metrics.
Showed that the conditions under which the two algorithms operate efficiently are complementary, which makes it better to use them in an integrated environment.
4.5 Application of D-S to Detect DoS and DDoS Attacks
4.5.1 Experiments of Siaterlis et al. of the NTUA
Various experiments have been conducted to study the use of D-S theory to detect DoS and DDoS attacks. Some of the major research in this area has taken place at the National Technical University of Athens (NTUA). Siaterlis et al [2003], Siaterlis and Maglaris [2004] and Chatzigiannakis et al [2007] have conducted their experiments related to DoS attacks and D-S theory at the NTUA. Vasilis Maglaris and Basil Maglaris of the NTUA have both published two papers on multi sensor data fusion for Denial of Service (DoS) detection using the D-S theory of evidence. Christos Siaterlis of the NTUA is the only researcher so far to publish 3 papers on intrusion detection using the D-S theory.
Siaterlis et al. [2003], addressed the problem of detecting distributed denial of service attacks (DDoS) “on high bandwidth links that can sustain the flooded packets without severe congestion.” According to the authors, DDoS attacks have been the focus of the research community in the last few years but still remain an open problem. They stated that many DDoS prevention techniques like Ingress and RPF filtering have been proposed in the literature and implemented by router vendors but they were not able to lessen the problem. The authors say that when they refer to DDoS, they refer to packet flooding attacks not logical DoS attacks that exploit application vulnerabilities. Also, they do not require the attackers to be truly distributed in the network topology in their DoS attacks. Their research consists of developing a framework for DDoS detection engine using the Dempster-Shafer’s “Theory of Evidence”.
has already been consumed. Therefore, techniques such as firewall filtering, rate limiting, route blackholes, are not effective countermeasures for such an attack. They argue that IP traceback, IP pushback, are ineffective (to move the countermeasure near the source of the attack) because automated large scale cooperation is difficult in a diverse networked world like the Internet. Other techniques such as Ingress filtering, RPF filtering, are only helpful to discourage the attacker because they make the traceback easier. They argue that the only reliable solution to DoS mitigation is to have a solid DoS detection mechanism. According to the authors, the custom detection methods that are being used by network engineers are weak as they utilize thresholds on single metrics. Therefore, they utilize a data fusion algorithm based on the “Theory of Evidence” to combine output of several sensors to detect attempted DoS attacks.
4.5.1.1 Data Fusion Architecture
According to Siaterlis et al. [2003] a data fusion architecture consists of the following main stages.
1. Data Collection – Data is detected and collected through various sensors
2. Data Alignment & Association – Since data is collected through various sensors, they may exhibit differences in time, space or measurement. These will be aligned properly at this stage.
3. State Estimation – A data fusion algorithm estimates the state based on the knowledge gathered through sensors.
4. Attribute classification & Identification - In this phase the different targets and events that are being monitored are identified.
5. Situation Assessment – Based on the results of the previous 2 stages, the overall status of the system is determined. This is the highest level of information fusion.
4.5.1.2 Data Fusion Models
According to Siaterlis et al. there are 3 kinds of data fusion models. 1. Physical Models
2. Parametric Classification
a. Bayesian Inference Model
b. Dempster Shaffer Theory of Evidence c. Adaptive Neural Nets
d. Voting Methods 3. Cognitive Algorithms
b. Fuzzy set theory
An example of a physical model is the Kalman filter which provides a solution to minimize the mean square error between the true state of the system and the estimate of the state. Siaterlis et al. states that the Kalman filter requires the knowledge of the state transition matrix and the measurements are corrupted by white zero mean noise with known covariance matrix. They also state network behavior has not yet been successfully modeled; therefore such a system’s usability is questionable. Siaterlis et al. state that adaptive neural nets have been used in the context of intrusion detection but it requires training data that will be representative of the normal traffic data, which is extremely hard to gather or generate. Voting is one of the simplest and intuitive methods for fusion models. According to Siaterlis et al. each sensor’s data serves as a vote in a democracy where the fused declaration is the declaration of the majority. They state that this method is useful when a priori statistics are not known. According to Siaterlis et al. there are also variation of the voting system that include, weighted voting systems and use of intermediate decision on a decision tree. The authors stated that the underlying theory in expert systems is “First Order Logic”. The drawback with first order logic is that it cannot model the whole spectrum between belief and disbelief in a statement but uses a plain true or false approach instead. They state that fuzzy logic has many common elements with Theory of evidence.
After reviewing all the above mentioned methods they have concluded that Dempster-Shafer’s theory of evidence needs further investigation. They stated that “there is a clear need to utilize information from multiple heterogeneous sources with different sensitivity, reliability and false alarm rates.” The authors considered the Dempster-Shafer approach as an extension of the Bayesian inference.
4.5.1.3 DDoS Detection Engine and the Early Research
Siaterlis et al. [2003] built a prototype for a DDoS detection engine that uses the Dempster-Shafer theory of Evidence for their experiment. According to them this “might aid network administrators to monitor their network more efficiently and with small set up cost.” They evaluated the D-S detection engine prototype in the National Technical University of Athens (NTUA). According to the authors, related experiments were carried out over several days during regular business hours with background traffic generated from more than 4000 computers in the campus. The authors hosted the victim inside the campus network while the attacker was outside the campus network. The attacker was connected to a fast Ethernet interface to simulate the aggregation of traffic from several attacking hosts. The authors claimed that their DDoS detection engine can maintain a low false positive alarm rate with a reasonable effort from the network administrator.
the network, they mean whether the network is under attack or not. The authors view the “network as a system with stochastic behavior without assuming any underlying functional model.” The attempt to determine the unknown system state is based on knowledge reported by sensors that may have acquired their evidence based on totally different criteria. They have implemented a system that fuses the knowledge collected from the reports of various sensors, in order to infer the state of the monitored network. Their architecture consists of the following two sensor types.
(1) A preprocessor plug-in for Snort – They collected data from incoming and outgoing TCP, TCP SYN, TCP FIN, UDP, ICMP packet rates and their corresponding share of the link utilization.
(2) A SNMP data collector and analyzer stored the data in round robin databases using the RRDtool. They calculated the bytes/sec, packets/sec ratios and active flow numbers based on Cisco’s Netflow [22].
4.5.1.4 Sensor Functionality
The authors stated that the sensors can express beliefs about the network state after the right configuration and fine tuning and that their detection principle differs from many of the existing detection techniques which are focused on a single metric.
They have introduced a sensor that monitor the number of active flows seen by a router. A flow is defined as a unique set of 5 characteristics that include (protocol, source IP, source port, destination IP, and destination port). According to the authors, in the presence of a spoofed attack the number of active flows rises. Further, in the presence of a flooding attack the number of transports that are not completed (with TCP FIN or RST) is high. These flows fill up the cache without being removed gracefully. The reason for including this metric, the authors state is that it will give a good indication of a spoofed attack even though it cannot give an insight into the exact attack type. The sensor in this case states its belief in the hypothesis, H = {SYN-flood, UDP-flood, ICMP-flood}.
The authors have built basic probability assignments (BPA’s) that match measured values to beliefs about the true system state. They have defined their frame of discernment to be Θ = {Normal, TCP SYN Attack, UDP BWDTH Attack, and ICMP BDWDTH Attack}. The authors have defined a way to assign BPA’s in the following manner. For example, if the sensor measures a high value for the ratio
Incoming UDP bytes/sec --- Outgoing UDP bytes/sec
1. Assigns a value m(H) ε [0,1]
2. Assigns a value to the set ¬H, to express the refuting evidence of the hypothesis H, so m(¬H) ε [0,1].
3. Assigns a value to the set Θ to express ignorance of the sensor and the possibility that it might be erroneous. m(Θ) ε [0, 1].
According to the authors, m(H) + m(¬H) + m(Θ) = 1. The sensors calculate the corresponding BPA’s and transfer the data to the fusion node which has the DS inference engine. The DS inference engine calculates the belief intervals for each member of the frame of discernment. These belief intervals are then graphically represented and the interpretations of the results are left to the network admin.
4.5.1.5 Later Research
In 2004, Siaterlis and Maglaris published another paper based on intrusion detection using D-S theory of evidence. The work done is continued from where they left off in Siaterlis and Maglaris [2003]. In this work, they have changed the frame of discernment from Θ = {Normal, TCP SYN Attack, UDP BWDTH Attack, and ICMP BDWDTH Attack} to Θ = {Normal, SYN flood, UDP flood, and ICMP flood}.
In 2005, Christos Siaterlis published another paper with Vasilis Maglaris that extended the work from Siaterlis and Maglaris [2004]. According to them, the 2005 paper discusses how to automate the process of tuning the sensors while taking advantage of expert knowledge. Also, they discussed the combination of different metrics to enhance detection performance compared to the use of a single metric. Further they compared the D-S approach with the use of an Artificial Neural Network (ANN) when it comes to data fusion.
Unlike in the previous two papers, Siaterlis and Maglaris [2005] go into much more detail as to how their system operates. They stated their customized Netflow collector gathers flows that are exported by the router and calculates the number of flows with lifetime shorter than 10ms according to the flow generation rate. According to the authors, though this metric does not give an indication of exact attack type, it is a good indication of spoofed or a highly distributed attack.
The authors stated that in the early stages of their work, the sensors were required to be manually configured to express beliefs about the network state by translating the measurements to basic probability assignments (BPA). Later on they have used a supervised learning approach and inserted a neural network at the sensor level to ease the administrator from having to configure the sensor manually. They have further given a formula they used in the neural node to calculate the BPA’s automatically. It is given below.
m(H) = 1 – m(Θ), otherwise
and
m(¬H) = 1-x-m(Θ), if m(Θ) + x < 1 m(¬H) = 0, otherwise
Where x is the sensor output.
These BPA’s are then transferred to the D-S engine. The D-S engine then fuses the information using the Dempster’s rule of combination to calculate the belief intervals for each member of the frame of discernment. Then, the attacks are detected by the output of the belief of individual attack states. As an example they state,
UDP Alert = true, if Bel({UDP-flood}) > 0.5; and
UDP Alert = false, otherwise
The authors have compared their data fusion approach to Artificial Neural Network (ANN) data fusion approach. They stated “If we feed the detection metrics directly into an ANN, like the feed-forward Multi Layer Perceptron (MLP) network, we can teach it to classify the network state in elements of the same set {NORMAL, SYN-flood, UDP-flood, ICMP-flood}.” They have used the Levenberg-Marquardt back propagation algorithm for training because of its speed. They have performed many tests which included changing the number of neurons in the hidden layer. Their results have indicated that compared to ANN, D-S produces fewer false positives. Also, they stated that apart from the above comparison, in the D-S system they can incorporate human expertise which is an added advantage. What they meant by this was that they can define which attack states each sensor is sensitive to using their expertise.
Siaterlis and Maglaris [2005] stated that implementing their ideas into an operational network could be a task of significant difficulty, but it may offer many advantages if done successfully. The advantages include,
1. Sensors can provide both supportive and refuting evidence of an attack. Therefore, different sensors can lower or raise the combined belief of an attack state.
2. Each sensor can contribute information at its own level of detail. This enables the use of metrics such as CPU utilization of routers that are not specific to attack type.
3. No need to assume the probability of the network being in a specific state. Just need to express the belief that an observed event supports a state.
4. Multiple data sources can be used to increase the confidence in the estimation. 5. Can incorporate knowledge from sensors that are based on different detection
algorithms.
They also point out that knowledge based systems can only be as good as their source from which they acquire knowledge. Also, they state that their system cannot handle multiple simultaneous attacks because mutual exclusivity of system states is assumed.
4.5.2 Experiments of Hu et al.
According to the Hu et al. [2006], when it comes to implementing network security management, multi-sensor data fusion faces a lot of problems. For example, there is no appropriate physical model to describe a network. They stated that the state transition matrix for a network is hard to acquire and a network’s behavior has not yet been successfully modeled. Also, they state that a physical model such as the Kalman Filter is limited in use and using it to predict traffic is a tradeoff between accuracy and efficiency. Cognitive algorithms have good adaptability but need a lot of training data, which they state is hard to capture in a real network. So, in their experiments they have used the D-S theory of evidence to make uncertainty inferences because it does not require state transition matrices or training data.
According to the authors, an improved detection engine has been introduced in this paper. They also introduce “Detection Uncertainty” to describe the fuzzy problem which cannot be avoided in the detection and merges identity inference and intrusion detection. They defined detection uncertainty to be the sum of subject uncertainty and objective uncertainty.
Detection Uncertainty = Subjective Uncertainty + Objective Uncertainty
The uncertainty that arises because of the selected detection metrics and sensor specific techniques was defined as Subjective Uncertainty. The uncertainty that arises because of the experimental environment was defined as Objective Uncertainty. According to the authors once the sensors are completely setup, Subjective Uncertainty will not change. Also, they stated that because of the difference of detection techniques and metrics, different sensors have different Subjective Uncertainties.
According to the authors, the experiments were carried out in a small scale LAN. They have used LibPcap based sensors to poll the network and assign appropriate mass/belief values to the current state of the network. LibPcap is a system-independent interface for user-level packet capture. It can be downloaded from http://sourceforge.net/projects/libpcap/.