WANG, KYE WON. Development of Computer Simulation Models for Drug Delivery Applications. (Under the direction of Dr. Carol K. Hall).
We developed coarse grained and implicit solvent models of DNA and lipids for the purpose of studying hydrogels and lipid bilayers. Those models are designed for use in discontinuous molecular dynamics (DMD) simulations. The DNA model is used to study the spontaneous formation of DNA-mediated hydrogels. The lipid model is used to investigate the structural properties of lipid bilayers. Our research in self-assembled hydrogels and lipid bilayers is intended to help identify their potential for use as drug delivery vehicles.
First, we develop a coarse grained nucleotide model for simulating large-scale aptamer-based hydrogel network formation. In the model, each nucleotide is represented by a single interaction site containing sugar, phosphate, and base. Discontinuous molecular dynamics (DMD) simulations are performed to simulate formation and denaturation of oligonucleotide duplexes as a function of temperature. The simulated melting temperatures of oligonucleotide duplexes are calculated in simulations of systems with different sequences, lengths, and concentrations of oligonucleotides, and compared to data from the OligoAnalyzer tool. The denaturation of oligonucleotide triplexes containing a hybridized structure of three different oligonucleotides is analyzed using both simulations and experiments. The nucleotide model is found to be a good predictor of the oligonucleotide’s hybridized state for both duplexes and triplexes. This coarse grained model has wide ranging applications in the development or
optimization of DNA-based technologies including DNA origami, DNA-enabled hydrogels, and DNA-based biosensors.
functionalized on all ends with oligonucleotides are crosslinked by a single oligonucleotide whose sequence is complementary to the oligonucleotide conjugated to the precursor. We show that the precursors with large molecular weight and many arms are advantageous in forming a three-dimensional percolated network. Analysis of the percolated networks shows that the pore diameter distribution becomes narrower as the precursor concentration, the number of arms, and the molecular weight increase. The pore throat diameter, the size of the largest molecule that can travel through the hydrogel networks without being trapped, is determined. The percolated network slows the movement of molecules inside the pores. Molecules larger than the pore throat diameter have more restrictions on their movement in the percolated network than those with smaller sizes.
by Kye Won Wang
A dissertation submitted to the Graduate Faculty of North Carolina State University
in partial fulfillment of the requirements for the degree of
Doctor of Philosophy
Chemical Engineering
Raleigh, North Carolina 2018
APPROVED BY:
_______________________________ _______________________________ Dr. Carol K. Hall Dr. Saad Khan
Committee Chair
_______________________________ _______________________________ Dr. Jan Genzer Dr. Erik Santiso
BIOGRAPHY
Kye Won Wang was born in 1982 in Seoul, South Korea. He is the son of Jin Hong Wang and Young Jae Kim, and has two younger sisters, Hyerim Wang and Hyeun Wang. He married Jean Chung in 2017 and has a daughter named Jaehee Wang. He attended Yonsei University in Seoul, Republic of Korea and earned his Bachelor of Science in Chemical Engineering in August 2008. After receiving his B.S. degree, Kye Won joined Dr. Do Hyun Kim’s lab in Chemical and Biomolecular Engineering, Korea Advanced Institute of Science and Technology (KAIST), Daejeon, Republic of Korea and obtained his Master of Science degree by submitting a thesis titled “Preparation of micron-sized copolymer particles encapsulating
ACKNOWLEDGMENTS
I would like to express my gratitude to all of my committee members for my dissertation: Professor Saad Khan, Jan Genzer, and Erik Santiso.
I would like to thank my advisor, Dr. Carol K. Hall, for her guidance and discussions about my thesis project. Her enthusiastic dedication to research has helped me to grow as a scientist and engineer. Her most memorable teaching is that researchers must always look at all things with intellectual curiosity. Dr. Hall is not only a great scientist, she is also a great mentor. When I was stressed out, I was helped to overcome these feelings thanks to her warm advice. I greatly appreciate her efforts to teach me, and look forward to many discussions that we will have in the future.
I would like to thank all of the Hall group members that I currently work with and that I have worked with in the past. Their knowledge and enthusiasm for research has made our lab environment an extremely pleasurable place to work. I acknowledge their productive discussions with me and their assistance whenever I encountered roadblocks. I would like to especially thank the following group members: Dr. Emily Curtis and Dr. Steven Benner, for helping me get started with research; Dr. David Rutkowski, for teaching me the basics about discontinuous molecular dynamics simulations and writing computer code; Yiming Wang, for our endless brainstorming discussions. I would also like thank the post docs Drs. Xingqing Xiao and Qing Shao for their expertise and guidance. A final thanks to the younger group members: Ryan Maloney and Amelia Chen.
TABLE OF CONTENTS
LIST OF TABLES ... vii
LIST OF FIGURES ... viii
Chapter 1: Introduction ... 1
1.1 Motivation ... 1
1.2 Overview ... 3
1.3 Reference ... 5
Chapter 2: Development of a simple coarse-grained DNA model for analysis of oligonucleotide complex formation ... 9
2.1 Introduction ... 9
2.2 Materials and Methods ... 14
2.3 Results and Discussion ... 24
2.4 Conclusion ... 30
2.5 Acknowledgements ... 34
2.6 References ... 35
Chapter 3: Computational study of DNA-crosslinked hydrogel formation for drug delivery applications ... 60
3.1 Introduction ... 60
3.2 Materials and Methods ... 64
3.3 Results and Discussions ... 70
3.4 Conclusion ... 78
3.5 Acknowledgements ... 82
3.6 References ... 83
4.1 Introduction ... 104
4.2 Materials and Methods ... 108
4.3 Results and Discussion ... 112
4.4 Conclusion ... 114
4.5 Acknowledgements ... 115
4.6 Reference ... 116
Chapter 5: Future works ... 129
5.1 Investigation of DNA-mediated hydrogel degradation when encountered with target molecules ... 129
LIST OF TABLES
Table 2.1 Oligonucleotide Systems Utilized in Experimental Studya ... 41 Table 2.2 Comparison of the simulation melting temperature and the simulation
temperature when the actual hybridization state is 50%. ... 42 Table 2.3 Simulated and experimental melting temperatures of System 1 to 8.
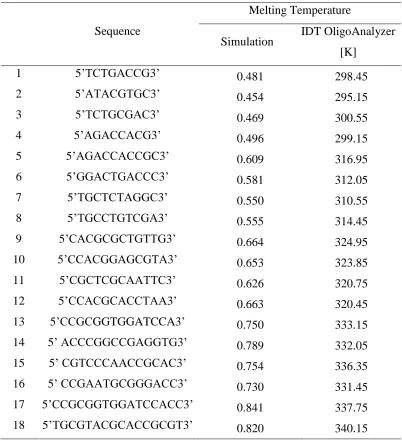
* Experimentally determined Tm is inaccurate. See discussion within text ... 43 Table S2.1 Calculated persistence length of model oligonucleotides ... 44 Table S2.2 Estimated Tm for A and B Strands and Perfect Complement ... 45 Table S2.3 The sequences of the various oligonucleotides used in the simulation and their
melting temperatures in simulation temperature and in unit of Kelvin. ... 46 Table 3.1 Number of CG EOs in one branch for each shape and molecular weight PEG
precursor ... 90 Table 3.2 The saturation degree of precursors with different shapes and molecular weights.
Unit : % ... 91 Table 3.3 Diffusivity of spheres with various diameters in unpercolated (0.16 mmol/L)
LIST OF FIGURES
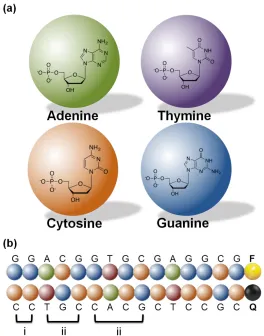
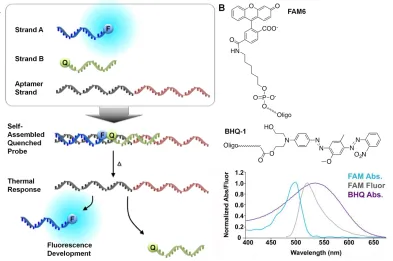
Figure 2.1 Schematic illustration showing (a) the coarse grained representation of four nucleotides and (b) a pair of model complementary oligonucleotides, 5’ GGACGGTGCGAGGCG 3’ labeled with a fluorescent molecule (F) on its 3’ end, and its complement chain labeled with a quencher molecule (Q) on its 5’ end. Three types of bonds represented in (b): a covalent bond (i), pseudobond for bond angle (ii), and pseudobond for torsional angle (iii). ... 47 Figure 2.2 Schematic of Fluorescent Structure-Switching DNA Probe. (A) Schematic of
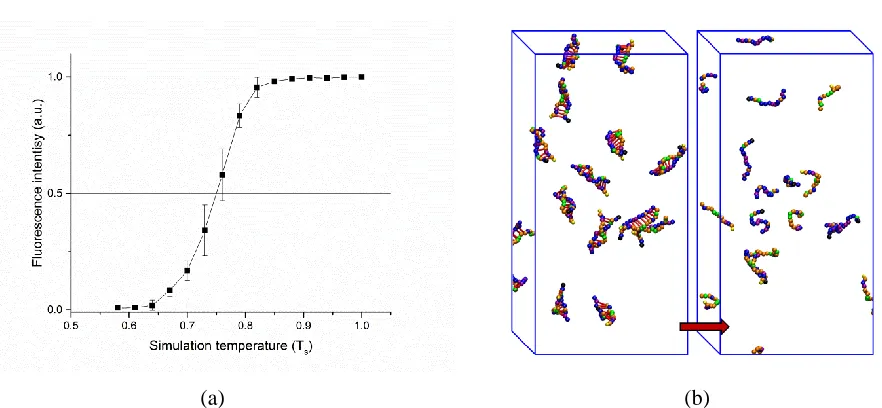
three-stranded DNA triplex self assembly, structure, and thermal response. (B) Chemical structure and spectra of FAM6 fluorophore and BHQ-1 quencher ... 48 Figure 2.3 (a) Simulated fluorescence intensity as a function of simulation temperature for
the oligonucleotide duplexes (sequences: 5’ CACGCCAACCCTGCF 3’ and 5’ QGCAGGGTTGGCGTG 3’) at 0.1 µM. (b) Snapshot of the simulation cell showing oligonucleotide configurations in the initial (left) and final (right)
states ... 49 Figure 2.4 Change of fluorescence intensity (black) and unhybridized fraction (red) of
F-attached oligonucleotide sequence (5’ ATACGTGCF 3’) with simulation
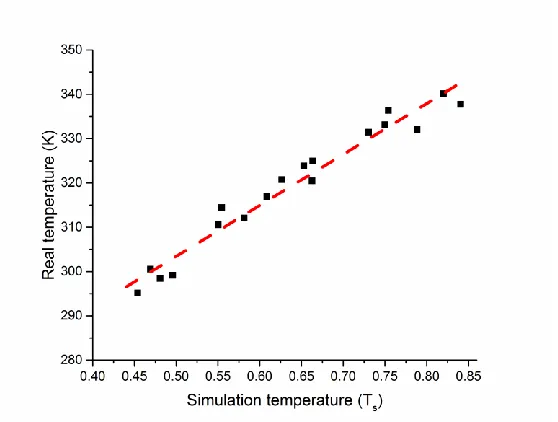
temperature change ... 50 Figure 2.5 Correlation between real temperature (K) and simulation temperature (Ts)
utilized in simulations. ... 51 Figure 2.6 Melting temperature change with concentration of oligonucleotide with
Sequence of 5’ TCTGACCGF 3’. ... 52 Figure 2.7 Comparison of total unhybridized fraction (red) with fluorescence intensity
(black) for (a) System 1 and (b) System 3. Green and blue curves represent the unhybridized fraction of Strands A and B, respectively ... 53 Figure 2.8 Comparison of fluorescence intensity between simulation and experiment for
oligonucleotide System 3 ... 54 Figure S2.1 Schematics depicting real bond and pseudobonds ... 55 Figure S2.2 Distribution of length of real bond and pseudo bond in CG nucleotide ... 56 Figure S2.3 Change of fluorescence intensity and unhybridized fraction of F-attached
oligonucleotide sequences with reduced temperature change ... 57 Figure S2.4 Comparison of simulated fluorescence intensity and simulated unhybridized
Figure S2.5 Comparison of simulation and experiment fluorescence intensity for System
1–8 ... .59 Figure 3.1 Schematic illustrations of (a) 4-armed, (b) 6-armed precursors, and (c) a
crosslinker ... 93 Figure 3.2 The (a) initial and (b) final snapshots from a simulation containing 6-armed
precursors (Blue – Precursor A, green – Precursor B) and crosslinker oligo-nucleotides (yellow). The inset figure of (b) is an enlarged representation of the hybridization of oligonucleotides; the base-pairing between the CG nucleotide beads is indicated by the red artificial bonds so that the hybridized state can be easily recognized. (c) The hybridized fractions of all oligo- nucleotides in precursors versus time. Curves of different colors indicate
results obtained from different precursor concentrations. ... 94 Figure 3.3 Percolation probability in three dimensions versus the precursor concentrations
for (a) 4-armed and (b) 6-armed precursor systems. Black, red, and blue curves in each figure represent precursors with molecular weight of 2, 5, and 10 kDa ... 95 Figure 3.4 Pore diameter distribution for percolated network of (a) 6-armed/10 kDa at a
variety of concentrations, (b) 6-armed/3.20 mmol/L at different molecular
weights, and (c) 10 kDa / 2.46 mmol/L at different shapes of precursors. ... 96 Figure 3.5 (a) The shape of hydrogel formed by 6-armed/10 kDa at 1.55 mmol/L (blue –
Precursor A, green – Precursor B, yellow – crosslinker, and red – artificial bond meaning hybridization). (b) and (c) show the positions of the pores (dark blue) in which molecules of 40.0 and 60.0 Å can move within the hydrogel (pink),
respectively ... 97 Figure 3.6 A contour map of pore of hydrogel formed by 6-armed/10 kDa at 1.55 mmol/L
at x = -55.0 Å . The areas of the pores that can be reached by different sizes of molecules (20, 40, and 60 Å ) are shown in blue colors with different intensities. .. 98 Figure 3.7 (a) Comparison of pore distribution and connectivity for percolated network by
6-armed/10 kDa at a precursor concentration of 1.55 mmol/L and (b) the characteristic pore diameters and pore connectivity thresholds of percolated
network by 6-armed/10 kDa at various precursor concentrations ... 99 Figure 3.8 Mean square displacement of spheres in (a) unpercolated network and (b) three
dimensionally percolated networks. Each curve represents MSD of molecules of different diameters ... 100 Figure S3.1 The projection views of (a) 3-dimensionally and (b) 2-dimensionally percolated
networks with periodic duplications. Top to bottom x-y, y-z, and z-x planes.
(b) 4-aremd/5 kDa, (c) 4-armed/10 kDa, (d) 6-armed/2 kDa, (e) 6-armed/5 kDa, and (f) 6-armed/10 kDa precursors. ... 102 Figure S3.3 Pore connectivity threshold of percolated network by different precursors ... 103 Figure 4.1 (a) All-atom, (b) united-atom, and (c) coarse-grained representation of DSPE.
The color scheme is: blue (type1 - ethanolamine); yellow (type2 - phosphate group); red and orange (type3 and 4 - ester linkage); cyan (type5 - alkyl tail
group); green (type6 - terminal tail group) ... 123 Figure 4.2 Plot comparing the continuous potential energy and our discontinuous potential
energy between coarse-grained site 1 and 2. ... 124 Figure 4.3 (a) The convergence percentage of gCG(r) and gA(r) in SS-IBI. Comparison
atomistic (black) and CG (red) RDFs between CG sites of types (b) 1-2, (b) 2-4, and (c) 3-3. ... 125 Figure 4.4 The convergence percentage of gCG(r) and gA(r) in SS-IBI and MS-IBI. ... 126
Figure 4.5 Figure 5. Snapshots of a DSPE lipid bilayer in CG DMD simulation at (a) T = 298K, (b) T = 340K, and (c) T = 370 K. RDFs from (d) atomistic and (e) CG
simulations at three temperatures ... 127 Figure 4.6 Comparison of the bilayer thickness measured from (a) the atomistic
CHAPTER 1 Motivation and Overview 1.1 Motivation
Drug delivery systems using nanoparticles have been developed to maximize therapeutic efficacy and minimize drug side effects by increasing residence time in vivo and selectively delivering drugs to target sites1-3. Nanoparticles (NPs) are typically 1 to 100 nm in size 4, and can be made of a variety of materials, including metals 5-6, ceramics7-8, polymers9-10, and
biomolecules11-12. Because of their small size, nanoparticles can pass through various barriers in the body, such as the blood-brain barrier13-14. Since nanoparticles can be synthesized to have a lot of space inside of them, they can deliver large amounts of drug15. Most of the nanoparticles used in drug delivery systems are water-soluble16-17, so that they can be administered intravenously, and can be discharged through normal metabolic functions without accumulating in the body18-19.
In the development of nano-sized vesicles for drug delivery applications, the self
assembly of bio- or biocompatible molecules has attracted attention20-21. The advantages of self-assembled biomaterials are that they are simple to make and can contain a variety of
functionalities such as stimuli responsive drug release22-23, protection from the human immune system24-25, and selective targeting to diseased areas26-27. Micelles, hydrogels, liposomes, and colloidosomes are some representative structures that can be formed via self assembly28-29. We are interested in DNA-mediated hydrogels and lipid bilayers because they are both
In order to realize the potential of biomolecular technology, a tool that can better represent biological molecules and nanoparticles on the molecular level is required. Computer simulation is an appropriate tool for visualizing and understanding the behavior of biomolecules. Molecular dynamics (MD) is representative computer simulation tool that complements and guides experimental research31. It can be used to test hypotheses about mechanisms underlying a physical phenomenon, and can be easier to perform, and less expensive, than real experiments. In addition, MD simulations allow us to observe the behavior of particles on a molecular level which is rarely possible in experiments. Although simulations are based on approximations, they are a good methodology for understanding and analyzing phenomena in nature.
Molecular dynamics simulation is divided into two types depending on the resolution: high-resolution models and low-resolution models. High-resolution models, also called atomistic models, are based on a detailed and realistic representation of molecular geometry, so that the movement of an atom is determined by the relationship with every other atom and with every solvent atom32. One weakness of atomistic models is that the detailed description of molecules increases computational load and prevents applying them to large systems or long time scales. On the other hand, low-resolution models, which are also called coarse-grained models, describe the geometry and energetics of molecules in a simplified method33-34. Coarse grained models group several atoms on a molecule into interaction sites, the molecule is then represented by a collection of interaction sites. This simplification decreases the number of interaction sites whose dynamics must be computed, improving the simulation speed and allowing access to longer time scales.
coarse grained models for use in discontinuous molecular dynamics simulations that can be used to study the formation of hydrogels and lipid bilayers.
1.2 Overview
In this section, we summarize Chapters 2 – 5 of this thesis. Chapter 2 is a preliminary study of DNA models for use in hydrogel simulations. Chapter 3 is a study of actual hydrogels using the model introduced in Chapter 2. Chapter 4 describes an improvement to the original coarse-grained lipid model, LIME. Finally, Chapter 5 briefly outlines future work. Each chapter includes a literature review and a bibliography.
Chapter 2 describes the development of an implicit-solvent coarse grained model for DNA. The DNA model was designed for use with discontinuous molecular dynamics
simulations of DNA-mediated hydrogels. The base, sugar, and phosphate are grouped together into a single coarse grained site. The model has four distinct types of nucleotides cytosine, guanine, thymine, and adenine. The model predicts the melting temperatures of oligonucleotides with different sequences, lengths and concentrations. In addition, the denaturation of
oligonucleotide triplexes containing a hybridized structure of three different oligonucleotides is captured by the DNA model; this will be used as the crosslinking moiety in hydrogel formation. The melting temperatures measured in the simulation are in agreement with the experimental data.
number of branches of PEG). Our simulation results show that precursors with large molecular weight and many arms are advantageous in forming network structures (hydrogels). The average pore size of the network is obtained from the pore diameter distribution and the pore throat diameter is measured by pore connectivity analysis. Hard spheres of various sizes are placed in the network to calculate their mean square displacements; the drug carrying ability of the hydrogel is quantified by comparing the mean square displacements of different size spheres.
Chapter 4 provides a description of initial work performed to develop an improved version of LIME, an intermediate resolution implicit-solvent model for lipid molecules developed in the Hall group. The multiscale modeling approach used to develop the original version of LIME is modified to calculate new parameters for the improved model. The
parameters for this model are obtained by collecting data from an atomistic simulation of DSPE lipid bilayers with explicit solvent. To overcome the drawbacks of LIME, multiple square wells are used to describe the intermolecular interactions between CG sites, and a multistate
Boltzmann inversion scheme is applied to find the interaction energy parameters. Unlike the original model, the new model parameters can be used in simulations at different temperatures.
1.3 References
1. Peer, D.; Karp, J. M.; Hong, S.; Farokhzad, O. C.; Margalit, R.; Langer, R., Nanocarriers as an emerging platform for cancer therapy. Nature Nanotechnology 2007, 2, 751. 2. Senapati, S.; Mahanta, A. K.; Kumar, S.; Maiti, P., Controlled drug delivery vehicles for
cancer treatment and their performance. Signal Transduction and Targeted Therapy 2018, 3 (1), 7.
3. Singh, R.; Lillard, J. W., Nanoparticle-based targeted drug delivery. Experimental and molecular pathology 2009, 86 (3), 215-223.
4. Buzea, C.; Pacheco, I. I.; Robbie, K., Nanomaterials and nanoparticles: Sources and toxicity. Biointerphases 2007, 2 (4), MR17-MR71.
5. Shankar, S. S.; Rai, A.; Ankamwar, B.; Singh, A.; Ahmad, A.; Sastry, M., Biological synthesis of triangular gold nanoprisms. Nature Materials 2004, 3, 482.
6. Grzelczak, M.; Perez-Juste, J.; Mulvaney, P.; Liz-Marzan, L. M., Shape control in gold nanoparticle synthesis. Chemical Society Reviews 2008, 37 (9), 1783-1791.
7. Hodes, G., Semiconductor and ceramic nanoparticle films deposited by chemical bath deposition. Physical Chemistry Chemical Physics 2007, 9 (18), 2181-2196.
8. Roy, I.; Ohulchanskyy, T. Y.; Pudavar, H. E.; Bergey, E. J.; Oseroff, A. R.; Morgan, J.; Dougherty, T. J.; Prasad, P. N., Ceramic-Based Nanoparticles Entrapping
Water-Insoluble Photosensitizing Anticancer Drugs: A Novel Drug−Carrier System for
Photodynamic Therapy.Journal of the American Chemical Society 2003, 125 (26), 7860-7865.
10. Balazs, A. C.; Emrick, T.; Russell, T. P., Nanoparticle Polymer Composites: Where Two Small Worlds Meet. Science 2006, 314 (5802), 1107-1110.
11. Barker, K.; Rastogi, S. K.; Dominguez, J.; Cantu, T.; Brittain, W.; Irvin, J.; Betancourt, T., Biodegradable DNA-enabled poly(ethylene glycol) hydrogels prepared by copper-free click chemistry. Journal of Biomaterials Science, Polymer Edition 2016, 27 (1), 22-39. 12. Xia, L.-W.; Xie, R.; Ju, X.-J.; Wang, W.; Chen, Q.; Chu, L.-Y., Nano-structured smart
hydrogels with rapid response and high elasticity. Nature Communications 2013, 4, 2226. 13. Saraiva, C.; Praça, C.; Ferreira, R.; Santos, T.; Ferreira, L.; Bernardino, L.,
Nanoparticlemediated brain drug delivery: Overcoming blood–brain barrier to treat neurodegenerative diseases. Journal of Controlled Release 2016, 235, 34-47.
14. Grabrucker, A. M.; Ruozi, B.; Belletti, D.; Pederzoli, F.; Forni, F.; Vandelli, M. A.; Tosi, G., Nanoparticle transport across the blood brain barrier. Tissue Barriers 2016, 4 (1), e1153568.
15. Lockman, P. R.; Oyewumi, M. O.; Koziara, J. M.; Roder, K. E.; Mumper, R. J.; Allen, D. D., Brain uptake of thiamine-coated nanoparticles. Journal of Controlled Release 2003, 93(3), 271-282.
16. Chen, Y.; Liu, Y.; Yao, Y.; Zhang, S.; Gu, Z., Reverse micelle-based water-soluble nanoparticles for simultaneous bioimaging and drug delivery. Organic & Biomolecular Chemistry 2017, 15 (15), 3232-3238.
17. Wang, D.; Miller, S.; Sima, M.; Kopečková, P.; Kopeček, J., Synthesis and Evaluation of Water-Soluble Polymeric Bone-Targeted Drug Delivery Systems. Bioconjugate
18. Panyam, J.; Labhasetwar, V., Biodegradable nanoparticles for drug and gene delivery to cells and tissue. Advanced Drug Delivery Reviews 2003, 55 (3), 329-347.
19. Sinha, R.; Kim, G. J.; Nie, S.; Shin, D. M., Nanotechnology in cancer therapeutics: bioconjugated nanoparticles for drug delivery. Molecular Cancer Therapeutics 2006, 5 (8), 1909.
20. Jang, Y.; Champion, J. A., Self-Assembled Materials Made from Functional Recombinant Proteins. Accounts of Chemical Research 2016, 49 (10), 2188-2198. 21. Huang, C.; Quinn, D.; Sadovsky, Y.; Suresh, S.; Hsia, K. J., Formation and size
distribution of self-assembled vesicles. Proceedings of the National Academy of Sciences 2017, 114 (11), 2910-2915.
22. Tayo, L. L., Stimuli-responsive nanocarriers for intracellular delivery. Biophysical Reviews 2017, 9 (6), 931-940.
23. Pandit, G.; Roy, K.; Agarwal, U.; Chatterjee, S., Self-Assembly Mechanism of a Peptide- Based Drug Delivery Vehicle. ACS Omega 2018, 3 (3), 3143-3155.
24. Shen, Z.; Fisher, A.; Liu, W. K.; Li, Y., 1 - PEGylated “stealth” nanoparticles and
liposomes A2 - Parambath, Anilkumar. In Engineering of Biomaterials for Drug Delivery Systems, Woodhead Publishing: 2018; pp 1-26.
25. Oltra, N. S.; Nair, P.; Discher, D. E., From Stealthy Polymersomes and Filomicelles to “Self” Peptide-Nanoparticles for Cancer Therapy. Annual review of chemical and
biomolecular engineering 2014, 5, 281-299.
26. Habibi, N.; Kamaly, N.; Memic, A.; Shafiee, H., Self-assembled peptide-based
27. Liu, Z.; Dong, C.; Wang, X.; Wang, H.; Li, W.; Tan, J.; Chang, J., Self-Assembled Biodegradable Protein–Polymer Vesicle as a Tumor-Targeted Nanocarrier. ACS Applied Materials & Interfaces 2014, 6 (4), 2393-2400.
28. Chen, M.; McDaniel, J. R.; MacKay, J. A.; Chilkoti, A., NANOSCALE
SELFASSEMBLY FOR DELIVERY OF THERAPEUTICS AND IMAGING AGENTS. Technology and innovation 2011, 13 (1), 5-25.
29. Dan, N., Chapter 1 - Vesicle-based drug carriers: Liposomes, polymersomes, and niosomes A2 - Grumezescu, Alexandru Mihai. In Design and Development of New Nanocarriers, William Andrew Publishing: 2018; pp 1-55.
30. Israelachvili, J. N.; Mitchell, D. J.; Ninham, B. W., Theory of self-assembly of lipid bilayers and vesicles. Biochimica et Biophysica Acta (BBA) - Biomembranes 1977, 470 (2), 185- 201.
31. Alder, B. J.; Wainwright, T. E., Studies in Molecular Dynamics. I. General Method. The Journal of Chemical Physics 1959, 31 (2), 459-466.
32. Lindahl, E.; Hess, B.; van der Spoel, D., GROMACS 3.0: a package for molecular simulation and trajectory analysis. Molecular modeling annual 2001, 7 (8), 306-317. 33. Marrink, S. J.; de Vries, A. H.; Mark, A. E., Coarse Grained Model for Semiquantitative
Lipid Simulations. The Journal of Physical Chemistry B 2004, 108 (2), 750-760. 34. Curtis, E. M.; Hall, C. K., Molecular Dynamics Simulations of DPPC Bilayers Using
“LIME”, a New Coarse-Grained Model. The Journal of Physical Chemistry B 2013, 117
Chapter 2
Development of a simple coarse-grained DNA model for analysis of oligonucleotide complex formation
2.1 Introduction
Nucleic acids, including deoxyribonucleic acid (DNA), have found application in a number of areas of biological and biomedical research. They have been used for the assembly of materials for over two decades due to their ability to bind to complementary strands [1], thereby driving reversible, sequence-dependent macromolecular organization [2]. Nucleic acids have been used in the preparation of micro- and nano-scaled materials including DNA origami structures [3] and DNA hydrogels [4]. In these systems, DNA chains are used as linkers to form three-dimensional macromolecules driven by hybridization between complementary strands. Furthermore, DNA-crosslinked polymeric hydrogels have been prepared by hybridization of DNA-tethered polymer chains [5-13]. Similarly, functional nucleic acids in the form of aptamers, catalytic DNA and RNA, and aptazymes have brought about the possibility of generating
intelligent materials that can respond to interactions with specific molecules [14, 15]. Aptamers are nucleic acid oligonucleotides selected through systematic evolution of ligands by exponential enrichment (SELEX) that bind molecular targets—including small molecules, proteins, and even whole cells—with high affinity in a manner similar to that through which antibodies bind to target analytes [16-18].
molecular targets that are secreted in high levels by diseased tissue, and to evaluate the potential of these hydrogels as molecularly-controlled drug delivery systems. Our main hypothesis is that nucleic acids, and more specifically aptamers, can be incorporated as structural and functional components of hydrogels, using their ability to identify and interact with molecular targets as a mechanism to trigger hydrogel degradation and consequently release drugs. Interaction of the hydrogels with the target molecules is expected to result in rapid disintegration of crosslinks due to preferential binding of the aptamer to its target. When the hydrogels are formed in the
presence of therapeutic agents, these agents are physically entrapped and molecularly-triggered hydrogel degradation will lead to drug release. This paper is the first in a three-part series describing development of a coarse-grained model for simulation of hydrogel formation, assessment of the hydrogel’s drug loading capacity, and hydrogel degradation when encountering target molecules.
In this paper, we introduce a coarse grained DNA model that can be used with discontinuous molecular dynamics to efficiently simulate hydrogels crosslinked with a large number of oligonucleotides. Coarse grained (CG) molecular models treat groups of several atoms as a single interaction site. Although all-atom models have been widely used to analyze the structure and thermal properties of short oligonucleotide sequences [19-21], coarse grained models have the advantage that they reduce the computational cost. Various CG models have been used to represent the structure of DNA and analyze its thermodynamic and mechanical properties [22-29]. To enable long-time observation of the hydrogel formation and target
sampling of much wider regions of conformational space, longer time scales, and larger systems [30]. DMD has been widely used in a variety of fields requiring long-time scale simulations such as protein folding [31, 32], self assembly of biomolecules [33, 34], and structural analysis of colloidal self assembly [35]. The combination of a CG DNA model and DMD simulation allows us to analyze hybridization and denaturation of oligonucleotides. Moreover, it provides a
framework for the future study of hydrogel formation, which requires simulation of large systems for long times.
The main consideration in developing a coarse grained model for DNA is that it should be capable of representing oligonucleotide hybridization and dehybridization. DNA
unhybridization, also referred to as DNA denaturation, is the process by which double-stranded deoxyribonucleic acid (dsDNA) is unwound and separated into two single strands (ssDNA). The temperature at which this phenomenon is observed is called the melting temperature (Tm), a property that is intrinsic to each oligonucleotide complex. The percentage of GC content of DNA has a significant effect on Tm. The length and concentration of oligonucleotides also affect the hybridization ability. Several studies have confirmed that Tm can be estimated with formulas based on the numbers of GC and AT bases [36]. In this paper, we describe the development of a DNA model that can be used for simulating hybridization of complimentary DNA strands and, ultimately, the formation of DNA-based hydrogels. Our model was designed to give a faithful estimate of the melting temperatures of oligonucleotides with different sequences at different concentrations, with predicted melting temperatures that are very close to the real melting temperature.
enable correlation to experimentally measurable parameters. Förster resonance energy transfer (FRET) is widely used to experimentally analyze the denaturation of oligonucleotides and calculate melting temperatures. This method measures the degree of energy transfer that occurs between donor and acceptor fluorophores or quenching between a donor fluorophore and a non-fluorescent broad-band absorber molecule (quencher) that are attached to the oligonucleotides. If the donor and acceptor are in close enough proximity, energy is transferred from the donor to the acceptor, so that emission of donor fluorescence is reduced. In these mechanisms, energy transfer requires that the wavelength of the donor’s fluorescence overlaps with the wavelength range of the acceptor’s absorption, and that both donor and acceptor molecules are within close proximity
(less than ~ 10 nm). In fact, the efficiency of fluorophore (F) /quencher (Q) energy transfer processes is a function of the donor/acceptor distance, r, as detailed by Equation 1:
(1)
where ET represents the efficiency of energy transfer and RO represents the Förster
distance, the distance at which the efficiency of energy transfer for a specific donor/acceptor pair is 50%. In our model, an F is tethered to one oligonucleotide and a Q is tethered to its
complement oligonucleotide, so that the F and Q face each other when their respective strands form a duplex. Thus, the extent of oligonucleotide hybridization is reflected in the fluorescence of the donor fluorophore. This method allows us to derive information about the self-assembly and stability of our model oligonucleotides.
Crick base pairing rule (A-T and C-G). The F and Q molecules involved in FRET are also coarse-grained to measure fluorescence intensity that would be obtained from experimental FRET analysis (F-Q method). These molecules are tethered to the end of a selected
oligonucleotide and of its complementary oligonucleotide. Simulations start from an initial configuration in which oligonucleotides are hybridized to their complements (the oligonucleotide duplex) and randomly located in a simulation box. The average distances between F and Q are measured throughout the simulation to obtain the fluorescence intensity. The simulations are performed on oligonucleotides with different sequences and lengths. The fraction of
oligonucleotides that is unhybridized (unhybridized fraction) is calculated and compared with the simulated fluorescence intensity to see how well the latter reflects the extent of oligonucleotide hybridization. Each oligonucleotide’s simulated melting temperature is calculated at different oligonucleotide concentrations, from 0.1 to 20.0 µM. At each concentration, the melting
temperature is compared with the estimated melting temperature obtained from Integrated DNA Technologies OligoAnalyzer Tool, an internet-based software that predicts melting temperatures of oligonucleotides (www.idtdna.com). By so doing, we demonstrate that our DNA model is capable of representing the shift in the melting temperature as the oligonucleotide concentration changes. We also perform experiments to measure the fluorescence intensity of oligonucleotide triplexes formed when three different oligonucleotides hybridize. In total, eight different
oligonucleotide triplex systems are prepared. The fluorescence intensities of each system are measured by using a spectrophotometer. Finally, we compare the simulated fluorescence intensity with the experimentally-obtained values for the eight oligonucleotide triplexes.
degree of quenching between F and Q in simulation. The shape of the curve is sigmoidal, and the simulation melting temperature is determined from the temperature at which the intensity is 50%. The unhybridized fraction and fluorescence intensity show very similar values at most
temperatures, which means that the fluorescence intensity is a good indicator of the hybridization state of oligonucleotides. We find a linear relationship between the simulation temperature and the real temperature, allowing us to convert the simulation melting temperatures to real melting temperature. The resulting melting temperatures are in close proximity to the melting
temperatures predicted using the OligoAnalyzer for oligonucleotides of length 8-16 base pairs (bp). The simulated melting temperatures increase as the oligonucleotide concentration increases, consistent with the characteristics of real oligonucleotides. Finally, the values of simulated melting temperatures for the oligonucleotide triplexes agree with the experimentally obtained melting temperatures. Thus, our DNA model shows the capability to predict fluorescence intensities and melting temperatures not only for a duplex but also for triplex structures of oligonucleotides.
2.2 Materials and Methods 2.2.1 Computational Model 2.2.1.1 Model Development
the system is 10.0 Å . Oligonucleotides are modeled as linear chains of 6 – 16 connected nucleotide beads with the given nucleotide sequence. The F bead is attached to the end of the oligonucleotide and the Q bead is attached to the end of that oligonucleotide’s complement. The nearest distance between F and Q is substituted into Equation 1 to determine the fluorescence intensity. The fluorescence intensity of the system is the average value of the intensity of all of the molecules at any given time point and temperature.
The oligonucleotide model has three kinds of bonds to maintain oligonucleotide
structure: covalent bonds, pseudobonds to maintain bond angles, and pseudobonds to maintain torsional angles. In an oligonucleotide, the bonds between adjacent CG nucleotide beads are covalent bonds (Figure 2.1b-i). Pseudobonds for bond angles are invisible bonds between one CG nucleotide bead and its non-adjacent nearest neighbor (Figure2. 1b-ii). Pseudobonds for torsional angles are also invisible bonds but they are imposed between the reference CG nucleotide bead and the second-nearest non-adjacent neighbor CG nucleotide bead, i.e. the CG nucleotide bead three positions away (Figure 2.1b-iii). Bond stretching of all types between two CG nucleotide beads on the same chain is limited to minimum and maximum bond length values. Supplementary Figure 2.1 explains all types of minimum and maximum bond lengths
graphically. When bonded CG nucleotide beads reach the minimum or maximum bond length, an infinite repulsion is generated so that they return to the prescribed bond length range [37, 38].
dynamics package developed for simulations of biomolecules [39] and AMBER is a set of force fields for biomolecules [40]. Two GROMACS atomistic simulations were conducted. The first simulation contained one oligonucleotide with sequence 5’ GGACGGTGCGAGGCG 3’ in a 60
Å × 60 Å × 60 Å simulation box with 6,980 water molecules added to fill the box, and the other system contained the complementary sequence with the same number of water molecules. The number of sodium cations and chloride anions in the simulation box was 21 each in order to mimic 160 mM salt conditions. The temperature was maintained constant using the Berendsen thermostat with a time constant of 0.1 ps [41]. Pressure was also kept constant (1.0 bar)
throughout the simulation. The trajectory of the oligonucleotide was collected for 30 ns with a time step of 0.001 ps. The centers of mass for each of the coarse-grained nucleotides on the oligonucleotide were calculated during the two simulations. The bond length distributions were obtained from these data by averaging the distances between the centers of mass of all bonded CG nucleotides, and the minimum and maximum bond lengths were extracted. The bond distribution plots are displayed in Supplementary Figure 2.2.
The extracted minimum and maximum bond lengths for the three types of bonds used to maintain the stiffness of CG oligonucleotides are as follows. CG distributions for bonds, angles, and torsional angles similar to those of atomistic simulation results can be realized by limiting the minimum and maximum distance obtained from the atomistic simulation to an appropriate range. The minimum bond and pseudobond lengths were refined by finding the smallest distance at which the bond distribution function reaches 30% of its maximum peak value, and the
minimum of 4.15 Å and a maximum of 5.22 Å . The pseudobond length for the bond angle has a minimum of 8.18 Å and a maximum of 9.82 Å , and the pseudobond length for the torsional angle has a minimum of 11.57 Å and a maximum of 14.00 Å . The bond distribution plots of CG
oligonucleotide are compared with those from atomistic simulations of the oligonucleotide in Supplementary Figure 2.2. The bond length parameters in our model are the mean values for all CG nucleotides, indicating that they do not depend on the specific species. We measured the persistence length, that is the length over which the orientation of a polymer segment persists, of the CG oligonucleotides used in this study to confirm the validity of the bond parameters. The persistence length is defined as follows: where L is the end-to-end
vector of a CG oligonucleotide, I0 is the vector between the first and second CG nucleotides, and l is the average bond distance between two adjacent CG nucleotides [42].
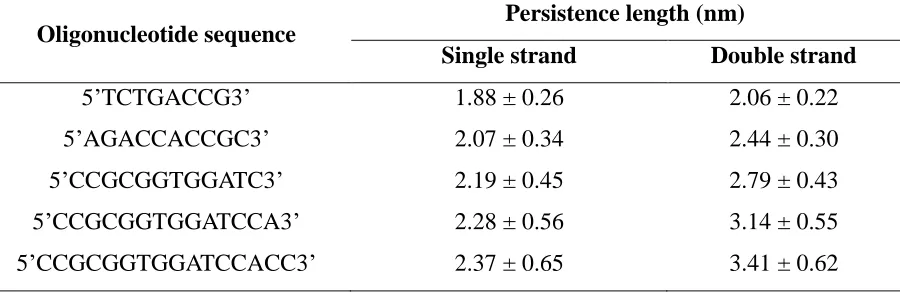
The measured persistence lengths of the single strand and double strand CG oligonucleotides with 8, 10, 12, 14, 16 bps are shown in Supplementary Table 2.1. The
persistence lengths of single strand oligonucleotide are 1.88 – 2.37 nm depending on the number of bps, which is close to the value for unstacked ssDNA calculated in the experimental work of Mills and co-workers (2.0 – 3.0 nm) [43]. The persistence length of double strand
oligonucleotide is known to be approximately 50 nm for 150 base pairs [44]. Based on our simulation results, we found that the dsDNA persistence length for 150 base pairs is predicted to be around 26 nm by linear regression, which means our model represents dsDNA as being more flexible than it actually is.
where r is the separation distance, is the sphere diameter, is the well width, and
is the interaction energy between two nucleotides i and j. The hard sphere diameter was
chosen to be 10.0 Å and the well width was chosen to be 15.0 Å . These parameters were chosen so that the average width of paired nucleotides in a duplex structure would be 23-25 Å , which corresponds to the actual diameter of the B-DNA helix [45]. The values of the interaction energies between complementary nucleotides were assigned based on the number of hydrogen bonds between base pairs. It is well known that cytosine and guanine base pairs are the result of the formation of three hydrogen bonds, and adenine and thymine base pairs are the result of the formation of two hydrogen bonds. However, the actual intermolecular energy does not increase proportionally to the number of hydrogen bonds. In Stofer’s study, the ratio of the interaction energy of A-T and C-G pairs in water was 1 : 1.35 [46]. Thus, the energy values of and
are set to 1.0 and 1.35, respectively. All other interactions, except A-T and C-G, are regarded
as hard sphere interactions. The modeled F and Q molecules do not have any interactions between them or with other nucleotides as well. Note that since water is modeled implicitly in these simulations, the interaction potentials between nucleotides are essentially potentials of mean force.
2.2.1.2 Oligonucleotide Simulations
a function of temperature. The lengths of each side of the box were chosen to achieve the molar oligonucleotide concentrations of 0.1, 0.25, 0.5, 1.0, 5.0, 10.0, 15.0, and 20.0 µM. The calculated box lengths were 6926.0, 5103.0, 4050.0, 3214.5, 1879.5, 1492.0, 1303.5, and 1182.5 Å for the respective concentrations. In the simulation of oligonucleotide triplex, the number of triplexes was 50 and the length of the simulation box was 9397.1 Å for a concentration of 0.1 µM. The Anderson thermostat was used to keep the temperature constant; In this technique, the velocity of a bead is tuned to maintain the system’s Maxwell–Boltzmann velocity distribution for the set temperature [47]. The simulation temperature (Ts) is unitless and defined to be the trend line that matches the simulation melting temperature with the actual melting temperature of
oligonucleotides.
The fluorescence intensity in simulations is related to the efficiency of energy transfer which is given in terms of the donor/acceptor distance, r, as described by Equation 1. The separation distance between the centers of the CG donor and acceptor is used for the
donor/acceptor distance. The Forster distance in the equation, Ro, depends on the nature of the
fluorophore and quencher molecules. In our work, Ro for the FAM6/BHQ-1 pair used in the
experimental work (Section 2.2) was set to 55 Å [48]. Since the efficiency of energy transfer between the fluorophore and quencher means the proportion of energy that is not emitted as fluorescence, the fluorescence intensity is determined by subtracting the value of the efficiency of energy transfer from 1. The average distance between the centers of mass of the CG donor and accepter in the system is inserted into Equation 1 to gives the efficiency of energy transfer
be 63.3 Å , the corresponding energy transfer efficiency will be 0.30 by the equation, and the fluorescence intensity will therefore be 0.70.
The fluorescence intensity values for oligonucleotide duplexes or triplexes in the DMD simulation as a function of temperature were obtained using the following protocol starting from a low temperature. (1) A simulation was conducted for up to 2 billion collisions at a fixed
temperature and the average value of the fluorescence intensity was calculated. (2) The temperature was then increased by 0.03 and a new simulation was performed. The initial configuration of the new simulation was the final configuration generated from the previous simulation, and the average value of the fluorescence intensity was calculated as well. Steps (1) and (2) were repeated until the temperature at which the fluorescence intensity reached 1.0.
The estimated melting temperatures of oligonucleotide duplexes were obtained from the OligoAnalyzer Tool, and compared with the simulated melting temperatures at a given
concentration. For oligonucleotide triplexes, the fluorescence intensity curves of simulation were compared with those of experiments at a fixed concentration of 0.1 µM.
2.2.2 Experimental Studies
2.2.2.1 Experimental Model – Oligonucleotide Triplexes
As a starting point for the demonstration of the validity of the model for the design of DNA complexes relevant to the preparation of molecularly responsive hydrogels, we focused on evaluation of the ability of the model to predict the behavior of an oligonucleotide triplex containing an aptamer. In this work, the aptamer-containing DNA structure-switching probes specific to adenosine that were first introduced by Nutiu and Li [49] were utilized. In their design, an aptamer is first synthesized with an oligonucleotide extension. Two additional
other with a quencher on its 5’ end, are also utilized (Figure 2.2A). When complexed, the spatial
proximity of the fluorophore and quencher results in an initial low level of fluorescence. An activation trigger such as interaction with a perfect complement of the aptamer strand,
biorecognition of the aptamer’s target, or temperature increase above a critical threshold leads to
dehybridization of the triplex, resulting in a measurable increase in the fluorescence signal of the system. In the work presented, the well-known adenosine aptamer (sequence 5’
ACCTGGGGGAGTATTGCGGAGGAAGGT 3’) was used as a model [50]. In addition,
6-carboxyfluorescein (FAM6) and Black Hole Quencher-1 (BHQ-1) were used as the fluorophore and quencher, respectively. FAM6 has absorption and fluorescence maxima at 495 nm and 520 nm, respectively, and an extinction coefficient of 20,960 L mol-1cm-1. BHQ-1 has a broad absorption spectrum with a peak at 534 nm, and a molar extinction coefficient of 8,000 L mol -1
cm-1 [51]. The chemical structures and spectra of FAM6 and BHQ1 are provided in Figure 2.2B.
2.2.2.2 DNA Sequences
DNA oligonucleotides were obtained from Eurofins Genomics (Louisville, KY). Oligonucleotides were first dissolved in deionized water (obtained with a Millipore Direct-Q® water purification system equipped with a Biopak® polisher and autoclaved to eliminate
DNAses) at a concentration of 100 μM and frozen in aliquots at -25 °C. All vials, pipet tips, and deionized water were autoclaved prior to use. Phosphate buffered saline (PBS, pH 7.4) was obtained from Kirkegaard & Perry Laboratories (KPL, Gaithersburg, MD) as a 10X concentrate. The 1X PBS solution is formulated as 10 mM sodium phosphate and 150 mM sodium chloride.
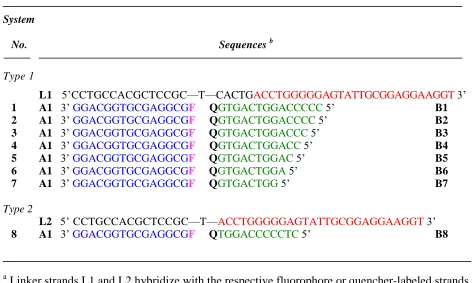
Table 1 lists the oligonucleotide sequences for the eight systems utilized in the
contains an aptamer sequence (red) with an extension on its 5’ end, (2) a fluorescently labeled
strand (green) that is complementary to the 5’ end of the L strand (blue), and (3) a quencher-modified strand that is complementary to the aptamer. FAM6 was used as the fluorophore on strand A1. FAM6 was covalently bound to the 5’-end phosphate of A1 oligonucleotide strands.
BHQ1 was covalently bound to the 3’-end of oligonucleotide strands B1-B8.
Two main system types were utilized, as shown on Table 1. The triplex systems in Type 1 (systems 1 through 7) utilize Linker 1 (L1) as an aptamer-containing moiety. In this system type, the quencher strands hybridize partially to the aptamer and partially to five of the aptamer extension’s nucleotides. System 8 from Type 2 utilizes a shorter aptamer-containing strand (L2) in which all of strand B8 hybridizes directly with the aptamer’s nucleotides and not to the
extension.
2.2.2.3 Estimation of Melting Temperatures
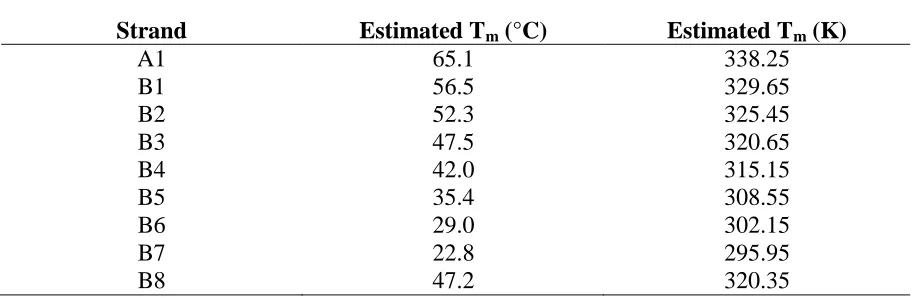
Estimated melting temperatures were obtained from Integrated DNA Technologies OligoAnalyzer utilizing a 0.1 µM oligonucleotide and 160 mM Na+ concentrations, matching the conditions utilized in experimental work and in simulations. Supplementary Table 2.2 lists the estimated melting temperatures (Tm) for each A and B strand with its perfect complement. All sequences were checked to ensure that there were no undesired stable self-dimers, hairpins, or hetero-dimers occurred using the OligoAnalyzer.
2.2.2.4 DNA Triplex Hybridization
Appropriate volumes of the appropriate oligonucleotide stocks (100 μM), 10X phosphate buffered saline (PBS), and deionized water were mixed under sterile conditions to make
was at a 1X concentration. As an example, 20 μL of L1, 20 μL of A1, and 20 μL of B1, 1,000 μL of 10X PBS, and 8,940 μL of water were mixed for preparation of 10 mL of system 1. Aliquots
of this mixture were then transferred into 1.5 mL microcentrifuge tubes, heated slowly and maintained at 95 °C for 10 minutes in an Eppendorf thermomixer. The mixtures were then allowed to come to room temperature in the thermomixer overnight prior to use.
2.2.2.5 Demonstration of Formation and Thermal Melting of DNA triplex
Hybridized oligonucleotide solutions were transferred into a quartz micro-cuvette. The fluorescence of the oligonucleotide complexes as a function of temperature was measured in a Varian Cary Eclipse fluorescence spectrophotometer from Agilent Technologies (Santa Clara, CA) equipped with a Cary Temperature Controller, a Temperature Probe Series II, and a Peltier 4 Position Multicell Holder accessory. Samples were heated and cooled from 5 °C to 95 °C over three cycles at a rate of 1 °C/min, pausing for 5 minutes at the highest and lowest temperature. Sample temperatures were monitored within the cuvette with a temperature probe coupled to the temperature controller. The fluorescence was recorded every 1 °C (λEx = 495 nm, λEm = 520 nm).
2.3 Results and Discussion
2.3.1 Melting Temperature Determination of Oligonucleotides from Simulated Fluorescence Intensity Curve
Figure 2.3a shows the simulation values of the fluorescence intensity versus the
simulation temperature for the example oligonucleotide sequence: 5’CACGCCAACCCTGCF 3’ with its perfect complement at an oligonucleotide concentration of 0.1 µM. The black line represents the final fluorescence intensity curve of the oligonucleotide, which is the average of 20 runs at each temperature. The standard deviations of average fluorescence intensity at each temperature are used as error bars. Figure 2.3b shows snapshots of oligonucleotides at the beginning and end of the simulation. For illustrative purpose, a red artificial bond is placed between the two CG nucleotides that base pair so that the hybrid state of the nucleotide can be identified easily. Below the melting temperature, the oligonucleotide is likely to form a duplex structure. Since F is located close enough to the Q, the fluorescence intensity is low. As the temperature increases past the melting point, the fluorescence intensity increases because the oligonucleotides are separated from each other and therefore the distance between Q and F is larger. As expected, the general shape of the simulated fluorescence intensity curve is sigmoidal. As shown in Figure 2.3a, the simulation melting temperature of 5’ CACGCCAACCCTGC 3’ and its perfect complement is 0.749, which is the temperature at which the fluorescence intensity is 50%. This analysis is applied to the simulations of various DNA hybrid sequences in the following sections.
2.3.2 Comparison of Fluorescence Intensity to Nucleotide Hybridization Extent
intensity curve reflects the hybridized state of an oligonucleotide. Experimentally,
oligonucleotide hybridization occurs on the molecular scale and is therefore difficult to monitor directly. Because of this, melting points and thermal stability of duplexed oligonucleotides can only be deduced using indirect analyses such as the fluorescence quenching (F-Q) method. Simulation enables direct monitoring of the hybridized fraction of oligonucleotide with single nucleotide resolution. The simulated hybridized fraction is the number of base pairs formed divided by the number of possible base pairings in the system at any given temperature. The simulated unhybridized fraction is simply expressed as:
(2)
Figure 2.4 compares the simulated fluorescence intensity curve (black) and the simulated unhybridized fraction curve (red) of the oligonucleotide (sequence : 5’ATACGTGCF 3’) and its complement at an oligonucleotide concentration of 0.1 µM. The simulation melting temperature of the oligonucleotide sequence is determined as 0.454 from the fluorescence intensity curve. The simulation temperature when the hybridized fraction reaches 50% is 0.451. As the
simulation temperature increases above 0.5, the rate of change in both the fluorescence intensity and the unhybridized fraction slow down, reaching a maximum of 1.0 at approximately the simulation temperature of 0.6. Thus, we see that the simulated fluorescence intensity calculated via the F-Q simulation method is almost identical to the simulated unhybridized fraction of the oligonucleotides over a range of simulation temperature.
the fluorescence intensity curve and the 50% unhybridized fraction temperatures. In all cases, the differences between the melting temperatures and 50% unhybridization temperatures are small; the oligonucleotide with the largest difference (5’ CCACGGTGGATCCA 3’) between the two temperatures has an absolute difference of about 0.010. Therefore, we find that the F-Q
simulation method adequately reflects the unhybridized state of the oligonucleotide samples that we investigated.
2.3.3 Correlation of Simulation and Real Temperatures
To identify the relationship between simulation temperature and real temperature, and enable comparison of simulation results with experiment, we determined the melting
temperatures of oligonucleotides with 18 different lengths and sequences via the F-Q simulation method. The oligonucleotide lengths were 8, 10, 12, 14, and 16, and the oligonucleotide
sequences were randomly selected. Supplementary Table 2.3 shows all the sequences of simulated oligonucleotides used in this study, their simulation melting temperatures obtained by the simulated F-Q method, and the predicted melting points from Integrated DNA Technologies OligoAnalyzer tool at oligonucleotide concentration of 0.1 µM and Na+ concentration of 160 mM. Figure 2.5 shows a plot of the real melting temperatures versus the simulation melting temperatures of the 18 different oligonucleotides. The relationship between the real melting temperature from the OligoAnalyzer tool in Kelvin and simulation melting temperature by the F-Q method in terms of simulation temperature units (Ts) is found to be T(K) = 114.95 · Ts + 245.97 K (red dashed line). Thus, the calculated melting temperatures in dimensionless units are converted to real temperatures using this relationship. For example, an oligonucleotide with a sequence of 5’ CTCGCGTCTTF 3’ shows 50% fluorescence intensity at Ts = 0.579 in
temperature predicted for this same sequence using the OligoAnalyzer tool is 313.40 K, making the gap between the two temperatures small, 0.99 K. The average difference of the real melting temperature and the converted melting temperature is of 2.44 K for all 18 oligonucleotide sequences. Thus, we conclude that the simulation temperature can be expressed by a first-order relationship to the real temperature.
2.3.4 Effect of Concentration on Oligonucleotide Duplex Stability
To ensure that the concentration dependence of oligonucleotides’ melting temperatures is well represented in our simulations, we measured the melting temperatures at different
concentrations. One interesting property of DNA hybridization is that the stability of hybridized oligonucleotides increases with the concentration of the oligonucleotide and thereby increases their melting temperature as well. Figure 2.6 compares simulated melting temperatures (red circles) to the predicted melting temperatures (black squares) obtained from the OligoAnalyzer for the sequence 5’ TCTGACCGF 3’ as a function of concentration. The change of simulated
intensity. Our DNA model is thereby able to reasonably calculate the melting temperature of oligonucleotides at different concentrations.
2.3.5 Comparison of Experimental and Simulated Oligonucleotide Triplex Stability and Melting Temperatures
We measured the fluorescence intensity and unhybridized fraction versus temperature of the oligonucleotide triplexes listed in Table 1 in simulations at 0.1 µM to see if the triplex fluorescence intensity reflects the hybridization state as well as it does for the duplexes. As described in Table 1, each triplex is composed of a long Linker strand (L), as well as two partially complementary strands A and B labeled with a fluorophore (F) and quencher (Q), respectively. Strand A forms a longer hybridization pair with the Linker strand, and therefore forms a more stable complex with higher melting temperature than Strand B. Between systems 1 and 7, the Linker (sequence : 5’CCTGCCACGCTCCGCTCACTGACCTGGGGGAGTATTG- CGGAGGAAGGT 3’) and Strand A (sequence : 3’ GGACGGTGCGAGGCGF 5’) sequences stay constant; only strand B differs in its length: it is longest in System 1 and shortest in System 7. Thus, the melting temperature difference between Strand A and Strand B is at a minimum in System 1, and at a maximum in System 7. Figure 2.7 compares the simulated fluorescence intensity (black), and the unhybridized fractions of Strand A (blue) and Strand B (green) when hybridized to the linker for two representative cases, Systems 1 and 3. The sequence of Strand B in System 1 is 3’QGTGACTGGACCCCC 5’, and that in System 3 is 3’QGTGACTGGACCC 5’. There are two major differences between the graphs of Systems 1 and 3. First, the total
System1 is that the simulated fluorescence intensity curve (black in Figure 2.7b) and the unhybridized fraction curve of Strand B (green in Figure 2.7b) are nearly identical. From
analysis of all of the systems in Supplementary Figure 2.4 a-g, we find that Systems 3 through 7 show an inflection in the total unhybridized fraction curve and agreement between the
simulated fluorescence intensity curve and Strand B’s unhybridized fraction curve. This behavior is a result of the large differences in thermal stability of Strands A and B in these systems (the melting temperature differences between Strands A and B for these systems are greater than 17.6 K). This difference causes sequential —as opposed to simultaneous— dehybridization; first Strand B dehybridizes and then Strand A dehybridizes. As Strand B leaves the triplex, FRET quenching immediately decreases, leading to the changes in fluorescence intensity associated with the hybridized state of Strand B.A similar phenomena occurs for System 8 (Tm,A – Tm,B = 17.9K), but in this case it is less pronounced than in the other systems (Supplementary Figure 2.4e). In summary, our simulations suggest that when Strands A and B composing the
oligonucleotide triplex have a melting temperature difference above 17.6 K, the fluorescence intensity of the triplex is decided by the unhybridization of the oligonucleotide with the lower melting temperature. In contrast, when the melting temperature difference between the two oligonucleotides is below 17.6 K, the fluorescence intensity is the result of the simultaneous denaturation of the two oligonucleotides that join the triplex together.
We then compared the simulated fluorescence intensity values for the oligonucleotide triplexes listed in Table 1 to the fluorescence intensity values from our own experiments over a range of temperatures. Figure 8 shows a comparison between the simulation (black line) and experimental (red line) fluorescence intensities versus temperature for System 3 (Linker :
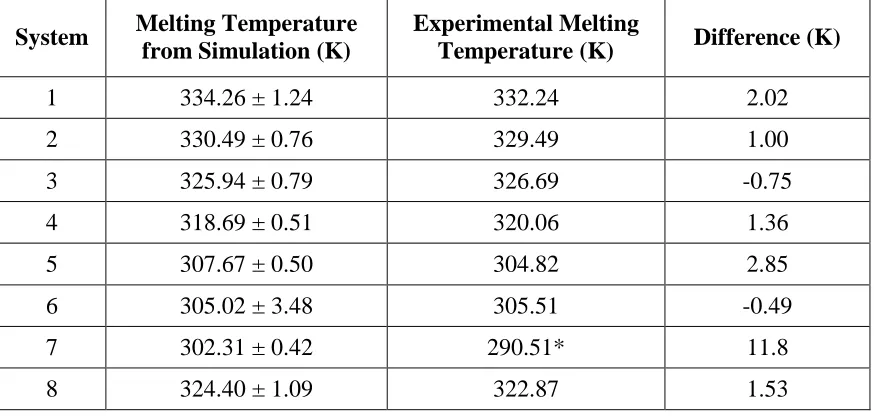
: GGACGGTGCGAGGCGF 5’, and Strand B : 3’QGTGACTGGACCC 5’). The results for Systems 1–2 and 4–8 can be found in Supplementary Figure 2.5 a, b, and d - h. The simulated fluorescence intensity curve for System 3 is in reasonable agreement with the experimental fluorescence intensity curve. The simulated melting temperature of System 3 is 325.94 K, very similar to the experimental value of 326.69 K. Table 3 shows the calculated melting
temperatures from simulations and the experimentally determined melting temperatures of all 8 oligonucleotide triplex systems. The average difference between the simulated and experimental melting temperatures is 2.73 K, although the largest difference is 11.8 K for System 7. It is worth mentioning that the experimental determination of the Tm for systems containing shorter
oligonucleotides (Systems 5, 6, and 7) has problems due to the low temperatures required to reach complete hybridization. Below 5 °C, the required temperature range to reach hybridization stability for these systems, cooling results in significant condensation outside of the cuvettes used for fluorescence spectroscopy, and this prevents accurate data collection. This issue is especially important for System 7 which would require temperatures below 0 °C to reach 100% hybridization, something that is not experimentally possible in our setup. Except for System 7, the simulated melting temperature values determined by our model generally agree with the experimental values. We conclude that our model is good enough to allow calculation of the melting temperatures of any oligonucleotide triplex in which the experimental measurements can be made accurately.
2.4 Conclusion
that contains a sugar, a phosphate, and a base. Each oligonucleotide strand is a chain of coarse grained nucleotides arranged in sequence order. Adenine beads are designed to interact with thymine, and cytosine beads are designed to interact with guanine to satisfy the Watson-Crick base pairing rule. The values of the interaction energies for A-T and C-G were obtained from Stofer [46]. We introduced three types of bonds to maintain oligonucleotide stiffness: covalent bonds, pseudobonds to maintain bond angles, and pseudobonds to maintain torsional angles. The distributions of the lengths of the three types of bonds used in DMD simulation were obtained from GROMACSs atomistic simulation data on oligonucleotides.
Simulations were performed to see how well our CG DNA model represents the hybridization of actual oligonucleotides (duplex form) under various conditions. First, we constructed fluorescence intensity curves of oligonucleotides with different lengths (8-16 bps) using the CG DNA model. The values of the fluorescence intensity were calculated by
corresponded to their predicted values. This shows that our CG model can be used at various concentrations.
The simulated fluorescence intensity was compared with the simulated unhybridized fraction of oligonucleotide triplexes, and the simulated melting temperatures were compared with experimental melting temperatures. Eight different types of triplexes were prepared; the Strand A and Linker sequences that make up the triplexes were the same for the eight triplexes, but the last oligonucleotide (Strand B) was of a different length. A graph of the simulated fluorescence intensity of all the triplexes versus temperature shows a sigmoidal shape as in the case of the oligonucleotide duplex. Although the fluorescence intensity of the oligonucleotide duplex correctly reflected the unhybridization state between oligonucleotide and its complement, the agreement between the simulated and experimental fluorescence intensity for the
oligonucleotide triplex depends on the differences between the melting temperatures of the two strands.When the melting temperature difference between Strands A and B is above 17.6 K, the fluorescence intensity of the oligonucleotide triplex reflects the unhybridization state of the oligonucleotide with the lower melting temperature due to the sequential separation of Strand A and Strand B. However, when the melting temperature difference is below 17.6 K, Strands A and B separate from the triplex simultaneously and it is not useful to interpret the fluorescence
intensity in terms of the unhybridization state of a specific oligonucleotide. The experimental fluorescence intensity curve of the triplexes was sigmoidal in shape as well. From the
This study lays the foundation for future work on analysis of hydrogels crosslinked by oligonucleotides. The CG DNA model that we have developed is capable of representing an oligonucleotide duplex’s hybridization state at different temperatures. Moreover, we have shown that our model is useful for analyzing the melting temperature of oligonucleotide triplexes which consist of strand A, Strand B, and Linker. In future research, we plan to tether Strand A to the end of one polymer chain (Precursor A), Strand B to the end of another polymer chain (Precursor B), and use a Linker oligonucleotide to crosslink those two precursors, forming a hydrogel. The fluorescence intensity analysis of the triplex will provide a basis for determining if a hydrogel can be formed at any given temperature.
Although the combination of CG DNA model with the DMD approach is able to simulate the melting temperatures of oligonucleotides, it has some limitations. First, as the coarse graining method groups the sugar, phosphate, and base into a single interaction site, it does not account for the details of the interactions at the molecular level such as hydrogen bonding and π-π
shortcoming can be remedied by making the base pair interactions anisotropic. Fourth, the DNA model is validated only for oligonucleotide systems with relatively short lengths (less than 16 bp). Finally, although model is reasonable enough to find the melting temperatures of
oligonucleotide triplex, there are parts where the simulated fluorescence intensity graph does not match the experiment because the exact location of occurring the energy transfer is not reflected.
2.5 Acknowledgements
2.6 References
1. Alder BJ, Wainwright TE. Studies in Molecular Dynamics. I. General Method. J Chem Phys. 1959;31(2):459-66.
2. Mirkin CA, Letsinger RL, Mucic RC, et al. A DNA-based method for rationally assembling nanoparticles into macroscopic materials. Nature. 1996;382(6592):607-9. 3. Hong F, Zhang F, Liu Y, et al. DNA Origami: Scaffolds for Creating Higher Order
Structures. Chem Rev. 2017;117(20):12584-640.
4. Cheng EJ, Xing YZ, Chen P, et al. A pH-Triggered, Fast-Responding DNA Hydrogel. Angew Chem Int Ed. 2009;48(41):7660-3.
5. Lin DC, Yurke B, Langrana NA. Mechanical Properties of a Reversible, DNA-Crosslinked Polyacrylamide Hydrogel. J Biomech Eng. 2004;126(1):104-10. 6. Wei B, Cheng I, Luo KQ, et al. Capture and Release of Protein by a Reversible
DNA‐Induced Sol–Gel Transition System. Angew Chem. 2008;120(2):337-9.
7. Yang H, Liu H, Kang H, et al. Engineering Target-Responsive Hydrogels Based on Aptamer−Target Interactions. J Am Chem Soc. 2008;130(20):6320-1.
8. Barker K, Rastogi SK, Dominguez J, et al. Biodegradable DNA-enabled poly(ethylene glycol) hydrogels prepared by copper-free click chemistry. J Biomater Sci, Polym Ed. 2016;27(1):22-39.
9. Yin B-C, Ye B-C, Wang H, et al. Colorimetric logic gates based on aptamer-crosslinked hydrogels. Chem Commun. 2012;48(9):1248-50.
11. Zhu Z, Wu C, Liu H, et al. An Aptamer Cross‐Linked Hydrogel as a Colorimetric Platform for Visual Detection. Angew Chem Int Ed. 2010;49(6):1052-6.
12. Francis WS, Francesco S. Model for assembly and gelation of four-armed DNA dendrimers. J Phys: Condens Matter. 2006;18(26):L347.
13. Nagahara S, Matsuda T. Hydrogel formation via hybridization of oligonucleotides derivatized in water-soluble vinyl polymers. Polym Gels Networks. 1996;4(2):111-27. 14. Lu Y, Liu J. Functional DNA nanotechnology: emerging applications of DNAzymes and
aptamers. Curr Opin Biotechnol. 2006;17(6):580-8.
15. Lu Y, Liu J. Smart Nanomaterials Inspired by Biology: Dynamic Assembly of Error-Free Nanomaterials in Response to Multiple Chemical and Biological Stimuli. Acc Chem Res. 2007;40(5):315-23.
16. Marshall KA, Ellington AD. [14] In vitro selection of RNA aptamers. Methods Enzymol.
318: Academic Press; 2000. p. 193-214.
17. Ellington AD, Szostak JW. Selection in vitro of single-stranded DNA molecules that fold into specific ligand-binding structures. Nature. 1992;355(6363):850-2.
18. Ellington AD, Szostak JW. In vitro selection of RNA molecules that bind specific ligands. Nature. 1990;346(6287):818-22.
19. Orozco M, Perez A, Noy A, et al. Theoretical methods for the simulation of nucleic acids. Chem Soc Rev. 2003;32(6):350-64.